CAPSI 2020 Proceedings Portugal (CAPSI) 10-2020
Logistic Performance & Dashboards: a flexible Power BI solution
Logistic Performance & Dashboards: a flexible Power BI solution
Diana SilvaPaulo Paulo Ana Amaro
Follow this and additional works at: https://aisel.aisnet.org/capsi2020
This material is brought to you by the Portugal (CAPSI) at AIS Electronic Library (AISeL). It has been accepted for inclusion in CAPSI 2020 Proceedings by an authorized administrator of AIS Electronic Library (AISeL). For more information, please contact [email protected].
20.ª Conferência da Associação Portuguesa de Sistemas de Informação (CAPSI’2020) 16 e 17 de outubro de 2020, Porto, Portugal
ISSN 2183-489X
1 da Silva, Diana M. C., Coimbra Business School | ISCAC, Polytechnic Institute of Coimbra,
Portugal, [email protected]
Pereira, Paulo, Singularity and Coimbra Business School | ISCAC, Polytechnic Institute of Coimbra, Portugal, [email protected]
Amaro, Ana C.S., Coimbra Business School | ISCAC, Polytechnic Institute of Coimbra, Portugal, [email protected]
Abstract
The developments in Information Systems and Technologies brought numerous challenges to company’s management regarding decision tools and frameworks availability. The state of art emphasizes the knowledge carried out by digital transformation to the business models that embed optimized information, and flexible managing solutions. These, impact logistic service providers and, particularly, the competitiveness of the transportation companies that represent a sector with recognized importance in the economy of most countries.
This study proposes a dashboard framework to help transportation managers’ decisions. A set of metrics and key performance indicators were developed to exploits and incorporate the details of logistics decisions.
A Power BI proposal was developed and implemented in a SME transportation company. The data model established proved to be adapted to the problem description and the dashboard reaches a robust representativeness of the key indicators. These helped managers’ solving transportation problems through data-driven decision-making processes and, therefore, improved company’s competitiveness.
Keywords: Dashboard; Key Performance Indicators (KPI); Power BI, Freight Transportation Planning and Logistics Performance.
1.
I
NTRODUCTIONTransportation is an essential activity to the logistic function since it provides the movement of the goods while establishing the physical bridge between the production and consumption points (Domingues, 2015). Companies in this area faced important challenges and large competitive requirements. To mitigate those changes, companies invest in and look for alternative solutions to improve efficiency and effectiveness in their operations, besides adjusting the relevant business processes (Kucińska-Landwójtowicz & Lorenc, 2017).
In this paper, a Portuguese SME (Small and Medium-Sized Enterprise) classified as a transportation service provider is described. Over the forty years of experience in road freight transport, the company suffered several restructurings and currently works as a Third Party Logistic (3PL) provider for numerous prestigious companies, from several economic sectors, such as paper,
20.ª Conferência da Associação Portuguesa de Sistemas de Informação (CAPSI’2020) 2 ceramics, steel, plastic products, metalworking, furniture, food products, medicines, textile, manufacturing, among others. For confidentiality reasons, the company’s name will not be referred. Recognized as a leading SME over the years by IAPMEI (Portuguese Agency forCompetitiveness and Innovation), the company became one of the fastest-growing transportation companies. Currently, it employs about a hundred people, whose experience and qualification are preponderant to guarantee services’ quality and to allow the offer of several logistics and transportation solutions such as, general cargo, groupage, temperature-controlled, hazardous materials (ADR), express services, and warehousing.
Following the scientific motivations and the lack of research on transportation performance measures and decision tools, a novel approach was developed. A great incentive was also placed by the transport company focused on decisions making supports to help managers, for a real working environment, strengthening and increasing the company’s adaptability to market conditions. So, this paper aims to develop and contribute with a flexible Power BI solution that will help logistic providers improving transportation solutions through data-driven decision-making processes supported on performance measuring and monitoring. Some Key Performance Indicators (KPI) are developed and implemented in a dashboard proposal that offers a versatile decision support to transportation managers.
The paper is organized as follows: Section 2 provides a brief overview of “Literature Remarks”, emphasizing relevant research contributions. Section 3 is dedicated to the methodology, data and indicators presentation, and section 4 is devoted to the data model and features. The framework analysis and results will be addressed in section 5 where the operational planning dashboard and the analysis of results are performed. Finally, section 6 presents the main conclusions and ideas for future work.
2.
L
ITERATURER
EMARKSTransportation is considered one of the most important components of distribution and logistics. In modern logistic system, transportation is a major task that should be managed in a systematic way, while ensuring appropriate cost restrictions and service levels (Topolšek et al., 2018).
Besides that, a growing interest in service providers, particularly in 3PL, emerged. These companies can be defined as providers of a single or multiple logistics services to a client company, on a contractual basis. Commonly, services provided by a 3PL are transportation, warehousing, inventory management, material handling, cross-docking, reverse logistics, freight forwarding, and customer services. Also, various information-related services and value-added activities like packaging, order processing, barcoding, among others, can be provided (Özoglu & Büyükkeklik, 2017).
20.ª Conferência da Associação Portuguesa de Sistemas de Informação (CAPSI’2020) 3 In the transportation sector, there are several threats, the fluctuations in the price of fossil fuels are of greatest impact. In the studied company, to mitigate that problem, a regular investment on fleet renewal is used as a practice to reduce the consumption of fuels and improve the overall costs. The fact that the case company has its own and updated fleet, long experience in the sector, and a prestigious image on the German market are strengths for the company position.
On the order hand, transportation companies realized the importance of monitor and understand their own data and performance metrics, to compete in a constantly changing environments. To do so, Performance Indicators (PI) are used as quantifiable metrics that provide a method for measuring the quality of the operation. These indicators reflect the performance of all components in the company’s overall objective and return the degree to which the objective is being achieved. Thus, PI can be seen as a toolbox, designed to control and manage organization’s critical factors. PI are “Key Performance Indicators, KPI” only when they are extremely important to obtain a competitive advantage. A small number of KPI should be preserve just to keep everyone’s attention focused on that commitment (Posset et al., 2010).
Later on, Kucińska-Landwójtowicz & Lorenc (2017) emphasized the importance of measuring and monitoring performance indicators for the operation of all transportation companies. Also, KPI were considered inevitable for company’s logistics processes, allowing both the improvement of companies’ operations and the increase of market competition (Radović et al., 2018).
Additionally, Business Intelligence (BI) technologies emerged as a vital role for many organizations, especially for those having a high amount of data. The BI concept involves a set of tools and techniques used in a wide range of activities ranking from the collection, consolidation, analysis, and even the provision of management information for decision making (Dresner, 2013). Therefore, BI systems allow easier store, retrieve and analysis of large amounts of data and let companies improve strategic and tactical decisions and gain a competitive advantage in the sector (Arefin et al., 2015; Siemen et al. 2018). BI Technology provides highly accurate information and the appropriate tools for data analysis, and decision-making processes (Wauyo et al., 2017).
Due to these advantages, BI systems are widely adopted or in process of being adopted by organizations (Arefin et al., 2015). Accordingly, BI solutions captured the interest of SME, since it enables insights into their customers’ behaviour and preferences and offers some competitive advantage (Bernardino, 2013). However, research indicates that SME more rarely engage in the field of BI than large enterprises (Siemen et al., 2018). This happens because BI solutions are demanding concerning the trade of investment, infrastructures, and human support (Bernardino, 2013). Nevertheless, collaborative BI practices represent promising solutions for these obstacles by resource bundling and data sharing in enterprise networks (Siemen et al., 2018). Also, BI systems
20.ª Conferência da Associação Portuguesa de Sistemas de Informação (CAPSI’2020) 4 include different technological components (e.g. databases, visualization tools, and online analytical processing), which allow decision-makers to work with subsets of data (Richards et al., 2017). Concerning the providers of BI platforms, Gartner (2019) identifies Microsoft, Tableau and Qlik as the larger industry leaders. Each of these solutions has some specific details. Firstly, Power BI is the platform provided by Microsoft and it is characterized by a collection of software services, applications and connectors that allow users to transform unrelated data sources into coherent, visually engaging, and interactive information, as well as sharing content (Microsoft, 2020). Secondly, Tableau offers an interactive, and visual exploratory experience on-site, as a stand-alone desktop application or integrated with a server to share content (Gartner, 2019). Finally, Qlik offers data recovery, agile analytics, and BI through its Qlik Sense product, which is mainly used for decentralized analysis and for cases of providing agile and centralized BI (Gartner, 2019).
Regarding the architecture of the solution, different data-driven processes are commonly used to support the BI application. These involve data sourcing, automation as well as extracting, transforming, and loading data processes and services. Also, data visualisation and the techniques used to structure data are other relevant steps. In here, dashboards assumed a crucial role as an interface and/or visual panel that allow a quick understanding of the most relevant metrics (Alexander & Walkenbach, 2010). These involve the use of graphs that can show trends and allow comparisons, provides relevant information, and allows significant conclusions to facilitate users’ analysis. Following this idea, Kaushik (2010) defined the major pillars to design an ideal dashboard, as an action-oriented and significant tool for solving companies’ problems.
Recently, Khalid et al. (2020) developed a BI dashboard for driver performance in a transportation company and concluded about the business insight introduced by dashboard information and about their positive impact in the decision-making process.
Therefore, all the scientific contributions discussed motivated the study presented in this paper. The lack of some research topics emphasized the opportunities to contribute with Power BI solutions to help decision processes in logistic providers while improving the measuring of their performance to anticipate decisions and enhance competitiveness.
3.
M
ETHODOLOGY,
D
ATA ANDI
NDICATORSThis study proposes a decision framework based on a dashboard solution that embeds a set of metrics and key performance indicators, exploiting the characteristics of service providers, while incorporating the required operational details to support managers’ decision-making process. The core concepts behind the proposed developments are detailed in the following subsections.
20.ª Conferência da Associação Portuguesa de Sistemas de Informação (CAPSI’2020) 5
3.1. Solution Architecture
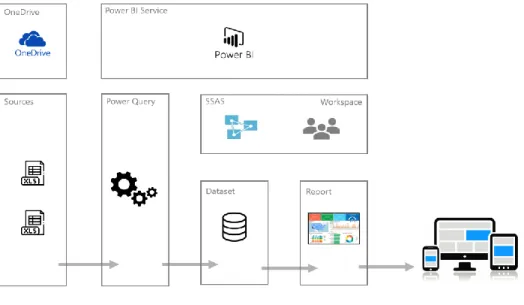
As formerly mentioned, different data-driven processes are commonly used to support the BI solution. In this proposal, the solution uses Microsoft Excel files as data sources. To simplify the automation process of updating data presented in the Power BI report, the files were placed in a folder hosted on the OneDrive service. So, the decision for a cloud service allowed access to data located on-premises, without the implementation of a Power BI Gateway, Figure 1.
Figure 1 – Implemented BI solution architecture
Besides that, the process of extracting, transforming, and loading the data is ensured by the Power Query component through M Language. A specific Workspace Power BI was created to facilitate its administration and maintenance. In this workspace, the developed report is stored, as well as the Dataset Power BI, which stores all the necessary data for rendering the report built using SQL Server Analysis Service technology, Figure 1. Also, the consumption of the developed reports can be made through the Power BI Service or the existing mobile application.
3.2. Data Collection Methods and Procedure
To identify all the important data, both qualitative and quantitative, and to set relevant data collection, some unstructured interviews were performed. These involved company’s managers, financial and traffic managers that gathered questions related to the requirements classified as extremely important for daily activities. Accordingly, the following issues were enumerated: for vehicles: individual fuel consumption, daily availability for services, number of semi-trailers available by typology, mileage, road accidents, number of provided services by nature, average age of trucks and semitrailers, temperature deviations for each refrigerated semi-trailers; for drivers: speed analysis and calculation of the end of the 45 hours biweekly mandatory rest; for customers: range of revenues, rate of complaints, and service performance.
20.ª Conferência da Associação Portuguesa de Sistemas de Informação (CAPSI’2020) 6 After the interviews, digital data started to be collected to support, at least, some of the considered key questions. In here, it is important to notice that the company owns a large amount of data, but just a limited part is digitally available, making data analysis and decision processes difficult and time-consuming. So, relevant data that were recorded in physical support were identified and started to be collected into a digital format.
The implemented ETL (Extract, Transform, and Load) process consists of three steps. In the extract step, files are in Excel format and each Excel table of interest will be loaded individually into Power Query. Then, in the second stage of the ETL process, transform, the Power Query Editor is used to:
• Remove the first row and use the second as a header, because the column beginning of the data starts in the second row.
• Remove all the unnecessary columns, the ones that have no interest to analyse.
• Remove the nulls and remove or replace with the correct values the blank values to ensure accurate analysis and to standardize values.
• Create a calendar table to use as data segmentation.
The third and last stage of the ETL process, called loading, consists of loading data into the target Data Warehouse (DW) database. In case of load failure, a recover mechanism is in place to restart from the point of failure without data integrity loss. The Incremental Load was used, which applies ongoing changes, periodically. At this stage, some verifications were made, such as: ensure that the key data fields were neither missing nor null; check the combined values and calculated measures; data checks in dimension tables; and check the BI reports.
3.3. Performance Indicators
Data processing proved its usefulness to answer the questions of company’s traffic managers and directors, but data collection and the processing phase revealed to be a complex step, due to the insufficiency of digital data, both qualitative and quantitative.
The business processes to be measures are: (i) sales, through the services provided, (ii) results, through the sales volume and fuel consumption and (iii) quality of the service, through accidents and complaints rate, fleet availability and the respective average age. The KPI implemented in the organization’s daily activity were also identified, being them the fuel consumption and the fleet availability. All the identified and created indicators were properly structured in the following table.
20.ª Conferência da Associação Portuguesa de Sistemas de Informação (CAPSI’2020) 7
Table 1 – Set of selected performance indicators
INDICATOR FORMULA Fuel Consumption (L/100km) 𝐹𝐶𝑣,𝑡= v=1,…,NV;t=1,…,NT ∑(𝐹𝑢𝑒𝑙 𝑖𝑛 𝑙𝑖𝑡𝑒𝑟𝑠) − 𝐿𝑖𝑡𝑒𝑟𝑠 𝑟𝑒𝑚𝑜𝑣𝑒𝑑|𝑣,𝑡 𝐾𝑚 𝑜𝑓 𝑐𝑢𝑟𝑟𝑒𝑛𝑡 𝑡𝑟𝑖𝑝𝑣,𝑡− 𝐾𝑚 𝑜𝑓 𝑝𝑟𝑒𝑣𝑖𝑜𝑢𝑠 𝑡𝑟𝑖𝑝𝑣,𝑡−1 ∗ 100
Nature of the Service (%) 𝑁𝑆𝑘= k=1,…,NK (𝐴𝑚𝑜𝑢𝑛𝑡 𝑜𝑓 𝑠𝑒𝑟𝑣𝑖𝑐𝑒𝑠 𝑝𝑟𝑜𝑣𝑖𝑑𝑒𝑑 𝑜𝑓 𝑛𝑎𝑡𝑢𝑟𝑒 𝑘 𝑇𝑜𝑡𝑎𝑙 𝑎𝑚𝑜𝑢𝑛𝑡 𝑜𝑓 𝑎𝑐𝑐𝑜𝑚𝑝𝑙𝑖𝑠ℎ𝑒𝑑 𝑠𝑒𝑟𝑣𝑖𝑐𝑒𝑠 ) ∗ 100 Accident Rate (%) AC= ( 𝐴𝑚𝑜𝑢𝑛𝑡 𝑜𝑓 𝐴𝑐𝑐𝑖𝑑𝑒𝑛𝑡𝑠 𝑇𝑜𝑡𝑎𝑙 𝑎𝑚𝑜𝑢𝑛𝑡 𝑜𝑓 𝑎𝑐𝑐𝑜𝑚𝑝𝑙𝑖𝑠ℎ𝑒𝑑 𝑠𝑒𝑟𝑣𝑖𝑐𝑒𝑠) ∗ 100 Complaints Rate (%) CR= ( 𝐴𝑚𝑜𝑢𝑛𝑡 𝑜𝑓 𝑐𝑜𝑚𝑝𝑙𝑎𝑖𝑛𝑡𝑠 𝑇𝑜𝑡𝑎𝑙 𝑎𝑚𝑜𝑢𝑛𝑡 𝑜𝑓 𝑎𝑐𝑐𝑜𝑚𝑝𝑙𝑖𝑠ℎ𝑒𝑑 𝑠𝑒𝑟𝑣𝑖𝑐𝑒𝑠) ∗ 100 Fleet Availability 𝐹𝐴𝑗= j=1,…,NJ ∑ 𝐴𝑚𝑜𝑢𝑛𝑡 𝑜𝑓 𝑣𝑒ℎ𝑖𝑐𝑙𝑒𝑠 𝑜𝑓 𝑡𝑦𝑝𝑒 𝑗 Fleet’s Average Age (years)
𝐹𝐴𝐴𝑗= j=1,…,NJ ∑(𝐴𝑚𝑜𝑢𝑛𝑡 𝑜𝑓 𝑣𝑒ℎ𝑖𝑐𝑙𝑒𝑠 𝑜𝑓 𝑡𝑦𝑝𝑒 𝑗 ∗ 𝐴𝑔𝑒) 𝑇𝑜𝑡𝑎𝑙 𝑎𝑚𝑜𝑢𝑛𝑡 𝑜𝑓 𝑣𝑒ℎ𝑖𝑐𝑙𝑒𝑠 𝑜𝑓 𝑡𝑦𝑝𝑒 𝑗 Customer Value (€) 𝐶𝑉𝑐 = c=1,…,NC ∑ 𝑈𝑛𝑖𝑡 𝑝𝑟𝑖𝑐𝑒 𝑜𝑓 𝑎𝑐𝑐𝑜𝑚𝑝𝑙𝑖𝑠ℎ𝑒𝑑 𝑠𝑒𝑟𝑣𝑖𝑐𝑒𝑠 𝑡𝑜 𝑡ℎ𝑒 𝑐𝑙𝑖𝑒𝑛𝑡 𝑐
Average Price per Service (€)
𝐴𝑃𝑆 = ∑
𝐵𝑖𝑙𝑙𝑖𝑛𝑔
𝑇𝑜𝑡𝑎𝑙 𝑎𝑚𝑜𝑢𝑛𝑡 𝑜𝑓 𝑎𝑐𝑐𝑜𝑚𝑝𝑙𝑖𝑠ℎ𝑒𝑑 𝑠𝑒𝑟𝑣𝑖𝑐𝑒𝑠 Average Price per Kilometre (€)
𝐴𝑃𝐾 = ∑
𝐵𝑖𝑙𝑙𝑖𝑛𝑔
𝑇𝑜𝑡𝑎𝑙 𝑎𝑚𝑜𝑢𝑛𝑡 𝑜𝑓 𝑘𝑖𝑙𝑜𝑚𝑒𝑡𝑟𝑒𝑠 𝑡𝑟𝑎𝑣𝑒𝑙𝑒𝑑
The definition and motivations behind the selection of these indicators are explained below. The
Fuel Consumption indicator is measured for each vehicle (v=1,…,NV), after each completed trip
(t=1,..,NT). In our case company, each driver is assigned to a single truck and normally doesn’t changes. So, this indicator can help traffic managers to mutually understand truck performance and drivers’ characteristics, while aiding to fixed problems like vehicle maintenance or driver assistance. Instead, the Nature of the Service measures the rate of services performed by nature (e.g. “national”, “importation” and “exportation”, k=1, 2, 3), considering the number of services done and the total number of accomplished services. This indicator will help both directors and traffic managers to identify improving possibilities namely if there are trips involving empty truck return. Regarding the Accident Rate, it considers the amount of accidents and the number of accomplished services. Each accident entails costs for companies, being desirable that such situations do not happen. When analysing this indicator, companies are able to comprehend how regularly accidents
20.ª Conferência da Associação Portuguesa de Sistemas de Informação (CAPSI’2020) 8 happen and understand whether it will be a matter of seasonality, physical or mental tiredness of the driver or conditions related to the mechanical part of the vehicle, among others. About the
Complaints Rate measures the rate of clients’ satisfaction, considering the amount of complaints
and the number of accomplished services. Theft of goods, delays in delivery, among others, are possible reasons that can give rise to complaints from customers. The analysis of this indicator allows the company to recognize the quality of its services and identify opportunities for improvement. Instead, Fleet Availability allows to assess the number of vehicles, of each typology,
j=1,…,NJ, that incorporate the company’s fleet. These indicators are very useful for both, traffic managers to assign and adjust services and to the company managers, to decide on fleet acquisitions or sales. The Fleet’s Average Age may also help on that decision since it identifies the number of vehicles of a certain type and the respective age, according to the year of production. Additionally, to maintain the level of quality and competitiveness, it is necessary to have a technological updated fleet that complies with the European standards namely on toxic exhaust emissions.
Concerning the Customer Value, these indicators represent the customers’ contribution to the company results. Customers, c=1,…,NC, have different weight based on the billing value. In this sense, customers with a higher turnover are prioritized and satisfied to the maximum, as they are responsible to keep the company results. The Average Price per Service represents the billing for each accomplished service. Recalling that some services are sometimes necessary, while not profitable, this indicator helps the traffic manager to understand if the average price bid by the customer fulfils the company’s requirements. Instead, the Average Price per Kilometre calculates the value received per kilometre travelled by the fleet. Some traffic managers prefer the average price per kilometre, however, there are other factors than the distance, namely, the type of service (e.g. refrigerated), the type of trailer (box or tarpaulin), the type of cargo (ADR), among others.
4.
D
ATAM
ODEL ANDF
EATURESMicrosoft’s Power BI is the selected tool for this project because it is a free and intuitive tool, similar to other developed by Microsoft, like the Microsoft Office. The similarity of the DAX language with the Excel formulas is also an important characteristic.
DAX experts say “DAX is simple, but it is not easy”, Ferrari (2020). This is mainly because the same
measure in different contexts can present different values. So, DAX is more complex than Excel, mainly due to the formulation language, but more powerful than Excel because it takes advantage of the calculation context. Besides, DAX is a functional language extremely elegant from a mathematical point of view, however, complex and extremely dependent on users’ knowledge and practical experience.
Moreover, Power BI allows the connection of data from several different sources such as: Access, Azure, Excel, Google Analytics, IBM, Microsoft Exchange, SQL Server, Web, among others.
20.ª Conferência da Associação Portuguesa de Sistemas de Informação (CAPSI’2020) 9 Microsoft offers data preparation, visual discovery of data, interactive dashboards and augmented analysis through a single product, Power BI. This product is a reporting tool that allows to: (i) Access data from almost any source (database tables, flat files, cloud services, folders, among others) and create fully automated modelling and data loading procedures; (ii) create table relationships to analyse holistic performance across a data model; (iii) Improve data sets and prepare advanced analyses with DAX expressions; and (iv) create custom BI tools with the best visualization capabilities, Gartner (2019).
Power BI has an ETL tool called Power Query, which uses the M language (Power Query Formula Language) to define the ETL processes. The Power BI analytical model maintains the necessary data in a tabular data model, based on the Common Data Model technology.
Besides that, the Power BI data model has better performance with typical Data Warehouse (DW) or star schema or snowflake architectures. In this proposal, the data model used is classified as a snowflake schema, which is “a variation on the star schema and consists of a single fact table that is connected to many dimension tables, that can be connected to other dimension tables through a many-to-one relationship”, IBM Knowledge Center (n.d.-b). A many-to-one relationship refers to one table or entity that contains values and refers to another table or entity that has unique values, IBM Knowledge Center (n.d.-a).
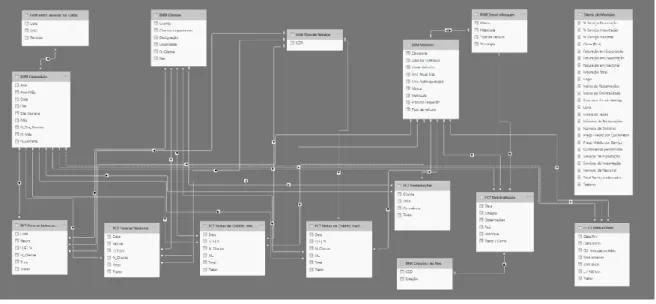
The present model contains several tables, both dimension and fact tables. The number of tables depends on the volume of data and in our case, the data model contains seven dimension tables and also seven fact tables.
Figure 2 – Tabular data model
According to Microsoft (2019b), the dimension table describes business entities and can include products, people, places, and concepts including time itself, which means that these tables contain at least one key column that acts as a unique identifier and descriptive columns. On the other side,
20.ª Conferência da Associação Portuguesa de Sistemas de Informação (CAPSI’2020) 10 fact table contains dimension key columns that relate to dimension tables and numeric measure columns and can store observations or events, such as sales notes, stock quantities, and temperatures, among others. The dimension key columns determine the granularity of a fact table. Another difference is, the dimension tables contain a relatively small number of rows while fact tables can contain a large number and may continue to grow over time.
For the case study company, seven fact tables were used, namely: invoicing and credit notes for national and international customers, claims, road accidents and control of fuel consumption. The seven dimension tables are related to customer and service information, fleet, semi-trailers characteristics’, calendar, and seasons.
The dimension table for dates recording should be created because most data analysis involves browsing and comparing over time, and this type of table is essential for working effectively with dates (Microsoft, 2020). To do so, we used Data Analysis Expressions (DAX) which consists of a collection of functions, operators, and constants that can be used in a formula, or expression, to calculate and return one or more values (Microsoft, 2019a).
After tables creation and full data processing, relations between tables have been generated using a relationship model that relates one column in a table to one column in a different table. Each relationship has a cardinality that is divided, based on Power BI possibilities (Microsoft, 2019b), in four options: one-to-many, many-to-one, one-to-one and many-to-many.
In the proposed model, only the relationships with cardinality to-many, one-to-one and many-to-one were used. A many-to-many relationship means both columns can contain duplicate values, one-to-one means both columns contain unique values and many-to-one means that the column in one table can have more than one instance of a value and the other related table has only one value.
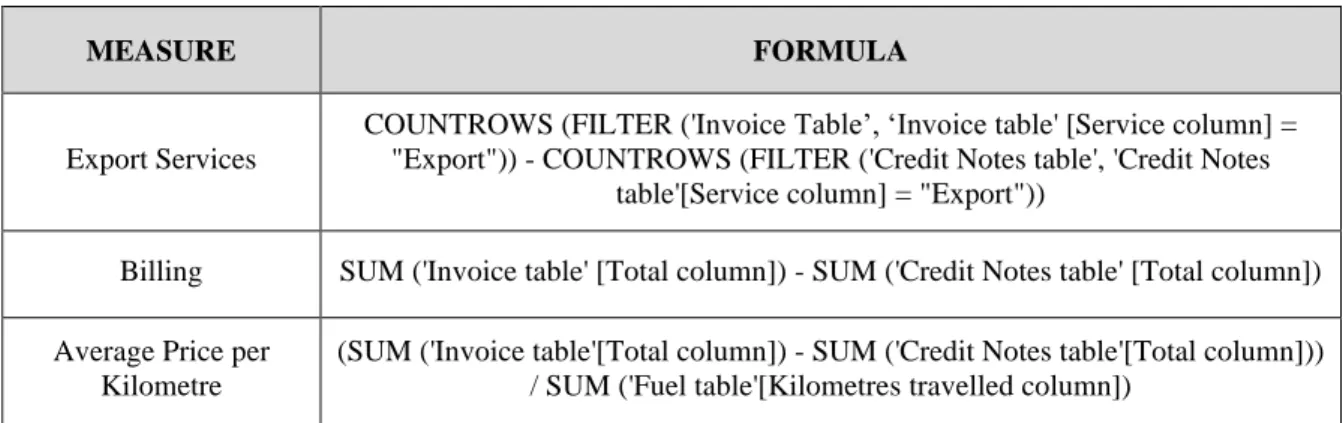
Table 2 – Example of some measures created using DAX
MEASURE FORMULA
Export Services
COUNTROWS (FILTER ('Invoice Table’, ‘Invoice table' [Service column] = "Export")) - COUNTROWS (FILTER ('Credit Notes table', 'Credit Notes
table'[Service column] = "Export"))
Billing SUM ('Invoice table' [Total column]) - SUM ('Credit Notes table' [Total column]) Average Price per
Kilometre
(SUM ('Invoice table'[Total column]) - SUM ('Credit Notes table'[Total column])) / SUM ('Fuel table'[Kilometres travelled column])
Most transportation companies use metrics that can be adapted to the reality of each organization. As an example, the function related to export services, table 2, was adapted to the case study company and therefore, it subtracts the count of rows related to the tables of credit notes and Invoices. At the case company, credit notes correspond to cancellations of reserved but not
20.ª Conferência da Associação Portuguesa de Sistemas de Informação (CAPSI’2020) 11 performed services, resulting in a decrease in the amount of services provided. So, every performed service, before invoicing, has a pre-agreed price, and credit notes are used only to cancel a service not performed.
After creating the analytical model, we proceed to the construction of measures using the DAX language. Measures calculate a result from an expression formula, for example, sums, averages, minimum, maximum and counts. Measures’ results are subject to changes as the reports are interrelated, and thus, allowing a fast and dynamic data exploration (Microsoft, 2020). Due to a large number of calculated measures in this proposal and, in order to fasten its organization, a table of measures was created. This consists of a blank table creation and in the transfer of the created measures to that table, thus getting all the measures together.
In addition to the measures, some calculated columns were created using DAX formulas to allow adding new data to the model tables’, in order to define the values of a column, from joining text values from two different columns to calculate a numeric value from other values. In the present proposal, a calculated column was added to extract vehicle’s age and to calculate the travelled kilometres for each vehicle. As an example, to calculate the vehicle’s age functions INT() and YEARFRAC() are used. The YEARFRAC() calculates the fraction of the year represented by the number of whole days between two dates and the INT() rounds a number down to the nearest integer.
5.
F
RAMEWORKA
NALYSIS ANDR
ESULTSThe developed proposal involves a novel dashboard solution, having various pages responsible for the process overview and different reports divided by themes. Also, different segmentation elements for dates are available, allowing analyses and comparisons between periods. These are presented and discussed below in the “Operational Planning Dashboard” subsection. The analysis of results and other tests’ evidences are then presented in the second subsection (5.2).
5.1. Operational Planning Dashboard
Before starting to process the data, a visual component of the project has been designed, including the overview and the related reports. Figure 3 illustrates the initially planned visual overview. Naturally, the initial idea was changed in order to become a more functional and friendly report in terms of use and understanding. The first change befell in terms of colours, changing to dark blue to obtain better accordance with the logistic provider’s image.
Globally, the project has five pages, the overview is the first and the others are divided by themes like customers and services, fleet, vehicles and fuel consumption. Each page features a segmentation element for dates that allows the user to select the desired period, with the maximum limit date being the current day, and thus proceed to analyses and comparisons between different periods. It also contemplates an element to clear all selections with just one click. This element is designated as an
20.ª Conferência da Associação Portuguesa de Sistemas de Informação (CAPSI’2020) 12 option of cleaning filters, this means that any interactivity and selection can be cleaned and return to the initial state, Figure 4.
Figure 3 – Overview initially designed
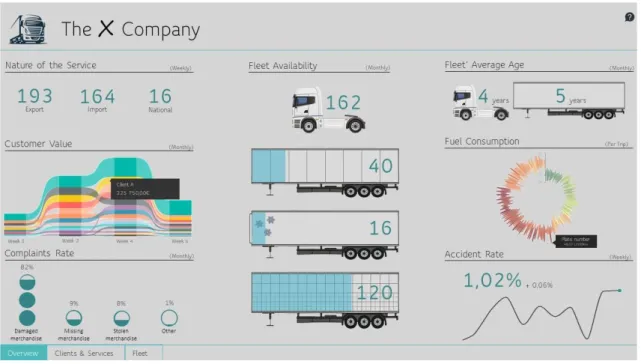
On the overview, there are both operational and financial indicators, because when making a decision it is necessary to take into account some financial aspects to help traffic managers decide, for example, whether or not to accept the service by analysing the monetary profitability, Figure 4.
20.ª Conferência da Associação Portuguesa de Sistemas de Informação (CAPSI’2020) 13 As previously said, on the left side of the overview, the operational indicators are exhibited, as they are the most important for the project. They are framed according to the service providers’ needs through its importance. The same criteria is applied to financial indicators shown on right. At the top of each section, are indicators that regularly assist users’ decision making. Finally, while no less important, the remaining indicators are displayed at the bottom of the page.
To represent indicators’ specific numbers, big numbers are suggested, such as the number of claims and accidents, the volume of billing, among others. Using “Card with States by OKVIZ” visual, we represent the fluctuation of claims and accident ratio. The use of the “Chord" visual is also suggested, which helps to understand the client’s weight in terms of service nature (export, import and national). Another added feature to this overview is called “Play Axis” and it is a dynamic slicer that animates all Power BI visuals with no users’ interaction. Figure 4 presents a visual illustration, showing that all the crucial information for decision making can be gathered in a unique page.
Instead, the other reports display more detailed information than the overview panel, and with other perspectives. For example, the accident rate is complemented in the report with a geographic map indicating the number of road accidents by country, as well as, the number of accidents by seasons. The overview and reports were shared with several users of the studied logistic provider, to help them make quick and more informed decisions, supported on solid facts.
5.2. Analysis of Results and Operational Evidence
As previously mentioned, the developed proposal was motivated by a transportation company, called, for simplicity reasons “The X Company”.
One of the most challenging problems was related to the data files. These were dissimilar files, having, for example, different number of columns and names, for the same data context. To solve this problem, the company builds new files for each calendar, and all files have been standardized by featuring the structure. Additionally, data import and process was conducted by ingestion of data through files with configurations based on folders, to ensure management of records, adapted to the organization’s model.
With the data standardization, all the relationships between tables were corrected and, therefore, it was possible to carry out the integrated analysis of data hitherto disconnected. Also, the combination of data for different years allowed a broad analysis of trends. The use of the “Card with States by OKVIZ” visual allowed to combine Big Numbers and trend lines in a single visual, ensuring a pleasant analysis experience that helps the user to understand the achieved performance.
As previously said, the report contains more four pages in addition to the Overview’s page, Billing and Services, Fleet, New Vehicles and Consumption per Vehicle. A lot of focus was placed on vehicles, since these are the company’s core. The Billing and Service page is divided, and in the
20.ª Conferência da Associação Portuguesa de Sistemas de Informação (CAPSI’2020) 14 billing, it is possible to consult the turnover by country, month or on the selected dates and the turnover by customers that the company considers important. In terms of services, it is possible to consult the number of services performed globally or monthly.
On the Fleet page, current fuel consumption by the fleet or by vehicle, the oldest vehicles and those with the most kilometres travelled are displayed. This specific information will assist the company's management in making decisions regarding vehicle replacement. In the central part of the page, the average age of the company's tractors and semi-trailers is displayed, as well as the number of vehicles of diverse types. To the right of the page, the accident rate is represented geographically, as well as by season. Due to the travels to Nordic countries, for safety reasons, vehicles have to change tires, therefore it is important to combine these data with the season information.
On the third page, questions related to new vehicles are analysed. This page shows the recently purchased tractors that are being leased, in addition to the current kilometres of each vehicle and how many kilometres they must travel to self-liquidate. The last page of the report displays questions related to consumption per vehicle, and it is possible to check the average fuel consumption for each trip taken, the global average of that vehicle, as well as the current kilometres. In addition, it is also possible to make the comparison between tractors in the fleet.
After creating the overview, operational tests were performed with data previously collected, which demonstrated the existence of errors in some selected visuals, making necessary some adjustments. Then, all the necessary checks were carried out, the project was implemented in the organization, being securely shared through the Power BI Portal and the Power BI Mobile App, and tests are currently underway.
In general, its implementation allowed a greater perception of the entire organizational environment, since it allows comparing operational with financial data, all gathered on a page. For all X Company users’, it was possible to understand whether it is profitable to carry out a specific ordered service or the moments in the year having more road accidents. With the reports, managers are able to understand which vehicles should be prioritized for sale, through the analysis of the vehicles’ age, travelled kilometres, and fuel consumption.
6.
C
ONCLUSIONSThe developed proposal provides the transportation company with centralized data analysis that was not possible until now. Further opportunities emerged from the novel relationships showed.
As observed in the studied transportation company, usually SME companies have a committed level of digital data storage because this process becomes expensive and time-consuming. But a high amount of embedded data is typically handled in SME companies.
20.ª Conferência da Associação Portuguesa de Sistemas de Informação (CAPSI’2020) 15 Besides that, most of the scientific literature suggests indicators that are not easy to apply to the SME reality, while extremely relevant. This is mainly difficult for companies with no prioritized digital data storage, resulting in a quite limited amount of available data.
Therefore, this type of project assisted by Power BI can help transportation companies, more specifically, companies with limited resources, both human and financial, achieving productivity and profitability. Because Power BI is an intuitive tool, with a reduced learning curve, every company can adjust and adapt this project proposal to its own reality.
In future, some control tools can be added to help the monitoring of indicators. The indicator goals will be defined using values as close as possible to the company’s reality. Also, new indicators interesting for the business can be tested and implemented in future dashboard visuals.
R
EFERENCESAlexander, M., & Walkenbach, J. (2010). Excel® Dashboards & Reports. Wiley Publishing, Inc. https://doi.org/10.1002/9781118257500
Arefin, M. S., Hoque, M. R., & Bao, Y. (2015). The impact of business intelligence on organization’s effectiveness: an empirical study. Journal of Systems and Information Technology, 17(3), 263–285. https://doi.org/10.1108/JSIT-09-2014-0067
Bernardino, J. (2013). Emerging Business Intelligence Technologies for SMEs. in Handbook of Research on Enterprise 2.0, M. M. Cruz-Cunha, F. Moreira, and J.Varajão, Eds. IGI Global, pp. 1–28.
Domingues, M. L. (2015). Quadro de Referência para a Monitorização do Desempenho de Operações Logísticas: Caso de Estudo Urbanos Express [Instituto Superior Técnico]. https://fenix.tecnico.ulisboa.pt/downloadFile/563345090414510/Dissertacao de Mestrado_Maria Leonor Domingues_com anexos.pdf
Dresner, H. (2013). Dresner Study Reveals High Expectations for Growth of Mobile Business Intelligence. http://sandhill.com/article/dresner-study-reveals-high-expectations-for-growth-of-mobile-business-intelligence/
Ferrari, A. (2020). 7 reasons DAX is not easy. https://www.sqlbi.com/blog/alberto/2020/06/20/7-reasons-dax-is-not-easy/
Gartner. (2019). Magic Quadrant for Analytics and Business Intelligence Platforms. https://www.gartner.com/doc/reprints?id=1-3TXXSLV&ct=170221&st=sb
IBM Knowledge Center. (n.d.-a). Dimensional schemas., from https://www.ibm.com/support/knowledgecenter/SS9UM9_9.1.2/com.ibm.datatools.dimensional.ui.doc/t opics/c_dm_dimschemas.html, Retrieved May 27, 2020.
IBM Knowledge Center. (n.d.-b). Use the snowflake schema for hierarchical dimension tables. from https://www.ibm.com/support/knowledgecenter/SSGU8G_12.1.0/com.ibm.whse.doc/ids_ddi_362.html, Retrieved May 27, 2020.
Kaushik, A. (2010). Web Analytics 2.0: The Art of Online Accountability and Science of Customer Centricity. Wiley Publishing, Inc.
Khalid A., Hassan N., Bakar N. & Baharuden A. (2020), Business Intelligence Dashboard for Driver Performance in Fleet Management, IC4E 2020: 11th International Conference on Education, E-Business, E-Management, and E-Learning, ACM Proceedings DOI: 10.1145/3377571.3377642.
Kucińska-Landwójtowicz, A., & Lorenc, M. (2017). The Set of Performance Indicators in Transport and Forwarding Services – Case Study. CBU International Conference Proceedings, 5(November 2018), 247. https://doi.org/10.12955/cbup.v5.934
Microsoft. (2019a). Apply DAX basics in Power BI Desktop. https://docs.microsoft.com/pt-pt/power-bi/transform-model/desktop-quickstart-learn-dax-basics#what-is-dax
Microsoft. (2019b). Model relationships in Power BI Desktop. https://docs.microsoft.com/pt-pt/power-bi/transform-model/desktop-relationships-understand
Microsoft. (2020). Create measures for data analysis in Power BI Desktop. https://docs.microsoft.com/pt-pt/power-bi/transform-model/desktop-measures
20.ª Conferência da Associação Portuguesa de Sistemas de Informação (CAPSI’2020) 16
Loyalty. International Journal of Marketing Studies, 9(6), 55. https://doi.org/10.5539/ijms.v9n6p55 Posset, M., Gronalt, M., & Häuslmayer, H. (2010). COCKPIIT – Clear, Operable and Comparable Key
Performance Indicators for Intermodal Transportation. http://www2.ffg.at/verkehr/file.php?id=340 Radović, D., Stević, Ž., Pamučar, D., Zavadskas, E., Badi, I., Antuchevičiene, J., & Turskis, Z. (2018).
Measuring Performance in Transportation Companies in Developing Countries: A Novel Rough ARAS Model. Symmetry, 10(10), 434. https://doi.org/10.3390/sym10100434
Richards, G., Yeoh, W., Chong, A. Y. L., & Popovič, A. (2017). Business Intelligence Effectiveness and Corporate Performance Management: An Empirical Analysis. Journal of Computer Information Systems, 59(2), 188–196. https://doi.org/10.1080/08874417.2017.1334244
Siemen C., Clever N., Barann B. (2018). Requirements Elicitation for an Inter-organizational Business Intelligence System for Small and Medium Retail Enterprises, IEEE 20th Conference on Business Informatics, pp. 129-138.
Topolšek, D., Čižiūnienė, K., & Ojsteršek, T. C. (2018). Defining Transport Logistics: A Literature Review and Practitioner Opinion Based Approach. Transport, 33(5), 1196–1203. https://doi.org/10.3846/transport.2018.6965
Wauyo, F., Omol, E., & Okumu, J. (2017). Effectiveness of Business Intelligence: Technology absorptive capacity and innovation competency of University staff, Case of Uganda Christian University Mbale Campus. European Journal of Technology, 1(2 No.4), 55–73.