DEVELOPMENT OF FLOOD RISK MAP AT KUANTAN USING GEOGRAPHICAL INFORMATION SYSTEM
ROZALLIENNY BINTI ZAINAL
A project report submitted in partial fulfilment ofthe requirements for the award ofthe degree of
Master of Engineering (Civil)
Faculty of Civil Engineering Universiti Teknologi Malaysia
iii
To
My Family
iv
ACKNOWLEDGEMENT
Foremost, I would like to express my great appreciation to my project report supervisor Dr. Mariyana Aida binti Ab. Kadir for encouragement, guidance and understanding. I am also thankful to my co-supervisors Dr. Noraliani binti Alias for guidance and support. Without their support, this project report would not have been done in given time.
I wish to acknowledge the help provided by Department of Irrigation and Drainage Malaysia, Department of Survey and Mapping Malaysia and United States Geological Survey web site which has given data of this study. Also, I like to thank the participants in my survey, who have willingly shared their precious time during the process of gathering information.
I would also like to thank Politeknik Sultan Haji Ahmad Shah for giving me opportunities to continue my study in Master Degree of Civil Engineering. My sincere thanks also goes to my colleague, for offering me advice and help throughout my project report.
Finally, I must express my very profound gratitude to my parents and to my siblings for providing me with unfailing support and continuous encouragement throughout my years of study and through process of researching and writing this project report. This accomplishment would not have been possible without them. Thank you.
v
ABSTRACT
The purpose of this study is to develop the flood risk map in Kuantan. The heavy prolonged rainfall in Kuantan has showed an increasing flood disaster over a year. Geographical Information system (GIS) is integrated with AHP is used to generate the potential flood risk area. Flood map was develop by applying data Digital Elevation Model (DEM) and Landsat 8 download from United States Geological Survey (USGS) to generate the slope map and land use map. Soil type map was obtained from Department of Survey and Mapping (JUPEM) and rainfall intensity data from Department of Irrigation and Drainage (DID). Rainfall distribution map in study area was generated in ArcGIS software using Inverse Distance Weighted (IDW) interpolation method. The spatial analysis and AHP analysis was used to score and compute weights of each criteria. Score for each criteria based on judgement to the parameter risk level against flooding. Using AHP, the percentage derived from the parameters were land use type is 41.55%, slope 28.95%, rainfall 16.93% and soil type is 12.58%. The value of consistency ratio is 6.9% was acceptable and indicate the judgement for each parameter is consistent. Flood risk areas were generating using flood risk index calculation. The result shows that, land use change, slope degree, rainfall intensity and soil type have significant influences on the flood mapping. The flood risk map using AHP was matched to an actual flood mapping developed by DID in determining potential location of flooding.
vi
ABSTRAK
Kajian ini bertujuan untuk membangunkan peta risiko banjir di Kuantan. Curahan hujan lebat yang berterusan di Kuantan menunjukkan peningkatan bencana banjir saban tahun. Sistem Informasi Geografi diintegrasikan dengan Analisis Hirarki Proses (AHP) untuk menghasilkan kawasan berpotensi banjir. Peta banjir dibangunkan dengan mengaplikasikan data model ketinggian digital (DEM) dan Landsat 8 yang dimuat turun dari United States Geological Survey (USGS) untuk menghasilkan peta kecerunan dan peta guna tanah. Peta jenis tanah diperolehi dari Jabatan Ukur dan Pemetaan Malaysia (JUPEM) dan curahan hujan diperolehi dari Jabatan Pengairan dan Saliran (JPS). Peta taburan hujan di kawasan kajian dihasilkan mengunakan kaedah interpolasi Inverse Distance Weighted (IDW) dalam perisian ArcGIS. Analisa keruangan dan AHP telah digunakan untuk menentukan skor dan pengiraan pemberatan setiap kriteria. Skor setiap kriteria adalah berdasarkan pertimbangan terhadap tahap risiko parameter terhadap banjir. Dengan menggunakan AHP, peratusan setiap parameter diperolehi iaitu jenis guna tanah ialah 41.55%, keceruanan ialah 28.95%, hujan ialah 16.93% dan jenis tanah ialah 12.58%. Nilai nisbah konsisten ialah 6.9% adalah memuaskan dan menunjukkan bahawa pertimbangan setiap parameter adalah konsisten. Kawasan berisiko banjir dihasilkan dengan menggunakan kaedah pertindihan pemberatan di dalam ArcGIS. Hajil kajian menunjukkan bahawa pembangunan guna tanah, ketinggian cerun, keamatan hujan dan jenis tanah mempunyai pengaruh terhadap pemetaan banjir. Peta risiko banjir dengan menggunakan kaedah AHP mempunyai persamaan dengan peta banjir sebenar yang dibangunkan oleh JPS dalam menentukan lokasi yang berpotensi untuk banjir.
vii
TABLE OF CONTENTS
CHAPTER TITLE PAGE
DECLARATION ii
DEDICATION iii
ACKNOWLEDGEMENT iv
ABSTRACT v
ABSTRAK vi
TABLE OF CONTENT vii
LIST OF TABLES xi
LIST OF FIGURES xii
LIST OF ABREVIATIONS xv
LIST OF SYMBOLS xvi
LIST OF APPENDICES xvii
1 INTRODUCTION 1
1.1 Introduction 1
1.2 Background of Study 3
1.3 Problem of Statement 4
1.4 Aim and Objectives 5
1.5 Scope of Study 5
1.5.1 Study Area 6
viii
1.5.3 Data 7
1.6 Significance of Study 7
2 LITERATURE REVIEW 8
2.1 Introduction 8
2.2 Factors Affecting Flood 10
2.3 Flood Risk Mitigation 11
2.4 Flood Mapping 13
2.5 Geographic Information System (GIS) 21
2.6 Analytical Hierarchy Process (AHP) 22
2.6.1 Flood Risk Score 23
2.6.2 Pairwise Comparison Scale 24
2.6.3 Pairwise Comparison Matrix 24
2.6.4 Normalize Matrix 25 2.6.5 Consistency Index 26 3 METHODOLOGY 27 3.1 Introduction 27 3.2 Study Area 28 3.3 Data Collection 29 3.4 Spatial Modelling 30 3.4.1 Base Map 30
3.4.2 Land Use Processing 32
3.4.3 Digital Elevation Model (DEM) 34
3.4.3.1 Slope Processing Data 36 3.4.4 Rainfall Processing Data 38
3.4.5 Soil Type Map 41
ix
3.5.1 Pairwise Comparison Matrix 43
3.5.2 Normalize Matrix 44
3.5.3 Consistency Index 45
3.6 Weighted Overlay 46
3.7 Flood Risk Index 46
4 RESULT AND DISCUSSION 47
4.1 Introduction 47
4.2 Result 47
4.2.1 Land Use Map 48
4.2.2 Slope and Elevation Map 50
4.2.3 Rainfall Map 52
4.2.3.1 Rainfall Map for The Year 2011 52 4.2.3.2 Rainfall Map for The Year 2012 53 4.2.3.3 Rainfall Map for The Year 2013 54 4.2.3.4 Rainfall Map for The Year 2014 55 4.2.3.5 Rainfall Map for The Year 2015 56
4.2.4 Soil Map 57
4.3 Analytical Hierarchy Process (AHP) 59
4.4 Flood Risk Map 60
4.4.1 Flood Risk Map For The Year 2011 60
4.4.2 Flood Risk Map For The Year 2012 61
4.4.3 Flood Risk Map For The Year 2013 62
4.4.4 Flood Risk Map For The Year 2014 63
4.4.5 Flood Risk Map For The.Year 2015 64
4.4.6 Discussion 65
5 CONCLUSION 69
x 5.2 Conclusion 69 5.2.1 Objective 1 70 5.2.2 Objective 2 71 5.2.3 Objective 3 72 5.3 Recommendation 73 REFERENCES 74 APPENDICES A - I 78 - 86
xi
LIST OF TABLES
TABLE NO. TITLE PAGE
1.1 Kuantan Population from 1980 - 2015 2
2.1 Pairwise Comparison Scale 24
2.2 Ranking of Flood Risk Factors in Pairwise Comparison Matrix 25
2.3 Ranking of Flood Risk Factors in Normalize Matrix 25
2.4 Random Index 26
3.1 Sources of Data 30
3.2 Land Use Classification in Flood Risk Map 33
3.3 Slope Classification in Flood Risk Map 37
3.4 Annual Rainfall Intensity for Eight Rain Gauges Station 39
3.5 Annual Rainfall Intensity Classification 41
3.6 Slope Classification Score 43
3.7 Pairwise Comparison Matrix 44
3.8 Normalize Matrix 44
4.1 Area of Land Use 49
4.2 Total Area of Slope 52
4.3 Area of Soil 58
xii
LIST OF FIGURES
FIGURE NO. TITLE PAGE
2.1 Flood Prone Areas in Peninsular Malaysia 9
2.2 Flood Prone Areas in Sabah and Sarawak 10
2.3 Location of the 14 Cross sections along Sarawak River Sub-basin Model using InfoWorks RS in Combinations with
GIS 14
2.4 Flood Risk Map for Kayu Ara River Basin 15
2.5 Weighted Normalized Risk Factor for Floods Risk Assessment
at River 17
2.6 Flood Vulnerable Area in Okazaki City, Japan 18
2.7 Flood Hazard Map in Najran City, Saudi Arabia 19
2.8 Flash Flood Ranking Based on Drainage Basin in Nuweiba, Egypt 20
2.9 Flood Risk Map at Terengganu 21
3.1 Methodology for Development of Flood Risk Mapping 28
3.2 Maps of Peninsular Malaysia 29
3.3 Basemap of Kuantan 31
3.4 Maps of Kuantan River Basin 32
3.5 Extraction Process from Landsat Images to Layers of Polygon
xiii
3.6 Digital Elevation Model of Kuala Tahan, Maran, Sungai Ular and 34
3.7 Digital Elevation Model within Kuantan Boundary 35
3.8 Kuantan Digital Elevation Model with Colour Scheme 36
3.9 Slope Map with Weighted Value to Flooding 37
3.10 Location of Rain Gauges Station 38
3.11 Annual Rainfall Intensity in Microsoft Excel Format 39
3.12 Rain Gauges Station Coordinates in ArcGIS 40
3.13 Result of IDW Interpolation 41
3.14 Kuantan Soil Map Extraction Process 42
4.1 Land Use Map Based On Ranking Method 49
4.2 Elevation Level of Kuantan 50
4.3 Slope Map Based on Ranking Method 51
4.4 Rainfall Map of Kuantan for The Year 2011 53
4.5 Rainfall Map of Kuantan for The Year 2012 54
4.6 Rainfall Map of Kuantan for The Year 2013 55
4.7 Rainfall Map of Kuantan for The Year 2014 56
4.8 Rainfall Map of Kuantan for The Year 2015 57
4.9 Soil Type Map Based On Ranking Method 58
4.10 Flood Risk Map For Year 2011 61
4.11 Flood Risk Map For The Year 2012 62
4.12 Flood Risk Map For The Year 2013 63
4.13 Flood Risk Map For The Year 2014 64
4.14 Flood Risk Map For The Year 2015 65
xiv
4.16 Comparisons of Flood Risk Map of 2013 67
4.17 Comparisons of Flood Risk Map of 2014 67
xv
LIST OF ABBREVIATIONS
DID Department of Irrigation and Drainage GIS Geographic Information System DEM Digital Elevation Model
MCDA Multi-Criteria Decision Analysis AHP Analytical Hierarchy Process SRTM Shuttle Radar Topography Mission LOB Left Over Bank
ROB Right Over Bank
HEC Hydrologic Engineer Center HMS Hydrologic Management System RAS River Analysis System
USGS United States Geological Survey IWMS Integrated Water Management System USDA United States Department of Agriculture JUPEM Department of Survey and Mapping RSO Rectified Skew Orthomorphic IDW Inverse Distance Weighed
NASA National Aeronautical and Space Administration ARI Annual Recurrence Interval
xvi
LIST OF SYMBOLS
CR Consistency Ratio CI Consistency Index
RI Random Consistency Index Principle Eigenvector n Total number of criteria K Flood risk value
W Weighing value of criteria X Scoring value
xvii
LIST OF APPENDICES
APPENDIX TITLE PAGE
A Coordinate of Rain Gauges Stations and Annual
Rainfall Intensity 72
B Flood Risk Map for The Year 2011 73
C Flood Risk Map for The Year 2012 74
D Flood Risk Map for The Year 2013 75
E Flood Risk Map for The Year 2014 76
F Flood Risk Map for The Year 2015 77
G Flood Map for the year 2012 at Kuantan District 78 H Flood Map for the year 2013 at Kuantan District 79 I Flood Map for the year 2014 at Kuantan District 80
CHAPTER 1
INTRODUCTION
1.1 Introduction
Flood is natural phenomenon expected to become more frequent in recent years especially in urbanization area. It is a natural event or occurrence when water overflows or inundates land that is normally dry. Climate change is also expected to increase the intensity of rainfall events. The frequency of flood is change due to human activities. The risk of flooding in urban and coastal areas is likely increasing urbanization in a flood plain. Floods often have devastating impacts to economic; environment includes loss of human life.
According to the Department of Drainage and Irrigation Malaysia (DID), approximately 29, 800 km2 in Malaysia covered by flood every year. Malaysia exposed to the monsoons season and heavy rainfall throughout the year. Kuantan experienced a disastrous flood in 1971, 2011 and 2013 due to prolonged heavy rainfall and land use development. The recent research shows the factors are land use degradation, heavy rainfall and poor drainage system (Zaidi et al., 2014). Kuantan received heavy rainfall during northeast monsoon and lead to severe flood resulting inundation of low-lying flood plains. Kuantan River passed 1630 km2 area and start from Sungai Lembing passing through city and discharge into the South China Sea.
2
Although there is still a lack of comprehensive study, the contribution of these factors at the risk to flooding. Hashim (2012) found that land use patterns change significantly starting in 1980 until 2002, river straightening and embankment construction increase the peak discharge at Panching and Isap River, Kuantan.
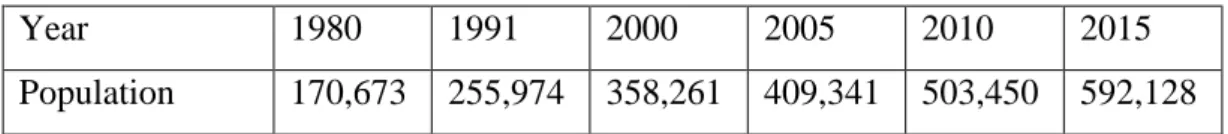
As an area expands to cope with population growth, land use changes to urbanization area are unavoidable. The rate of population growth has been higher in areas at risk of flooding. Climate change, increasing population growth and economic rising are predicted to exposed an area to flood hazard (Guneralp et al., 2015). The Department of Statistic Malaysia has indicated that Kuantan population expected to increase by 71.2% from 1980 to 2015 (Table 1.1 : Kuantan Population from 1980 - 2015). The high-density populated area increases the likelihood to flooding by increasing the urban expansion to flood plain area and capacity a drainage system.
Table 1.1 : Kuantan Population from 1980 - 2015
Year 1980 1991 2000 2005 2010 2015 Population 170,673 255,974 358,261 409,341 503,450 592,128
The heavy rainfall occurs in November to December 2013 causing 37,100 peoples in certain areas of Pahang, Terengganu, and Johor evacuated due to flooding (Weng Sang et al., 2015). Topography characteristics and hydrological properties of the area are environmental factors for the flood catastrophe. Flooding is a very common environmental hazard, because of flood plains and low-lying coasts and the development in flood plain (Smith and Petley, 2008). Apart from environmental factors, rapid and uncontrolled development may increase the impact of flooding disasters that cause losses in properties and human life.
Various method and tools are continuously study by researches as well as governmental and private sector to determine the risk factors and to reduce or eliminate the risk (Norén et al., 2016). Geographic Information System (GIS)
3
analysis and visual features often used in recent years for prediction flood prone areas and flood maps (Ozkan and Tarhan, 2016). The GIS has been proven as an effective for analyzing the hydrological aspects especially in mitigating the flood risk area. The GIS has a capability to stored attribute data using maps and has a function to organizing tools for a large database.
Various methods have been developed by researcher, municipalities and private sector for generating flood maps to predict hydraulic and hydrology modelling also to for flood risk mitigation planning. DID Sarawak has developed a flood map at Sarawak using InfoWorks River Simulation and LiDAR systems but the cost is higher due to time and labor cost to surveying a cross-section of the river (Bustami et al, 2009). Digital Elevation Model (DEM) is the most feasible method that retrieved from EarthExplorer website which is open access provided by United States Geological Survey (USGS) (Kuok et al, 2013). Mapping becomes tools by which researchers can check databases for instances to display the flooding risk factors such as topographic, slopes, contours, or land use features of an area. GIS is integrated with Multi-Criteria Decisions Analysis (MCDA) to estimate the of flood risk area. The spatial multi-criteria analysis use to score and show probability of flood risk area, while Analytical Hierarchy Process (AHP) use to calculate the priority weights of each factor (Fadlalla et al, 2015; Haryani et al, 2012; Nurdin and Suprayogi, 2015)
1.2 Background of Study
Flood occurrences seem to be getting more frequent in recent years especially in urbanization area. According to the DID Malaysia, approximately 29,800 km2 areas in Malaysia covered by flood every year. Malaysia exposed to the monsoons season and heavy rainfall throughout a year.
4
Flood in Pahang expected to be worst since 1971. Recently, the years 2001, 2011 and 2013 has been considered to perceive worst flood disaster after 1971 (Zaidi et al., 2014). Flash floods have occurred more frequently in the Kuantan since 2009, with these types of floods often having a disastrous impact. The area alongside the river is low and more likely and frequent floods almost every year. The flood plain is the natural place for a river to dissipate its energy, and where the overflow water was temporarily stored. The development in this area increases the flooding risk exceeding to the flood plain. Flood occurrence in Kuantan also related to the natural phenomenon and human activities. The annual average rainfall in Pahang is 2650 mm per year.
The floods at Kuantan in December 2013 have caused heavy damages to economics, environment, and human lives. 22,291 victims in December 2013 were evacuated. Even though flood mitigation measures planned by DID, major floods event may seriously damage or destroy power plants, industrial plants, roads and bridges and may cause loss of lives, adverse ecological and environment impact.
1.3 Problem of Statement
They are several flood mitigation project implemented that have been adopted by DID, but the flood is a natural disaster is unavoidable. The government had to establish appropriate for implementing flood control works and flood relief operation such as blasting the estuary, to relief the flood to the sea. In addition, implementation of structural measures such as flood control dams, river improvements, is pumping installations to alleviate flooding in existing flood-prone areas. However, as more and more people live in flood plains, and the increasing properties and infrastructures, the potential for damage and loss are high.
5
DID has developed flood mapping to shows the area that affected by a flood. However, the flood mapping is only based on previous flood occurrence and 100 years ARI event. There is no solid research based on factors that influence to flooding. In order to determine the flood prone area, flood risk mapping with weighted parameters that contribute to flooding is developed. The integration between parameters and GIS becomes a new dimension on detecting flood risk area. Flood risk mapping at Kuantan is important to predict the possibility of an area affected and risk mitigation measures.
1.4 Aim and Objectives
This study aims to predict the potential flood risk area using spatial analysis with different rainfall intensity. In conducting this study, there are objectives to achieve;
i. To generate a land use map, slope map, rainfall map and soil map. ii. To determine criteria weight values using Analytical Hierarchy Process. iii. To evaluate flood risk map based on area.
1.5 Scope of Study
The scope and limitation of this study were explained in the following sub-sections.
6
1.5.1 Study Area
The study area is located in Kuantan district and has an area 303005.8 Ha located approximately Latitude 3o 53’ N and Longitude 103o 21’ E. Kuantan is the capital city in Pahang with a population over than 600,000 people. It has tropical climate and elevation ranging from 0 to 1495 m above sea level. Thus, the land use within this area is dominated by forest, particularly in a mountainous area. Precipitation occurs throughout the year with the heaviest in the monsoon season from October to February and temperature of 26.6 oC, and the annual rainfall is about 2650 mm per year.
The area consists of the wetland, clay soil, and mountainous area. The eastern part of the district is a coastal area with wetland area, which is low-lying land, and the western part is a mountainous area. Due to the landform, about 26% is a wetland, 34% is the area below 75 meters above sea level (flat area), 15% is between 76 to 150 meters, and 26% is above 150 meters or high area. The study area is passed by main rivers, namely Sungai Kuantan which is flows from West to East. The total area of the river basin is 2250 km2. The river begins at the confluence with tributary from Sungai Lembing and Cereh. Kuantan river then flows southeast through Bukit Kuin, Pasir Kemudi, Kampung Padang, Sungai Isap, Permatang Badak and Tanjung Lumpur.
1.5.2 Analysis
This study involved the use of AHP and ArcGIS to generate flood risk map in the study area as this model rather simple and required fewer criteria compared to another model. In addition, the flood risk map represents the weighing values of criteria that have significant factors to flooding.
7
1.5.3 Data
In this study, the model using recorded annual rainfall data from 2011 to 2015. Elevation slope data generated from DEM and land use data generated from Landsat 8, both data was downloading from Shuttle Radar Topography Mission (SRTM) satellites. By overlaying the geographical data and hydrographical data, the total area of flood area is determined.
1.6 Significance of Study
The significant of the study is to develop the flood risk mapping using GIS in Kuantan, which is the previous study not using flood risk criteria that contribute to flooding. Flood map is a useful tool to provide information for risk mitigation and as tools to reduce flood damage (Tam et al., 2013). This study can provide preventive measures to avoid the anticipated floods problems to carry out an analysis of flood events before execution of any structural measures. This map will provide useful information on flood risk mitigation in land use planning.
74
REFERENCES
Abdul Rahman, H. (2014). An Overview of Environmental Disaster in Malaysia and Preparedness Strategies. Iranian Journal of Public Health, 43(3), 17–24.
Abdullah, K. (2002). Integrated River Basin Management. Towards Sustainable Development, Universiti Sains Malaysia Publisher. Penang, pp. 3-14
Abuzied, S., Yuan, M., Ibrahim, S., Kaiser, M., and Saleem, T. (2016). Geospatial Risk Assessment of Flash Floods in Nuweiba Area ,Egypt. Journal of Arid Environments, 133, 54–72.
Alaghmand, S., Abdullah, R., and Abustan, I. (2014). River Modelling for Flood Risk Map Prediction : Case Study of Sungai Kayu Ara. International Conference on Chemical Processes and Environmental Engineering.December 30-31, Bangkok, Thailand: ICCPEE, 96-101
Aliagha, U. G., Jin, T. E., Choong, W. W., Nadzri Jaafar, M., and Ali, H. M. (2014). Factors affecting flood insurance purchase in residential properties in Johor, Malaysia. Natural Hazards and Earth System Sciences, 14(12), 3297–3310. Bustami, R., Bong, C., and Mah, D. (2009). Modelling of Flood Mitigation
Structures for Sarawak River Sub-basin Using InfoWorks River Simulation (RS). Journal of Civil, Environmental, Structural, Construction and Architectural Engineering, 3(6), 248–252.
Chia, C. W. (2004). Managing Flood Problems in Malaysia. Buletin Ingenieur, 38– 43.
El-magd, I. A., Hermas, E., and Bastawesy, M. El. (2010). GIS Modelling of The Spatial Variability of Flash Flood Hazard in Abu Dabbab Catchment , Red Sea Region , Egypt. The Egyptian Journal of Remote Sensing and Space Sciences, 13(1), 81–88.
Elkhrachy, I. (2015). Flash Flood Hazard Mapping Using Satellite Images and GIS Tools : A case study of Najran City , Kingdom of Saudi Arabia ( KSA ). The Egyptian Journal of Remote Sensing and Space Sciences, 18(2), 261–278.
75
Fadlalla, R., Elsheikh, A., Ouerghi, S., and Elhag, A. R. (2015). Flood Risk Map Based on GIS and Multi Criteria Techniques (Case Study Terengganu Malaysia). Journal of Geographic Information System, 7, 348–357.
Guneralp, B., Guneralp, I., and Liu, Y. (2015). Changing Global Patterns of Urban Exposure to Flood and Drought Hazards. Journal Global Environmental Change, 31, 217–225.
Haryani, N. S., Zubaidah, A., Dirgahayu, D., Yulianto, H. F., and Pasaribu, J. (2012). Flood Hazard Model Using Remote Sensing Data in Sampang District. Jurnal Penginderaan Jauh, 9(1), 52–66.
Kassim, N. S., and Islam, R. (2006). An Integration of Multicriteria Analysis With GIS in the Malaysian National Physical Plan. Journal of the Malaysian Institute of Planners, 4, 69–82.
Kundzewicz, Z. W., Kanae, S., Seneviratne, S. I., Handmer, J., Nicholls, N., Peduzzi, P., Sherstyukov, B. (2014). Flood Risk and Climate Change: Global and Regional Perspectives. Hydrological Sciences Journal, 59(1), 1–28.
Kuok, K. K., Liew, Z. Z., and Chiu, P. (2013). Flood Map Development by Coupling Satellite Maps and Three-dimensional Drafting Software: Case Study of the Sarawak River Basin. Water SA, 39(1), 175–182.
Lawal, D. U., Matori, A., Hashim, A. M., Yusof, K. W., and Chandio, I. A. (2012). Detecting Flood Susceptible Areas Using GIS-based Analytic Hierarchy Process. International Conference on Future Enviironment and Energy (Vol. 28, pp. 4–8).
Mohamad, S., Hashim, N. M., Aiyub, K., and Toriman, M. E. (2012). Flash flood and community’s response at Sg. Lembing, Pahang. Advances in Natural and Applied Sciences, 6(1), 19–25.
Mohamed Elmoustafa, A. (2012). Weighted normalized risk factor for floods risk assessment. Ain Shams Engineering Journal, 3(4), 327–332.
Mohsen, S., Norhan, A. R., and Zulkifli, Y. (2011). Simulation of Flood Extent Mapping by Infoworks RS Case Study for Tropical Catchment. Journal of Sofware Engineering, 5(4), 127–135.
Ngai, W. C. (1997). Increasing Flood Risk in Malaysia: Causes and Solutions. Disaster Prevention and Management: An International Journal, 6(2), 72–86. Norén, V., Hedelin, B., Nyberg, L., and Bishop, K. (2016). Flood Risk Assessment :
76
Disaster Risk Reduction, 18, 206–217.
Nurdin, and Suprayogi, I. (2015). Pemetaan Kawasan Rentan Banjir Dalam Kota Pekanbaru Menggunakan Perangkat Sistem Informasi Geografis. Annual Civil Engineering Seminar, 978–979.
Ouma, Y., and Tateishi, R. (2014). Urban Flood Vulnerability and Risk Mapping Using Integrated Multi-Parametric AHP and GIS: Methodological Overview and Case Study Assessment. Water, 6(6), 1515–1545.
Ozkan, S. P., and Tarhan, C. (2016). Detection of Flood Hazard in Urban Areas Using GIS: Izmir Case. Procedia Technology, 22, 373–381.
Pachri, H., Mitani, Y., Ikemi, H., Djamaluddin, I., and Morita, A. (2013). Development of Water Management Modelling by using GIS in Chirchik River Basin, Uzbekistan. Procedia Earth and Planetary Science, 6, 169–176.
Rimba, A. B., Setiawati, M. D., Sambah, A. B., and Miura, F. (2017). Physical Flood Vulnerability Mapping Applying Geospatial Techniques in Okazaki City , Aichi.
Saaty, T. L. (1990). How to Make a Decision: The Analytic Hierarchy Process. European Journal of Operational Research, 48(1), 9–26.
Schuster, S., Stolpe, H., Klingel, F., and Borgmann, A. (2008). Gis-Application for Integrated Water Resources Management on the Example of the Upper Dong Nai River Basin , Vietnam. Water Resources.
Sinnakaudan, S. K., Ab Ghani, A., Ahmad, M. S. S., and Zakaria, N. A. (2003). Flood Risk Mapping for Pari River Incorporating Sediment Transport. Environmental Modelling and Software, 18(2), 119–130.
Smith, K., and Petley, D. N. (2008). Environmental Hazards: Assessing Risk and Reducing Disaster. Routledge| Taylor and Francis Group.
Tam, T., Latif, A., Zulkarnain, M., and Rahman, A. (2013). Flood Risk Mapping using Geospatial Technologies and Hydraulic Model.
Teng, J., Jakeman, A. J., Vaze, J., Croke, B. F. W., Dutta, D., and Kim, S. (2017). Environmental Modelling and Software Flood inundation modelling : A Review of Methods, Recent Advances and Uncertainty Analysis. Environmental Modelling and Software, 90, 201–216.
Weng Sang, Y., Jeong Yik, D., MatAdam, M. K., Burham, N., and Yunus, F. (2015). A Case Study of Two Cold Surge Events, During the 2013/2014 Northeast Monsoon: The Impact of the Borneo Vortex, Southern Trough, and
Cross-77
equatorial Flow Upon Rainfall Distribution in Malaysia. Malaysian Meteorological Department, 1–25.
Zaharia, L., Remus, P., Minea, G., & Costache, R. (2015). Assessment and Mapping of Flood Potential in the Slanic Catchment in Romania. Journal of Earth System Science, 124(6), 1311–1324.
Zaidi, S. M., Akbari, A., & Ishak, W. M. F. (2014). Critical review of Floods History in Kuantan River Basin : Challenges and Potential Solutions. International Journal of Civil Engineering, 5.