Systems/Circuits
Posterior Parietal Cortex Guides Visual Decisions in Rats
Angela M. Licata,
1X
Matthew T. Kaufman,
1David Raposo,
1,2Michael B. Ryan,
3X
John P. Sheppard,
4,5and
X
Anne K. Churchland
11Cold Spring Harbor Laboratory, Cold Spring Harbor, New York 11724,2Champalimaud Neuroscience Programme, Lisboa, Portugal 1400-038,3University
of California, San Francisco, California 94143,4University of California, Los Angeles, California 90095, and5Northwestern University, Chicago, Illinois 60208
Neurons in putative decision-making structures can reflect both sensory and decision signals, making their causal role in decisions
unclear. Here, we tested whether rat posterior parietal cortex (PPC) is causal for processing visual sensory signals or instead for
accu-mulating evidence for decision alternatives. We disrupted PPC activity optogenetically during decision making and compared effects on
decisions guided by auditory versus visual evidence. Deficits were largely restricted to visual decisions. To further test for visual
domi-nance in PPC, we evaluated electrophysiological responses after individual sensory events and observed much larger response
modula-tion after visual stimuli than auditory stimuli. Finally, we measured trial-to-trial spike count variability during stimulus presentamodula-tion and
decision formation. Variability decreased sharply, suggesting that the network is stabilized by inputs, unlike what would be expected if
sensory signals were locally accumulated. Our findings suggest that PPC plays a causal role in processing visual signals that are
accumu-lated elsewhere.
Key words:
decision making
Introduction
A large body of work has documented neural responses during
perceptual decisions (
Roitman and Shadlen, 2002
;
Churchland et
al., 2008
;
Ding and Gold, 2012
;
Rishel et al., 2013
;
Ding, 2015
;
Hanks et al., 2015
). These studies reveal cortical and subcortical
structures that might constitute a brain-wide circuit for
trans-forming raw sensory inputs into plans for action. Although
tran-sient disruption of activity in these structures could help in
assessing their causal role in such a circuit, these types of
experi-ments have been performed rarely and inconclusively. The
im-portance of causal manipulations is underscored by experiments
that found no effect of neural disruption on some decisions, even
for areas in which neurons reflect decision signals (
Suzuki and
Gottlieb, 2013
;
Erlich et al., 2015
;
Chen et al., 2016
;
Katz et al.,
2016
).
The role of one candidate area, the posterior parietal cortex
(PPC) of rodents, remains particularly ambiguous because
exist-ing work paints conflictexist-ing pictures of its role in decision makexist-ing.
Electrophysiological observations demonstrate that PPC is
mod-ulated during both auditory (
Raposo et al., 2014
;
Hanks et al.,
2015
) and visual (
Harvey et al., 2012
;
Raposo et al., 2014
)
deci-sions, which unfold gradually over
⬃
1 s. These slow-time-course
signals could reflect evidence accumulation or action planning
either in PPC or in a remote area with feedback projections to
PPC. One possibility is that evidence accumulation occurs
re-motely and PPC plays a predominately sensory role. Certainly, in
order for sensory evidence to be accumulated, preliminary
compu-tations are required to extract the relevant signals from the overall
sensory response. For example, if individual events need to be
accu-mulated, then the brain must first detect and distinguish them.
Received Jan. 12, 2017; revised March 23, 2017; accepted April 2, 2017.
Author contributions: A.K.C. designed research; A.M.L., D.R., M.B.R., and J.P.S. performed research; A.M.L., M.T.K., D.R., and A.K.C. analyzed data; A.M.L., M.T.K., and A.K.C. wrote the paper.
This work was supported by the National Institutes of Health (Grant EY022979 to A.K.C.), the McKnight Founda-tion (A.K.C.), the Simons CollaboraFounda-tion on the Global Brain (A.K.C., M.T.K.), the Pew Charitable Trusts (A.K.C.), the Klingenstein Foundation (A.K.C.), and the Marie Robertson Memorial Fund of Cold Spring Harbor Laboratory (A.K.C.). We thank Barry Burbach and Simon Musall for advice on the figures and analyses and Bernardo Sabatini for providing comments on a draft of the paper.
The authors declare no competing financial interests.
Correspondence and requests for materials should be addressed to Prof. Anne Churchland, Cold Spring Harbor Laboratory, 1 Bungtown Road, Cold Spring Harbor, New York 11724-2209. E-mail:[email protected].
DOI:10.1523/JNEUROSCI.0105-17.2017
Copyright © 2017 the authors 0270-6474/17/374954-13$15.00/0
Significance Statement
Defining the neural circuits that support decision making bridges a gap between our understanding of simple sensorimotor
reflexes and our understanding of truly complex behavior. However, identifying brain areas that play a causal role in decision
making has proved challenging. We tested the causal role of a candidate component of decision circuits, the rat posterior parietal
cortex (PPC). Our interpretation of the data benefited from our use of animals trained to make decisions guided by either visual or
auditory evidence. Our results suggest that PPC plays a causal role specifically in visual decision making and may support sensory
aspects of the decision, such as interpreting the visual signals so that evidence for a decision can be accumulated elsewhere.
The ability of individual auditory events to drive PPC neurons
has been noted as weak (
Hanks et al., 2015
), but this has not been
studied in depth because recent work has focused on slower
mod-ulation over the course of the entire decision. Deficits for visual,
but not auditory, decisions observed after PPC inactivation hint
at a putative role in discriminating visual events (
Raposo et al.,
2014
). However, these inactivation studies are not entirely
con-clusive because neural activity was suppressed continuously for
2–3 h. This leaves open the possibility that a role in evidence
accumulation, or a role in detecting auditory events, might have
been missed: 2–3 h of suppression might permit the animal to
adjust its strategy, potentially recruiting alternate neural circuits
that are not typically involved. Further, existing studies have not
fully characterized the nature of the deficits to visual decisions,
leaving it unclear whether inactivation affected sensory
process-ing specifically or instead affected other decision factors.
Here, we examined PPC’s contribution to decision making by
manipulating and more closely measuring neural responses.
First, we used a temporally precise optogenetic perturbation
method to disrupt neural activity. By disrupting activity during
both visual and auditory decisions, we found specific sensory
processing effects; however, there was little in the way of more
general effects on decisions, such as accumulation of evidence or
the ability to report choices. A probabilistic decision analysis
of-fered insight into effects of PPC disruption on nonsensory factors
that guide decisions, such as a reliance on reward history. Second,
we conducted a temporally precise analysis of previously
col-lected electrophysiological data to isolate the impact of individual
auditory and visual events on PPC responses, providing an
inde-pendent and novel assessment of PPC’s role in auditory and
vi-sual processing during decision making. Finally, we leveraged an
analysis of trial-to-trial variability that is informative about the
underlying computations taking place within an area. All three
approaches support the same conclusion: PPC’s contribution to
perceptual decisions on this task is primarily sensory and may
support computations related to detecting and distinguishing
in-dividual stimulus events. Higher-level choice or action-planning
signals that can be observed in responses of PPC neurons likely
reflect computations that take place elsewhere in the brain.
Materials and Methods
Animal subjects
Adult male Long–Evans rats (200 –250 g; Taconic Farms) were housed withad libitumaccess to food and restricted access to water starting from the onset of behavioral training. Rats were housed on a standard (non-reversed) light/dark cycle; experiments were run during the light part of the cycle. Rats were pair housed initially, but were singly housed once they received injections or implants (see below). All experimental proce-dures were in accordance with the National Institutes of Health’sGuide for the Care and Use of Laboratory Animalsand were approved by the Cold Spring Harbor Animal Care and Use Committee.
Behavior
Four freely moving rats were trained on a rate discrimination task (see Fig. 1A) as described previously (Raposo et al., 2012;Sheppard et al., 2013). Briefly, rats were trained to judge whether the overall rate of a repeating auditory (click) or visual (flash) stimulus was high or low com-pared with a learned category boundary (12.5 events/s, range 9 –16 events/s). Click and flash events were separated by either a long (100 ms) or short (50 ms) interval. Trials with intermediate rates thus contained mixtures of long and short intervals, generating instantaneous rates that fluctuated over the course of 1000 ms, during which time animals were required to keep their snout in a central port. A fixed duration of 1000 ms was selected to allow a more direct comparison with other studies of the PPC’s role in the accumulation of evidence tasks that likewise used a fixed
duration (Erlich et al., 2015;Katz et al., 2016). Rate fluctuations during this 1000 ms period encourage animals to use information throughout the trial to guide their decision. We have demonstrated previously that, for this stimulus, decisions are influenced by evidence presented over the majority of the 1000 ms period, consistent with accumulation of evidence during that time (Raposo et al., 2012;Sheppard et al., 2013).
After the 1000 ms period ended, rats indicated their decision on that trial by moving to a left or right reward port. Response time is defined as the time between when the stimulus ended and when the rat departed the port. Movement time is defined as the time between exiting the center port and entering a reward port. Movements to the correct reward port yielded a drop of water (10 –25l). Three of the four rats were trained that rightward choices were rewarded after high-rate stimuli and leftward choices were rewarded after low-rate stimuli; one rat was trained with the opposite contingency.
Animal training typically lasted 5– 6 weeks and was completed before implanting the stimulation/recording assembly (see “Viral injection” and “Implants for electrophysiology” sections below).
General surgical procedures
All rats subjected to surgery were anesthetized with isoflurane and ad-ministered 5 mg/kg ketoprofen before surgery for analgesia. Isoflurane anesthesia was maintained by monitoring respiration and foot-pinch responses throughout the surgical procedure. Ophthalmic ointment was applied to keep the eyes moistened throughout surgery. Lidocaine solu-tion (⬃0.1 ml) was injected below the scalp to provide local analgesia before performing scalp incisions. 0.05 mg/kg buprenorphine was ad-ministered daily for postsurgery analgesia (usually 2–3 d).
Viral injection
Channelrhodopsin-2 (ChR2) expression was induced in the left PPC of three rats using adeno-associated virus (AAV, serotype 9) carrying the gene for ChR2 fused with green fluorescent protein (GFP) under the control of the CAG promoter (AAV9-CAG-ChR2-GFP). This promoter induces the expression of ChR2 in all cell types. Unilateral injections of this construct were made in the left PPC of 4- to 6-week-old rats. Two to three separate penetrations along the medial–lateral axis were made with the goal of maximizing expression in PPC and minimizing the spread outside of this area. Stereotactic coordinates (relative to bregma) for Rats 1 and 2 were⫺3.8 mm AP, 2.2/3.2/4.2 mm ML; for Rat 3, they were⫺3.8 mm AP and 2.2/3.7 mm ML. A small craniotomy was made and a cali-brated glass pipette positioned within the craniotomy perpendicular to the brain’s surface. For the injection, pressure was applied to a syringe that was attached to the pipette via plastic tubing. Injections were made at 400, 600, and 800m below the pial surface. At each depth, 140 nl was injected. We refrained from deeper injections to avoid viral spread to subcortical structures.
Note that, because all injections were in the left hemisphere, lateralized effects are referred to as “ipsi” or “contra” because these mean the same for all animals. Because we trained different animals to associate the left versus right port with low rate choices, all behavioral data are plotted relative to the injected hemisphere. This convention makes it possible to distinguish biases toward a particular side from biases toward a particular rate because “high-rate” trials are not always associated with the same side.
Implants for electrophysiology
Rats were implanted with custom optetrode implants (Anikeeva et al., 2011) that were prepared in house. Each assembly contained up to eight independently moveable tetrodes (nickel/chrome alloy wire, 12.7m; Sandvik Kanthal). Tetrodes were connected to an EIB-36 narrow con-nector board (Neuralynx) mounted on the implant assembly. Six to eight of the tetrodes were attached to optical fibers used for delivering light (Anikeeva et al., 2011;Znamenskiy and Zador, 2013). Optical fibers were 62.5m in diameter with a 50m core. Each optical fiber was glued to a tetrode; the pair was mounted on an independently moveable micro-drive. The assembly was secured within a plastic enclosure before im-planting. Tetrodes were gold plated to 300 –700 k⍀at 1 kHz; one additional tetrode was used as an internal reference for electrophysiolog-ical recordings and plated to⬃100 k⍀.
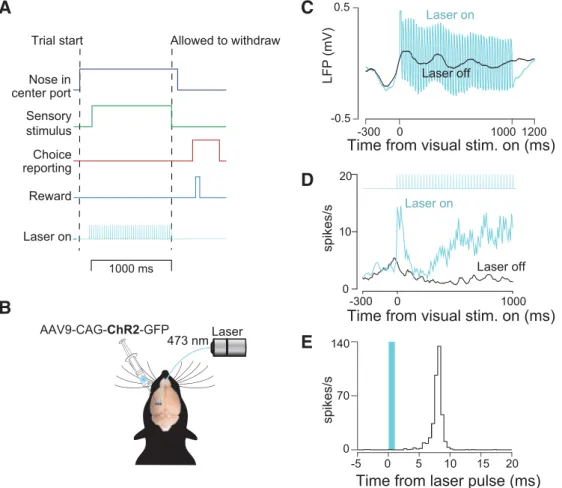
For implantation during surgery, we followed procedures described previously (Raposo et al., 2014). Briefly, we positioned the entire opte-trode assembly so as to center it relative to the previously made injections (⫺3.8 mm AP and 2.5 mm ML). A durotomy was performed and the implant assembly was lowered until the tetrodes just penetrated the pial surface. Next, 2% agarose solution was applied to cover the tetrodes and craniotomy and dental acrylic (Lang Dental) was applied to secure the implant to the skull. The incision was closed around the base of the implant using 1–2 Vicryl sutures anterior and posterior to the implant. After surgery, tetrodes were advanced in increments of 40 – 80m until action potentials were encountered. In all animals, we confirmed that stimulation elicited a clear change in the LFP on at least one tetrode, although responses were typically observed on multiple tetrodes. An ex-ample LFP is shown inFigure 1Cto demonstrate that we were able to observe clear changes in LFP after stimulation.
Optogenetic stimulation
We used blue light (473 nm) with intensity ranging from 5 to 20mW at the fiber tip. To estimate the spread of light, we used a well established method, the brain light tissue transmitter, which estimates light spread based on wavelength, fiber diameter, numerical aperture, and power. We elected to use this method for three reasons. First, the estimates of light spread are accurate and reliable because of the systematic way in which the measurements are collected to generate the calculator (multiple mea-surements at each of many distances from fiber tip). Second, the esti-mates from the calculator are consistent with many additional published measurements for blue light spread in rodents, bothin vivo(Guo et al., 2014) and in slice (Aravanis et al., 2007;Huber et al., 2008). The mea-surements in slice afford a very precise estimate because experimenters can measure light spread directly by placing the slice over the photode-tector of a power meter. Finally, the use of published measurements is justified because the spread of light is likely to be homogeneous across animals; light spread mainly depends on the properties of brain tissue. As a result, judging the extent of stimulation is more straightforward com-pared with judging the spread of chemogenetic disruption. In chemoge-netic disruption (Rogan and Roth, 2011), infected neurons are activated with equal probability by the ligand to a synthetic receptor delivered by a virus. Therefore, the extent of stimulation is determined mainly by the extent of viral spread, so quantifying the spread is essential. Indeed, we estimated spread of effect previously (Raposo et al., 2014). In the current study, extent of expression is less informative because neurons expressing ChR2 that are beyond the range of the blue light will be unaffected. Even if we had expressed ChR2 nonspecifically across the brain, we still would have achieved specificity because of the restriction of the blue light. In-deed, studies routinely achieve specificity with blue light stimulation in animals expressing ChR2 brain wide (Guo et al., 2014).
Based on the diameter of the fiber (50m) and its numerical aperture (0.22), we estimate (http://web.stanford.edu/group/dlab/optogenetics/) that, at a distance of 0.5 mm away from the fiber, irradiance was 24.8 mW/mm2and, at a distance of 1.15 mm away, it was⬍0.5 mW/mm2. Given that 0.5 mW/mm2has been shown to be the minimal required intensity to induce spiking in awake animals (Guo et al., 2014), we infer that our stimulation mainly affected ChR2-expressing neurons within this range. One possibility that these calculations make unlikely is that the blue light (and thus the direct activation) spread to primary visual cortex (V1). Our stimulating fiber was positioned at 3.8 mm posterior to bregma. A distance of 1.15 mm away from the fiber (where light is too weak to drive neurons; see above) corresponds to⬃4.9 mm posterior to bregma. There, the very most anterior tip of V1 is 1.5 mm lateral to where we positioned our optetrode (Paxinos and Watson, 2007). Even if a small number of V1 neurons were somehow affected, our full-field stimulus would only have altered the response of a few V1 neurons representing the extreme lower nasal edge of one hemifield. Activation of V1 neurons is therefore very unlikely to be responsible for our behavioral effects.
On a subset of randomly selected trials (“stimulation trials,” 15–35%), we delivered blue light to activate ChR2-expressing neurons in PPC using a 473 nanometer diode-pumped solid-state laser. On these trials, the laser was triggered at the beginning of the stimulus presentation (visual or auditory) and was kept on throughout the entire decision formation
period (1000 ms), delivering light pulses at a rate of 42 Hz (Fig. 1D). On the remaining trials (“control trials”), no optical stimulation occurred. We used two techniques to minimize the rats’ ability to detect the optical trials by seeing the blue light. In Rats 1 and 2, we covered the implant with black insulating tape before beginning each session. To ensure that no light was emitted, the experimenter would deliver light into the laser while it was connected to the animal in a dark booth and visually inspect the implant for any escaping light. A second method was developed because adding and removing tape from the implant daily reduced the integrity of the implant and sometimes resulted in premature explanta-tion. In this second method, the implant was not covered in tape, but we also used a second optical fiber in a ferrule not implanted in the brain (i.e., light from this laser was blocked from entering the brain). Light from this second fiber was still visible and thus served to mask the light from the stimulation. The second fiber was illuminated on every trial (control trials and stimulation trials). As a result, the presence of blue light would be difficult to use to detect optical stimulation trials.
We typically collected data from a single “site” (stimulation on one fiber at a particular depth) for 5– 8 d; behavioral data were pooled over those days. We then either stimulated on a different tetrode or advanced the current optetrode at least 200m. We first assessed the effects of stimulation on the rat’s overall proportion of correct choices (seeFig. 3) and then analyzed stimulation effects in more detail.
Analysis of stimulation effects
We measured the effects of stimulation on three aspects of behavior. First, we used a probabilistic decision model (Busse et al., 2011) to deter-mine systematically the effects of stimulation on four factors contribut-ing to the animal’s decision. The rat’s binary choiceYon each trial is given by the following:
ln
冉
p1⫺p
冊
⫽0⫹1r⫹2hsuccess⫹3hfail (1)wherep⫽P共Y ⫽1兩,r,h兲,ris the stimulus strength (its rate relative to the 12.5 Hz category boundary; the true range of⫺3.5 to 3.5 events/s above and below the boundary were scaled so that values ranged from⫺1 to 1),hsuccessindicates whether the previous trial was a success (1 if the contralateral side was rewarded,⫺1 if the ipsilateral side was rewarded; 0 otherwise), andhfailindicates whether the previous trial was a failure (1 if the failure followed a decision to the contralateral side,⫺1 if the failure followed a decision to the ipsilateral side; 0 otherwise). The coefficients were fit in MATLAB (The MathWorks) using glmfit and a logit linking function. The observer’s decision was predicted as a combination of four factors, so the values of the fitted coefficients (0-3) provide insight into how much each parameter of the model influences the decision on any given trial. Stimulation (laser-on) and control (laser-off) trials were fitted separately so that the coefficients could be compared. In principle, only the rate (r) should influence the rat’s decision because this determines the reward contingency; however, previous work has shown that, in practice, side bias and reward history bias are influential. If animals were to rely more on reward history bias on stimulation trials, then this would have reduced their overall performance because the correct response for the current trial is independent of the previous trial. Therefore, this analysis afforded a deeper insight into the factors that could alter the rat’s accu-racy on stimulation trials.
To assess significance of differences in the fitted coefficients (seeFig. 4), two tests were performed. For the first test, we conducted one-sided pairedttests for each site separately. The effect of stimulation was eval-uated for each of the four fitted parameters: bias, sensitivity, success history, and failure history. Thet-statistic for each was computed directly using the values of the fitted parameters and their associated SE returned by glmfit (computed from the square root of the diagonal values of the covariance matrix). The SE on the difference was calculated by propagat-ing the error associated with the stimulation and no-stimulation values of each parameter. Second, we conducted one-sided pairedttests for the data pooled across all sites and animals.
For the second test, we measured the effect of stimulation on key temporal aspects of the behavioral response. For instance, we determined
whether stimulation changed the animal’s ability to remain in the center port for the required 1000 ms duration. Specifically, we evaluated whether the proportion of trials in which the animal withdrew early differed for stimulation versus control trials (2test;Table 1). Further, we evaluated the time that elapsed between when the stimulus ended and when the animal exited the center port (response time). We used an unpaired, two-sidedttest to evaluate whether response times differed for stimulation and control trials (seeFig. 3B,Table 1). Finally, we evaluated the time that elapsed between when the rat left the center port and when it arrived at one of the two side ports (movement duration). We used an unpaired, two-sidedttest to evaluate whether movement duration dif-fered for stimulation and control trials (seeFig. 3C,Table 1).
We wished to estimate the window over which sensory stimuli influ-enced the rat’s decision and to evaluate whether disruption affected that window. To achieve this, we used a regression analysis (Katz et al., 2016) that computed separately the influence of successive 100 ms time win-dows on the rat’s eventual decision (seeFig. 4D,J). The weight of each time window was computed via logistic regression, where the rat’s binary choiceYon each trial is given by the following:
ln
冉
p1⫺p
冊
⫽0⫹xTw (2) wherep⫽P共Y ⫽10,x,w兲,0is a scalar bias term,xis a vector of the 10 successive time windows over the trial, andwis a vector of the weights for each time window. The weight vectorwwas computed using glmfit (MATLAB). This analysis can reveal whether stimulation changed how the animal used information as it arrives over time, potentially revealing leaky accumulation or a tendency to make “snap judgments.” The anal-ysis is similar to the excess rate analanal-ysis that we have used previously (Raposo et al., 2012;Sheppard et al., 2013), but has the advantage of not requiring the exclusion of many trials. Data were pooled across the three injected animals to provide sufficient power to estimate weights on stim-ulation trials, which were rarer.Analysis of electrophysiological responses
We performed two analyses of electrophysiological responses from a previously collected dataset (Raposo et al., 2014). We used this dataset instead of the electrophysiological dataset associated with optogenetic stimulation because of its large size (n⫽101,972 trials). Although we did record well isolated neurons with the optetrodes used here (seeFig. 1D), the population size did not provide the statistical power needed for the relevant analyses. Because the previous dataset consists of rats perform-ing an identical task, the data were ideally suited to these analyses.
Analysis of the effect of single stimulus events on neural responses. For the first analysis (seeFig. 8B–D), we wished to determine whether single flash or click events modulated firing rates at fast timescales independent of overall condition modulation (the tuning captured in a typical peris-timulus time histogram). To do so, we considered all successful trials of the highest or lowest rates separately. We first smoothed each trial’s firing rate with an acausal Gaussian (15 ms SD). We then made perievent time histograms (PETHs) for low-rate trials. The first three events of every trial were discarded to reduce the effects of onset transients and adapta-tion. Intuitively, if neurons were modulated by individual events, then we would expect quick deflections in the firing rate after each flash or click.
If a neuron exhibited choice tuning (a slow upward or downward ramp in firing rate over the course of the whole stimulus), then this would appear in the PETH as a near-linear trend. To remove these trends, we linearly detrended each PETH using 1.5 cycles of the stimulus. Next, as a simple raw estimate of event modulation (mraw), we computed the SD of this PETH to capture whatever deflection was present. However, noise always has a nonzero SD, so this estimate is biased: noisier neurons will tend to produce higher values ofmraw. To correct for this bias, we as-sumed that the observed spiking was the sum of the “true” underlying fluctuations in the firing rate (event tuning) plus noise (Shadlen and Newsome, 1998;Nawrot et al., 2008;Churchland et al., 2011). The vari-ance of the noise process at any time point is simply the square of the SEM (denotedmean2). Because event modulation was typically small com-pared with total firing rate, we approximated the total noise by averaging the SEM over time points. Because variances add for the sum of indepen-dent random processes,mraw2 ⫽ m2 ⫹ mean2 and our modulation
index was therefore:
m⫽
冑
mraw2 ⫺mean2 (3)For neurons wheremraw2 ⬍ mean2, we assignedm⫽0. To obtain the
modulation index for high-rate trials, the same process was repeated using events from high-rate trials. Note that values of exactly 0 were excluded from the histograms inFigure 8D.
To assess significance for each neuron, we wished to know how often pure noise (truem⫽0) would give rise to a modulation index as large as what we observed due to chance. Our modulation index is essentially just a SD. For a Gaussian random process, the SE of a SD is as follows:
SE共兲 ⫽ 2
冑
2/DOF, whereDOFis the number of degrees of freedom and here ⫽ mean. To estimate theDOFof the smoothed series, we usedthe common approximation Tr(S), whereSis the linear smoothing matrix and Tr(⫺) indicates taking the trace of a matrix. Using this approximation, for a Gaussian smoothing kernel, the equation is as follows:
DOF⬇ N
smoothing
冑
2 (4)For each neuron, we then convertedmandSE共mean兲into a one-tailed p-value. By inspection of individual neurons, event modulation was al-most always greater for low-rate trials, so only low-rate trials were tested for significance. Thesep-values were not corrected for multiple compar-isons because the goal was to obtain an estimate of the number of mod-ulated neurons, not to determine whether any neurons were modmod-ulated. We also computed a Bonferroni-correctedp-value threshold for the lat-ter purpose: at a significance level ofp⬍0.05/317, 45 neurons were significant for visual and 2 for auditory.
Analysis of trial-to-trial variance to provide insight on neural computa-tion. To understand how trial-to-trial variability evolved over the course of auditory and visual decisions, we computed a measure of spike count variability, the variance of the conditional expectation (VarCE) ( Church-land et al., 2011;Brostek et al., 2013;Marcos et al., 2013;Ding, 2015). Briefly, this measure assumes that the total measured spike count vari-ance can be divided into two components using the law of total varivari-ance for doubly stochastic processes: (1) variance of counts that would be
Table 1. Movement metrics computed separately for each animal, pooled across all sites tested
Prop. early withdrawal Response time (ms) Movement duration (ms)
Control Stim p N Control Stim p N Control Stim p N
Visual trials Rat 1 0.254 0.194 ⬍10 –3 3622 157.7 153.0 0.188 2796 542.5 540.0 0.584 2796 Rat 2 0.237 0.264 0.015 7222 219.9 212.2 0.045 5430 592.7 597.3 0.281 5430 Rat 3 0.344 0.296 ⬍10 –3 17837 214.9 207.4 0.010 11757 490.2 485.1 0.054 11757 Auditory trials Rat 1 0.191 0.101 ⬍10 –3 2723 176.3 180.5 0.341 2313 536.8 523.5 0.007 2313 Rat 2 0.208 0.214 0.518 7406 262.0 241.4 ⬍10 –3 5823 602.6 604.1 0.708 5823 Rat 3 0.299 0.235 ⬍10 –3 8150 216.6 212.5 0.389 5729 480.0 491.3 0.006 5729
produced by a stochastic point process with a given rate (“spiking noise”) and (2) the variance of the rates that would produce those counts (“con-ditional expectation”). The VarCE isolates the second of these compo-nents and is therefore informative about underlying mechanism. In principle, the VarCE is computed by subtracting an estimate of the first component from the total spike count variance as follows:
S具2Ni典⫽S
Ni 2 ⫺N
i (5)
whereNiis a vector of spike counts for a given neuron and given condi-tion in time windowi,SNi
2 is the sample variance of those spike counts,N
i
is the mean spike count of a neuron across trials of a given condition in time windowi, andis a constant that approximates the degree to which spike count variability scales with firing rate (Geisler and Albrecht, 1995; Nawrot et al., 2008). In practice, as in previous work, we computed separately for each neuron in the dataset by taking the minimum of the measured Fano factor across all conditions and time points. To make it possible to combine data from multiple conditions, we estimatedSNi 2 using the residuals; that is, by subtracting from each sample count the mean for all trials sharing its condition. The VarCE plotted inFigure 8E
is the variance of the union of residuals from all conditions minus the weighted average of the stochastic variance共N兲(see Eq. 6 in Church-land et al., 2011). A sliding time window with a width of 100 ms was used for the traces inFigure 8E. Longer (150 ms) and shorter (60 ms) windows yielded similar results.
Results
Optogenetic disruption of PPC reduces the accuracy of visual
decision making
To probe for a causal role for PPC, we used a perceptual decision
task (
Raposo et al., 2012
;
Sheppard et al., 2013
;
Raposo et al.,
2014
) in which freely moving rats judge whether the fluctuating
rate of a 1000 ms series of auditory or visual events (rate range:
9 –16 Hz) is high or low compared with an abstract category
boundary (12.5 Hz;
Fig. 1
A
).
Our strategy for disrupting PPC was to stimulate optogenetically
PPC neurons expressing ChR2 (
Boyden et al., 2005
) in all cell types
(
Fig. 1
B
). This approach, disruption via elevation of responses of
neurons nonspecifically, has been widely used (
Churchland and
Shenoy, 2007
;
Roberts et al., 2012
;
Rodgers and DeWeese, 2014
;
Otchy et al., 2015
). It is effective in areas such as PPC in which
neurons with heterogeneous response properties are spatially
inter-mixed (
Raposo et al., 2014
). Short-latency changes could be
ob-served in the LFP and the spikes of single units on the occasions that
we were able to isolate them (
Fig. 1
C
–
E
), confirming expression of
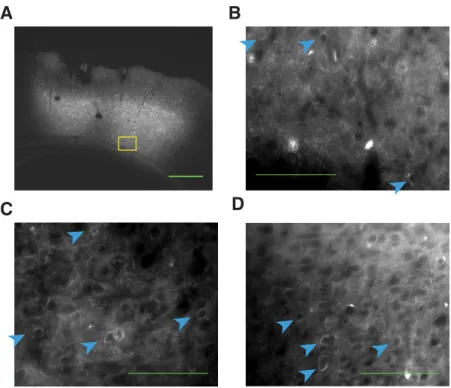
ChR2. Further, histology obtained at the end of the experiment (
Fig.
2
) indicated robust virus expression in all three injected rats.
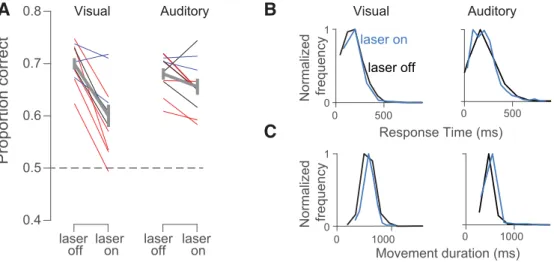
Stimulation reduced the animal’s decision accuracy, a
reduc-tion that was large and significant on visual trials (
Fig. 3
A
, left,
Nose in center port Sensory stimulus Reward Choice reporting
Trial start Allowed to withdraw
Laser on 0 10 20 spikes/s -300 0 1000 Laser off Laser on Laser 473 nm AAV9-CAG-ChR2-GFP spikes/s 1000 ms -300 1000 1200 -0.5 0.5 LFP (mV) 0 Laser off Laser on -5 0 5 10 15 20
Time from laser pulse (ms)
0 140 70E
D
C
A
B
Time from visual stim. on (ms)
Time from visual stim. on (ms)
Figure 1. Decision-making task and strategy for disrupting PPC activity.A, Schematic of decision-making task. Rats initiated trials by inserting their snouts into a port spanned by an infrared beam (dark blue trace). After a variable delay, a series of auditory or visual events began (green trace). Animals were required to remain in a center port for 1000 ms during which time these sensory stimuli were presented. Animals were then allowed to withdraw. They reported choices (red trace) at either a left or right decision port and were rewarded with a drop of water (light blue trace) when correct. Optogenetic stimulation (42 Hz, 5–20 mW, cyan trace) was presented throughout the 1000 ms period on randomly selected trials.B, Schematic of optogenetic approach showing unilateral injections of AAV9-CAG-ChR2-GFP into PPC.C, LFP recorded during laser-on and laser-off trials via a tetrode attached to the stimulating optical fiber.D, Peristimulus time histogram for an example well isolated single neuron for laser-on (cyan) and laser-off (black) trials.E, PETH in which responses are aligned to individual pulses of blue light.
p
⫽
0.0002) and modest and insignificant on auditory trials (
Fig.
3
A
, right,
p
⫽
0.08). The effect of stimulation on the proportion
of correct trials was larger for visual than for auditory trials
(2-sided
t
test,
p
⫽
0.01). The larger effect on visual decisions was not
due to a difference in baseline performance. Animals’ accuracy
on control trials was similar for auditory versus visual decisions:
averaged across all stimulus difficulty levels, the proportion of
correct choices was 0.68 correct for auditory trials versus 0.70 for
visual trials, a difference that did not reach significance (
p
⫽
0.08,
paired
t
test). The effects of stimulation were restricted to
deci-sion accuracy and were not overall detrimental to the animals’
ability to engage in the task or report choices. The proportion of
trials that were aborted because of an early withdrawal from the
center port did not increase appreciably with stimulation and in
two animals showed a significant decrease, providing reassurance
that the stimulation did not cause the rats to become impulsive
(
Table 1
). Stimulation also did not lead to sluggish movements:
the time that it took for animals to withdraw from the center port
once the stimulus had ended was similar on stimulation and
control trials; in the significant cases, animals were in fact
slightly faster on stimulation trials (response time;
Fig. 3
B
,
Table 1
). Finally, the time that elapsed between when animals
left the center port and when they arrived at a reward port was
similar on stimulation and control trials (movement duration;
Fig. 3
C
,
Table 1
).
Visual accuracy deficits stem from a loss of sensitivity
The reduction in visual accuracy that we observed could be due to
disruption of any of a number of steps in the process by which the
animal converts incoming sensory signals into a decision (
Gold
and Ding, 2013
). To gain insight into which steps in the decision
process were disrupted, we visualized the stimulation and control
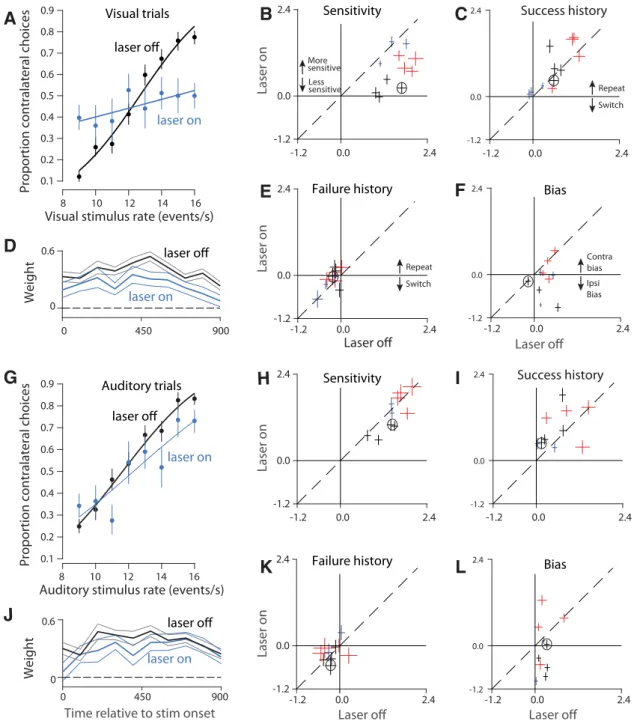
data as psychometric functions in which the proportion of
cor-rect choices is plotted as a function of the
stimulus rate (
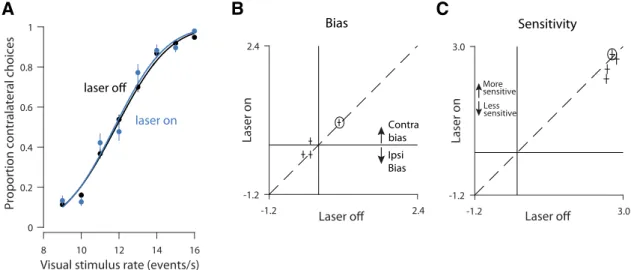
Fig. 4
A
). For visual trials at
this example site, the psychometric
func-tion on stimulafunc-tion trials (blue) is
shal-lower than that for control trials (black).
This means that a given change in visual
stimulus rate (horizontal axis) had a
weaker effect on decisions (vertical axis)
for stimulation versus control trials, a
change that contributed to the overall
re-duction in decision accuracy evident in
Figure 3
A
(left).
To quantify and understand these
changes more deeply and to compare
them across animals and stimulation sites,
we used a probabilistic decision model
(
Lau and Glimcher, 2005
;
Busse et al.,
2011
) (see Materials and Methods). This
model included sensitivity to stimulus
rate, bias, and two additional factors that
affect decisions (related to trial history;
see below). Each factor could in principle
be affected by stimulation, offering insight
into the precise nature of the observed
deficits. The most consistent factor
af-fected by stimulation was reduced
sensi-tivity, which was significant overall (
Fig.
4
B
, most points below the
y
⫽
x
line;
p
⫽
0.0003; effects were individually
signifi-cant in 7 of 11 sites;
p
⬍
0.01,
t
test). This
loss of sensitivity serves to reduce the steepness of the
psychomet-ric function described above (
Fig. 4
A
). To test whether this loss of
sensitivity was temporally specific, we examined the sensitivity of
control trials that immediately followed a stimulation trial. No
effect on sensitivity for these trials was evident (data not shown,
p
⫽
0.49). The restriction of sensitivity effects to the current trial
confirms that our optogenetic strategy was successful in driving
temporally precise disruption.
In addition to a loss of sensitivity, the shallower psychometric
functions (and worse accuracy) on stimulation trials might be
explained by an increased tendency for rats to be influenced by
the previous trial’s outcome. Because trials are generated
inde-pendently, any influence of the previous trial, such as repeating a
successful decision, is deleterious and would serve to reduce
over-all accuracy (
Busse et al., 2011
). The probabilistic decision
anal-ysis ruled out increased reliance on trial history as an explanation
for deficits on stimulation trials. Stimulation had a very weak
effect on the degree to which the current decision was influenced
by the previous trial’s success (
Fig. 4
C
,
p
⫽
0.16; 2 of 11 individual
sites were significant,
p
⬍
0.01,
t
test) or failure (
Fig. 4
E
,
p
⫽
0.04,
t
test, 0 of 11 individual sites were significant,
p
⬍
0.01,
t
test).
These results rule out two “strategy” explanations for the
stimu-lation effects, supporting the hypothesis that stimustimu-lation drove a
loss of visual sensitivity.
The fourth parameter in the probabilistic decision model is
the animal’s bias. Bias is defined as a tendency for animals to favor
one side over the other regardless of the strength of the sensory
evidence. Under the hypothesis that PPC in one hemisphere is
involved preferentially in computations relevant to the
contralat-eral side (
Crowne et al., 1986
;
Hanks et al., 2006
), disrupting PPC
in one hemisphere could bias the animal away from contralateral
choices, driving an ipsilateral bias. We observed this ipsilateral
bias at a number of sites (
Fig. 4
F
, most points below the
y
⫽
x
line;
A
B
C
D
Figure 2. Robust expression of GFP-tagged ChR2 in PPC.A, Brain section from Rat 3 showing injection site within PPC. Green scale bar, 500m. Yellow box indicates region that will be magnified in the subsequent panel.B, Further magnified view of the same image. Blue arrows indicate individual cells with membrane-bound GFP indicating the presence of ChR2. Green scale bar, 100
p
⫽
0.013; effects were individually significant in 6 of 11 sites;
p
⬍
0.01,
t
test).
Altogether, the probabilistic choice analysis suggests that the
reduced decision accuracy on visual trials was largely driven by a
consistent, reduced sensitivity to visual inputs that was
some-times exacerbated by a bias away from contralateral choices.
A final potential explanation for the reduced visual decision
accuracy (
Fig. 3
A
) is that the animals accumulated evidence for
less time on stimulation versus control trials. This could reduce
visual decision accuracy even if sensitivity were unchanged: a
shorter accumulation time would lead the animal to miss
evi-dence. To gain insight into accumulation time, we measured the
degree to which instantaneous fluctuations in stimulus rate
influ-enced the rat’s eventual decision (see Materials and Methods).
This analysis demonstrated that, on both stimulation and control
trials, evidence presented throughout the trial influenced the
an-imal’s eventual decision (
Fig. 4
D
, blue and black lines
⬎
0 for the
entire trial). This is consistent with long accumulation times for
both stimulation and control trials and argues against the
possi-bility that stimulation affected the duration over which evidence
was accumulated. Notably, evidence at each moment had a
weaker influence on stimulation versus control trials (
Fig. 4
D
,
blue line below black line). This difference was significant (
p
⫽
0.0001,
t
test) and is consistent with the loss of sensitivity
indi-cated by the probabilistic choice model.
To ensure that the effects observed were due to ChR2
activa-tion, we repeated the same stimulation protocol in a rat not
in-jected with ChR2 (
Fig. 5
A
). Similar values were observed on
stimulation and control trials for bias (
p
⫽
0.22,
t
test) and
sen-sitivity (
p
⫽
0.20,
t
test). This indicates that blue light in the brain
does not by itself drive the effects that we observed.
Together, these analyses provide strong evidence that PPC
disruption reduced the rat’s sensitivity on visual decisions.
Optogenetic disruption of PPC largely spared auditory
decision making
We evaluated performance on interleaved auditory trials to
de-termine whether the effects reported so far reflected a loss of
sensitivity that was specific to vision or instead reflected more
general decision-making deficits. Auditory decisions from the
same site and sessions as in
Figure 4
A
demonstrate a much
weaker effect of stimulation (
Fig. 4
G
). Some sites (4/11) did have
small reductions in sensitivity that reached significance (
p
⬍
0.01;
Fig. 4
H
, points below dashed line). Across sites, however,
this reduction in sensitivity was not significant (
Fig. 4
H
,
p
⫽
0.13). Further, a site-by-site comparison revealed that visual
sen-sitivity was significantly more reduced by stimulation compared
with auditory sensitivity (
Fig. 6
A
;
p
⫽
0.0021,
t
test).
No consistent effect was observed on animals’ reliance on trial
history regardless of whether it was a previous trial’s success (
Fig.
4
I
,
p
⫽
0.16,
t
test) or failure (
Fig. 4
K
,
p
⫽
0.28,
t
test).
The effect on bias was idiosyncratic. As with visual trials, an
ipsi-lateral bias was sometimes present, but biases in the opposite
direc-tion were also observed [
Fig. 4
L
; a significant ipsilateral bias (same
direction as for visual trials) was evident at 6 of 10 sites and a
signif-icant contralateral bias was evident at 2 of 10 individual sites,
p
⬍
0.01,
t
test]. No significant change was present overall (
Fig. 4
L
,
p
⫽
0.13,
t
test). The difference in bias between auditory and visual trials
did not reach significance (
Fig. 6
B
,
p
⫽
0.29,
t
test). Heterogeneity in
bias effects may reflect that there are two or more subgroups of
neurons in PPC with distinct projection targets (
Li et al., 2015
).
We repeated the logistic regression analysis, examining the
effects of previous left and right decisions separately. We still
failed to find consistent evidence that stimulation changed the
animal’s strategy, although there were two significant cases: First,
animals tended to repeat successful visual, contralateral choices
significantly more on stimulation versus control trials (
p
⫽
0.0057). This was not the case for successful auditory
contralat-eral choices (
p
⫽
0.13). Second, animals tended to repeat failed
auditory, contralateral choices significantly more on stimulation
versus control trials (
p
⫽
0.013). This was not the case for failed
visual contralateral choices (
p
⫽
0.074). This more specific
anal-ysis of trial history reinforces our finding that the effect of
previ-ous choice is not affected consistently by PPC disruption.
Finally, as with visual decisions, we measured the degree to
which instantaneous fluctuations in auditory stimulus rate
influ-enced the rat’s eventual decision (see Materials and Methods).
Again, we found that, on both stimulation and control trials,
evidence presented throughout the trial influenced the animal’s
eventual decision (
Fig. 4
J
, blue and black lines
⬎
0 for the entire
0.4 0.5 0.6 0.7 0.8
Proportion correct
Auditory Visual laser off laser on laseroff laser on Movement duration (ms)
Response Time (ms) 0 1000 0 500 0 1 Normalized frequency
A
0 500 0 1000C
B
Visual Auditory 0 1 Normalized frequency laser on laser offFigure 3. Stimulation drives a strong reduction in visual, but not auditory, decision accuracy and largely spares movements.A, Proportion correct for laser on versus laser off trials for visual (left) and auditory (right) trials. Each line illustrates values for a single site; lines of the same color are from the same animal (3 rats total). Thick gray line indicates mean (⫾SEM) for all sites. Dashed line indicates chance performance.B, Response times from an example site in one rat were similar after laser-on (blue) and laser-off (black) trials on both visual (left, 183 vs 184 ms,p⫽0.16) and auditory (right, 209 vs 211 ms,p⫽0.67) decisions.C, Movement durations from an example site were similar after laser-on (blue) and laser-off (black) trials on both visual (left, 588 vs 578 ms,p⫽ 0.15) and auditory (right, 491 vs 476 ms,p⫽0.01) decisions.
trial). This argues against the possibility that stimulation affected
the duration over which evidence was accumulated. Weights
were slightly reduced on stimulation compared with control
tri-als (
p
⫽
0.02), again consistent with a weaker and inconsistent
effect on auditory sensitivity.
Together, these analyses provide strong evidence that PPC
disruption had only a weak effect on the rat’s sensitivity on
audi-tory decisions.
PPC neurons are more strongly driven by individual visual
events than by auditory events
The consistent effect of stimulation on visual, but not auditory,
sensitivity argues against a simple model in which auditory and
visual signals influence PPC equally (
Fig. 7
A
). Our results suggest
a new class of model in which PPC is a key player for translating
visual, but not auditory, sensory signals into decisions (
Fig.
7
B
,
C
). To provide an independent test of this class of model, we
Laser off
E
Laser on Ipsi Bias Contra biasA
Laser off Visual trialsG
I
Success historyL
Laser on Switch Repeat Laser on Laser onLaser off Laser off
Bias Sensitivity Failure history Success history Switch Repeat Sensitivity
Failure history Bias
Less sensitive More sensitive
F
C
B
H
Auditory trialsK
-1.2 0.0 2.4 -1.2 0.0 2.4 -1.2 0.0 2.4 -1.2 0.0 2.4 -1.2 0.0 2.4 -1.2 0.0 2.4 -1.2 0.0 2.4 -1.2 0.0 2.4 -1.2 0.0 2.4 -1.2 0.0 2.4 -1.2 0.0 2.4 -1.2 0.0 2.4 -1.2 0.0 2.4 -1.2 0.0 2.4 -1.2 0.0 2.4 -1.2 0.0 2.4 8 10 12 14 16Auditory stimulus rate (events/s) 0.1 0.2 0.3 0.4 0.5 0.6 0.7 0.8 0.9
Proportion contralateral choices
laser on
laser off
8 10 12 14 16 Visual stimulus rate (events/s) 0.1 0.2 0.3 0.4 0.5 0.6 0.7 0.8 0.9
Proportion contralateral choices
laser on laser off 0 450 900 0 0.6 Weight Weight 0 450 900 0 0.6
Time relative to stim onset
D
J
laser on laser on laser off laser offFigure 4. PPC disruption has a larger effect on visual, compared with auditory, decisions.A, Visual psychometric functions from stimulation in a single location within PPC (Rat 1, 1624 trials). Smooth lines are fits to the data (logistic regression). Error bars reflect the Wilson binomial confidence interval.B, Outcome of a probabilistic model that measures the effect of sensitivity to stimulus rate on decisions. The fitted parameter is plotted for stimulation (laser-on, vertical axis) versus control (laser-off, horizontal axis) trials. All values are positive, indicating that increasing stimulus rate led to more high rate decisions. Error bars indicate SEs. Dashed line,y⫽x. Colors: individual rats; multiple points for each animal indicate data collected from different optical fibers/depths (sites) within PPC. Black circle indicates the animal shown inA.C, Same asBbut for the “success history” parameter. Positive values indicate that the rat tended to repeat rewarded decisions.D, Weighting of visual sensory evidence during 100 ms windows. Vertical axis indicates the weight for the time indicated by the corresponding value on the horizontal axis. Weights were computed via logistic regression (see Materials and Methods). Values would approximate dashed line (y⫽0) for times during which sensory evidence failed to influence the choice. Black line indicates control (15,267 trials). Cyan line: stimulation (6046 trials).E, Same asBbut for the “failure history” parameter. Negative values indicate the rat tended to switch after unrewarded decisions.F, Same asBbut for the “bias” parameter. Zero indicates unbiased decisions; negative values indicate an ipsilateral bias.G, Auditory psychometric functions from the same rat/site as in (A) (1655 trials).H,I,K,L, Same as
evaluated whether individual visual
sen-sory events had a larger impact on PPC
responses compared with individual
audi-tory sensory events using a previously
col-lected, large-scale (
N
⫽
101,972 successful
trials) electrophysiological dataset (
Raposo
et al., 2014
). This sensory-evoked response
is potentially separate from the
decision-related responses reported in previous
analyses (
Raposo et al., 2014
), which
fo-cused on slower signals evolving over an
entire 1000 ms decision (
Fig. 8
A
) rather
than on transient responses after
individ-ual sensory events. Indeed, a signature of
individual events can be obscured when
trials with events at different times are
av-eraged, especially when the slower
deci-sion modulation is large (
Fig. 8
A
) or with
wide-filter smoothing (as is often used to
improve signal-to-noise ratios). We
eval-uated the impact of individual auditory
and visual events by aligning
electrophys-iological responses to individual visual or
auditory events in single neurons and
re-moving the slow component (see
Materi-als and Methods). Many neurons were
driven by individual stimulus events (
Fig.
8
B
). This event modulation was
fre-quently evident in visual trials (84 of 317
neurons at
p
⬍
0.01), but only
occasion-ally in auditory trials (5 of 317 neurons at
p
⬍
0.01). Modulation was significantly
more common due to visual compared
with auditory events (
p
⬍⬍
10
⫺4,
22
⫻
2
contingency table). Modulation was also
significantly stronger for visual compared
with auditory events within neurons (
Fig.
8
C
,
D
). This greater modulation for visual
events was significant in 4/5 individual
animals (paired sign test,
p
⬍⬍
10
⫺4;
p
⫽
0.50;
p
⫽
0.0008;
p
⫽
0.0003;
p
⫽
0.035).
8 10 12 14 16Visual stimulus rate (events/s)
0 0.2 0.4 0.6 0.8 1
Proportion contralateral choices
laser on laser off
A
C
Bias Sensitivity Ipsi Bias Contra biasB
Less sensitive More sensitive -1.2 2.4 Laser off -1.2 2.4 Laser on -1.2 Laser off 3.0 -1.2 3.0 Laser onFigure 5. In an uninjected rat, decisions are unaffected by blue light.A, Psychometric functions for sessions in which a single laser was used and black tape was applied to prevent light from escaping the sides of the implanted chamber (5781 trials). No effect was seen on choice (p⫽0.33) or sensitivity (p⫽0.31).B,C, Effects on bias and sensitivity from four experiments (same conventions as inFig. 4B,F) for the animal inA. The site inAis indicated by the circled points. Solid lines indicate 0.
-1.5 0.5
Effect on choice bias
B
Effect on SensitivityA
Laser drove contra bias Laser drove ipsi bias Laser decreased sensitivity Laser increased sensitivityVisual Auditory Visual Auditory
-1.5 2
0 0
Figure 6. Site-by-site comparison of stimulation effects on bias and sensitivity for auditory and visual trials. Each point was computed by taking the difference in the regression coefficients between stimulation and control trials for each modality at each stimulation site in the three rats. Coefficients obtained from auditory and visual trials at the same stimulation site (interleaved trials) are connected with a solid line. Dashed line at 0 indicates no effect of stimulation.A, Stimulation caused a larger reduction on visual sensitivity (blue points) compared with auditory sensitivity (green points). This difference was significant (ttest,p⫽ 0.0021).B, Stimulation caused a larger ipsilateral bias on visual (blue) compared with auditory (green) decisions. However, this difference did not reach significance (ttest,p⫽0.29).
PPC
Sensory input: audition
Sensory input: vision
A
Balanced input model
circuit
PPC
Sensory input: audition
Sensory input: vision
B
Local accumulation model
Auditory choice signal
PPC
Sensory input: vision
C
Remote accumulation model
Sensory input: audition
Accumulation
circuit
Accumulation
Figure 7. Putative models for PPC’s role in a decision circuit.A, Balanced input model that is unsupported by the disruption experiment.B, Local accumulation model in which visual inputs to PPC are stronger than auditory inputs and evidence over time is accumulated within PPC. Visual choice signals are therefore computed locally within PPC as the output of the accumulation circuit (pink). Auditory information is accumulated elsewhere and fed back to PPC (green arrows).C, Remote accumulation model in which visual inputs to PPC are stronger than auditory inputs and evidence over time is accumulated at a remote location and fed back to PPC.
Importantly, a larger effect of visual inputs was evident despite
the fact that auditory and visual stimuli were carefully matched so
that they had an equivalent effect on decisions (see Fig. 1
C
of
Raposo et al., 2014
). These observations, like the disruption
ef-fects, support models in which visual inputs are dominant in PPC
(
Fig. 7
B
,
C
).
Analysis of trial-to-trial variability suggests sensory signals
are accumulated remotely
Visual inputs to PPC might be accumulated locally within the
area (local accumulation model;
Fig. 7
B
) or might be
accumu-lated in another region that projects back to PPC (remote
accu-mulation model;
Fig. 7
C
). Theory suggests that, as integrators
accumulate evidence, they should also accumulate noise that will
vary across trials (
Churchland et al., 2011
). A rise in VarCE that is
at least transient is predicted for any model that strongly includes
accumulating evidence or count in some way. This is because the
early evidence in some trials points toward one decision, whereas
the early evidence in other trials points toward the opposite
decision.
Therefore, trial-to-trial variability should increase during
de-cision formation in areas that reflect evidence accumulation. In
contrast, in areas dominated by sensory inputs or movement
preparation, the stabilizing influence of the input or motor plan
will drive decreases in trial-to-trial variability over time in a trial
(
Churchland et al., 2010
;
Rajan et al., 2010
). A measure of
trial-to-trial variability in neural responses, the VarCE (
Churchland et
al., 2011
), was designed to distinguish these possibilities. In
sev-eral decision-related brain areas in the monkey, the VarCE has
been demonstrated to increase over time during evidence
accu-mulation decisions (
Churchland et al., 2011
;
Ding, 2015
). In the
present data, clear decreases in VarCE were observed for both
auditory and visual trials (
Fig. 8
E
).
Discussion
Our results argue that PPC plays a causal role in the sensory
processing aspects of visual decision making and that choice
sig-nals that have been observed electrophysiologically may reflect
computations that take place elsewhere in the circuit. Three
ob-servations support this. First, optogenetic disruption of PPC
re-duces sensitivity on visual decisions but largely spares auditory
decisions and does not affect movement metrics or the time
course of evidence accumulation (
Figs. 3
,
4
). Second, in our task,
individual visual events drive larger electrophysiological
re-sponses in single neurons compared with auditory events (
Fig.
8
B
–
D
), even though these events are equally effective in driving
behavior. Finally, trial-to-trial variability decreases during
deci-sions, suggesting the presence of an overall stabilizing influence
from sensory inputs or action planning rather than the
destabi-lizing influence of evidence accumulation (
Fig. 8
E
). Together,
C
Number of neurons
D
0 10
Firing rate (spikes/s)
−300 0 1000
0 10
Firing rate (spikes/s)
−50 0 50 100 150 200
A
B
Time from sensory stim. on (ms)
Time from sensory event (ms)
High rate, vis
Low rate, vis
High rate, aud
Low rate, aud
Choice modulated
Event modulated
Aud
Vis
E
0.3 0.6VarCE
−150 0 800Time from sensory stim. on (ms)
01.1
Modulation by sensory stimuli
Visual Auditory 036
−2 0 2 4 6 8 10
Vis − Aud event modulation
(spikes/s)
Figure 8. Electrophysiological analyses suggesting that PPC discriminates individual visual events and does not act as an evidence accumulator.A, Trial-averaged peristimulus time histogram for an example neuron. Solid traces indicate low-rate trials; dashed traces, high-rate trials; blue traces, visual trials; and green traces, auditory trials. Transparent fills show SEM. Outcome of the decision (dashed vs solid lines) and the stimulus modality (blue vs green lines) drove slow modulations over the 1000 ms decision.B, PETH for same neuron as inAaligned to individual visual or auditory events (see Materials and Methods). Same color conventions asA; only responses to low rate trials are shown.C, Modulation strength of each neuron by visual (blue) and auditory (green) events. Vertical axis indicates spikes per second plotted on a log scale. Data are aggregated across five animals. The two measurements for each neuron are connected by a line. Note that, after correcting for noise, many neurons had a modulation index of 0.D, Histogram over neurons of the modulation index for visual minus the index for auditory (same dataset as inC). Neurons with both modulation indices equal to 0 were excluded. Arrow shows median (0.68;p⬍10⫺10, sign test).E, VarCE computed relative to stimulus onset for auditory (green) and visual (blue) trials.