Operator Based on Correspondence Analysis
Sabine Loudcher and Omar Boussaid
ERIC laboratory, University of Lyon (University Lyon 2) 5 avenue Pierre Mendes-France, 69676 Bron Cedex, France
Tel.: +33-4-78774492 Fax: +33-4-78772375
(sabine.loudcher,omar.boussaid)@univ-lyon2.fr
Abstract. Data warehouses and Online Analysis Processing (OLAP) have acknowledged and efficient solutions for helping in the decision-making process. Through OLAP operators, online analysis enables the decision-maker to navigate and view data represented in a multi-dimensional manner. But when the data or objects to be analyzed are complex, it is necessary to redefine and enhance the abilities of the OLAP. In this paper, we suggest combining OLAP and data mining in order to create a new visualization operator for complex data or objects. This opera-tor uses the correspondence analysis method and we call it VOCoDa (Visualization Operator for Complex Data).
Key words: OLAP, complex data, visualization, factor analysis
1 Introduction
Data warehouses and Online Analysis Processing (OLAP) have recognized and effective solutions for helping in the decision-making process. Online analysis, thanks to operators, makes it possible to display data in a multi-dimensional manner. This technology is well-suited when data are simple and when the facts are analyzed with numeric measures and qualitative descriptors in dimensions. However, the advent of complex data has questioned this process of data ware-housing and online analysis.
Data are said to be complex when they are:
– represented in various formats (databases, texts, images, sounds, videos...); – diversely structured (relational databases, XML documents...);
– originating from several different sources;
– described through several channels or points of view (a video and a text that describe the same meteorological phenomenon, data expressed in different scales or languages...);
– changing in terms of definition or value (temporal databases, periodical sur-veys...).
Complex data often contain a document, an image, a video, ..., and each of these elements can be described and observed by a set of low-level descriptors or by semantic descriptors. This set of elements can be seen not only as com-plex data but also as a comcom-plex object. A comcom-plex object is a heterogeneous set of data, which, when combined, form a semantic unit. For instance, a patient’s medical record may be composed by heterogeneous elements ( medical test re-sults, X-rays, ultrasounds, medical past history, letter from the current doctor, ...) and is a semantic unit. It is a complex object.
As said above, warehousing and online analytical processes must be modified in the case of complex objects. In this paper, we focus on the visualization of complex objects. The problem of storing and modeling complex objects is dis-cussed in other articles [6, 5]. The purpose of online analysis is to (1) aggregate many data to summarize the information they contain; (2) display the informa-tion according to different dimensions (3) navigate through data to explore them. OLAP operators are well-defined for classic data. But they are inadequate when data are complex. The use of other techniques, for example data mining, may be promising. Combining data mining methods with OLAP tools is an interesting solution for enhancing the ability of OLAP to analyze complex objects. We have already suggested extending OLAP capabilities with complex object exploration and clustering [2, 3].
In this paper, we are concerned with the problem of the visualization of complex objects in an OLAP cube. By this means, we aim to define a new ap-proach to extending OLAP capabilities to complex objects. With the same idea of combining data mining and online analysis, some works suggest usingVisual Data Mining technology for visually and interactively exploring OLAP cubes. Maniatis et al. list possible representations for displaying a cube and offer the CPM model (Cube Presentation Model) as a model in an OLAP interface [11]. The CPM model borrows visualization tools from the field of the HMI (Human Machine Interface). Unfortunately, these works do not take complex objects into account. In a cube of complex objects, the facts are indeed complex objects, and the dimensions can include images, texts, descriptors, ... and OLAP measures are not necessarily numeric. Given these characteristics, standard visualization tools are not necessarily well-suited and should be adapted. To do this, we use Cor-respondance Analysis, a factor analysis method known in data mining, because it makes it possible to visualize complex objects while highlighting interesting facts for analysis [4, 13]. Correspondance Analysis represents objects by pro-jecting them on to factor axes. In a previous paper, we laid the foundations for this proposal [12]. In this paper, we complete and improve our first proposal by taking into account the measure to visualize complex objects, using indicators to make interpretation easier. We thus offer a comprehensive approach and a new OLAP operator entitled VOCoDa (Visualization Operator for Complex Data).
To illustrate our point of view, we complete the previously used case of re-searchers’ publications, presented in the next section. A publication can be seen
as a complex object, or as a semantic entity. We plan to analyze publications according to their authors, national or international range, support such as a conference or a journal, etc. We aim to observe the diversity of the themes in which researchers publish and the proximity of authors when they are working on the same themes. We need a number of OLAP operators which explore the semantic content of publications. We do not want to limit ourselves to classic on-line analysis, which provides arithmetic operators for aggregating numeric data. This paper is organized as follows. First, we present the running example of the analysis of scientific publications in a research laboratory. Then in section 3, we continue by positioning and presenting our approach. In section 4, we develop our approach through analysis of the publications. We end this paper with a conclusion focusing on certain future perspectives (section 5).
2 Running example
A scientific paper can be viewed as a complex object, and thus as a semantic unit. It consists of items such as the year, the support (the name of the journal or the conference) with a national or international range, and the document itself. The document contains the name of the authors, the title, a summary and the body/content of the paper. An author can be represented by his name, by his picture (image), as well as by other attributes such as his status (full professor, associate professor, PhD student,...). Here, we observe publications as complex objects. To handle these semantic entities, we therefore need an adapted modeling and analysis tool.
In addition to standard descriptors such as year, type, authors, number of pages, etc., the user may also want to analyze the semantic content of the pub-lication, i.e. the topics and content of the publication. The semantic content of the publication must be taken into account when modeling and carrying out an analysis. Let us suppose that the user wants to analyze publications according to the first author, support, year, content and topics of the paper.
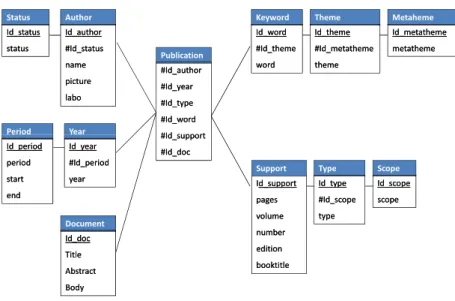
As we are in the context of data warehouses, the first step is to model publica-tions in a multi-dimensional manner. In a multidimensional model, we represent facts that are analyzed through measures, usually numerical, and dimensions representing analysis axes [10, 7]. These dimensions include descriptors of the facts, and can be grouped into hierarchies with different granularity levels. In our multidimensional modeling, the fact is the publication (cf. figure 1). We choose to observe it in relation to several dimensions: time, authors,support,keywords
of the publication anddocument. In thetime dimension, theyear represents the finest level. It can be grouped by period. The authors dimension contains two hierarchical levels that aggregateauthors according to theirstatus. The dimen-sion support provides the name of the conference or journal or book, as well as the volume, and number of pages. The type level aggregates support accord-ing to type (conference, journal, chapter, book, ...). Types of publication may be aggregated according to their national or international scope. The last two
dimensions are semantic dimensions with the keywords associated to the pub-lication and the document itself. Keywords can be grouped bythemes then by
metathemes (families of themes). Publications are written in English or French, but all keywords are in English. Thedocument dimension contains the title, the abstract and the body of the paper.
Another point of view is that the facts could also be Authors, analyzed ac-cording to their publications, status, etc.; in the same way, keywords could be the facts, analyzed according to authors, years, and so on. In multidimensional modeling, measures and dimensions are interchangeable [8].
In this model, there are therefore ”classic” dimensions with hierarchies, and semantic dimensions consisting of a hierarchy of concepts (keywords, themes and metathemes) and the document itself.
Fig. 1. Multidimensional modeling of publications
In multidimensional modeling of publications, difficulties are encountered when it comes to defining one or more numeric measures. In our model, the fact being observed was the publication and it was a combination of all dimensions without a measure. Generally, in case like this where there are no measures , the aggregation functionCOUNTcan be used to count the facts. This solution
is always possible in our case, but it is not sufficient because the analysis which follows is too poor.
In cases with no measure, we use the functionCOUNTto count publications, but we seek other means to analyze publications in order to discover thematic proximity, authors who work together,... We consider a publication as a complex object and we are looking for a way to make a semantic analysis. We propose a visualization of complex objects which takes the semantic content of objects into account. This explains our decision to use a factor analysis method for the visualization of complex objects. This new visualization method fits completely with the online analysis of complex objects.
3 Positioning and principle
Generally, OLAP interfaces represent a cube as a table, or cross-table (con-tingency table). In an attempt to exceed the limits of standard interfaces, more advanced tools offer visual alternatives to represent the information contained in a cube, and to interactively browse the cube. Among existing alternatives, there are hierarchical visualizations (trees of decomposition, ...), multi-scale views, in-teractive scatter plots, and so on. Vinnik et al. suggest an improved standard OLAP interface that gives users a dynamic decomposition of the cube with hi-erarchical visualization techniques [17].
For a better visualization of information, Sureauet al. suggest rearranging the modalities of a level according to heuristics, based on distance between the elements in a dimension or according to a genetic algorithm [16]. Genetic algo-rithms make it possible to modify the cube, thus maximizing evaluation viewing criteria. However, heuristic algorithms, are more competitive than genetic al-gorithms because they give a better ratio between improved visualization and computation time. In the future, authors hope to integrate all their reorgani-zation algorithms into their virtual reality platforms VRMiner for a complete OLAP environment.
With a statistical test, Ordonez and Chen searched within a cube (of low dimension) for neighboring cells with significantly different measures [15]. The average comparison test detected cells that had very different values while they were in the same area in the cube. Searching all cell pairs with different values is a highly combinatorial problem; the authors suggest limiting the search to a reduced, user-defined space. The approach is developed with a set of SQL queries that transform the search space into a lattice. The algorithm then goes through the lattice and for each candidate cell pair performs the statistical test. A GUI allows you to view the results.
The idea proposed in this paper is promising and shows the advantage of using data mining techniques to enrich the capacities of OLAP. However, using a parametric statistical test obliges the authors to make assumptions about the
data, such as for example that measure probability distribution which must fol-low normal distribution (a Gaussian distribution). Although the authors think that this assumption is low and generally true for the data they use, we think that it is not the case generally speaking. This theoretical assumption is a real limitation for using this approach. Furthermore, the proposed approach that highlights cells that differ greatly, is a more explanatory approach than the vi-sualization approach.
In the context of Web 2.0 and OLAP applications, Aouicheet al. are par-ticularly interested in tag clouds [1]. The principle of a tag cloud provides a visual representation of keywords on a Web site. Generally, words appear in a font size that is greater than that of the words used on the site. The keyword cloud can be viewed as a semantic abstract of the web site. Applied to OLAP, this principle can use a tag cloud to represent a cube where each keyword is a cell and where keyword size depends on the measured value of the fact (cell). This new cube representation makes it possible to use specific tag cloud oper-ations such as sorting keywords according to their size and removing keywords with small sizes. To assist the user in his exploration of the cube, Aouicheet al.
built classes of similar keywords and rearranged the attributes of the dimensions. In areas other than OLAP, many works focus on how to visualize complex data. Between data mining and information retrieval, Morin worked on graphic browsing in text documents [14]. After having cleaned the data (removing stop-words, extracting lemmas or keystop-words,...) a lexical table (crossing documents in rows and keywords in column) was analyzed and displayed with a factor corre-spondence analysis.
Compared with the other approaches presented, we suggest a visualization operator (1) in the context of online analysis (2) that requires no assumptions about the data (3) that is suitable for complex objects (4) and that takes into account the semantic content of the data. Works on OLAP visualization do not deal with complex objects (even if some might be adapted to such data) and do not take into account the semantic content (only tag clouds seem to do this).
To visualize complex objects, we propose an approach that uses Correspon-dance Analysis, a factor analysis method known in data mining [4, 13]. We use Correspondance Analysis because it makes it possible to visualize complex ob-jects while highlighting interesting facts for analysis. This factor method is best suited to the scatter or complex object cube. When facts are complex objects, often there is no measure in the classical sense of multi-dimensional modeling. However, it is always possible to count the facts. In this case, the complex ob-ject cube with several dimensions with the COUNT function can be seen as a contingency table. Correspondence analysis can be used to display the facts.
Correspondence analysis is a method for decomposing the overall Phi-square or Inertia (proportional to the Chi-square quantity) by identifying a small num-ber of axes in which the deviations from the expected values can be represented.
Correspondance analysis produces factor axes which can be used as new dimen-sions, called ”factor dimensions”. These new axes or dimensions constitute a new space in which it is possible to plot the facts i.e. complex objects. The first factor plane (the space defined by the first two factor axes) makes it possible to display the facts. Using correspondence analysis as the visualization operator is fully justified because this method has the same goal as OLAP navigation and exploration.
Our principle may be compared to the latent semantic analysis (LSA) tech-nique used in information retrieval [9]. Latent semantic analysis and correspon-dence analysis are two methods that seek to reduce the size of a space so as to highlight any links in the data. Correspondence analysis is preferred in our context because it provides more a synthetic graphic representation as well as indicators of the quality of the graphic representation.
4 Process
We provide OLAP users with a process composed of several steps: – building the complex object cube,
– constructing the contingency table, – completing the correspondence analysis, – mapping complex objects on the factorial axes.
Suppose that the user wants to study keywords in order to identify the ma-jor research fields in which researchers are working. In addition, the user would like to identify researchers working on the same keywords. To meet these user requirements, we must provide the user with a visualization of publications by author and keyword, while making it possible to navigate inside the data.
4.1 Notations
According to the notations proposed in [3], let C be a cube with a non-empty set of d dimensions D = {D1, ..., Di, ..., Dd} and m measures M = {M1, ..., Mq, ..., Mm}. Hi is the set of hierarchical levels of dimension Di. Hji is thejhierarchical level of dimensionDi. For example, the type of publication dimension D1 has two levels: the level Type denoted H1
1 and the level Scope
denoted H1 2. Aij = {aij 1, ..., a ij t, ..., a ij
l } is the set of the l members or modalities a ij t of the hierarchical level Hi
j of the dimension Di. The level Scope (H21) has two
members: International, denoteda12
1 andNational, denoteda122 .
A cell in the cubeC is full (or empty) if it contains at least one fact (or does not contain facts).
Generally, a cube can represent a set of facts, with values involved in the measureMqaccording to the membersAijof the dimensions{D1, ..., Di, ..., Dd} that characterize the facts to a given levelHi
4.2 Complex object cube
Depending on what the user wants to analyze, a cube is defined. This constructed cube is a sub-cube from the initial cubeC.
LetD′ be a non-empty sub-set ofDwithpdimensions{D1, ..., Dp}(D′⊆ D and p ≤ d). The p-tuple (Θ1, ..., Θp) is called a sub-cube according to D′ if ∀i∈ {1, ..., p},Θi ̸=∅ and if there is an uniquej≥1 such thatΘi ⊆ Aij.
A sub-cube, notedC′, corresponds to a portion from the initial cubeC. Of the dexisting dimensions, onlypare chosen. For each chosen dimensionDi∈ D′, a hierarchical levelHjiis selected and a non-empty sub-setΘiof members is taken from all the member set Aij of the level.
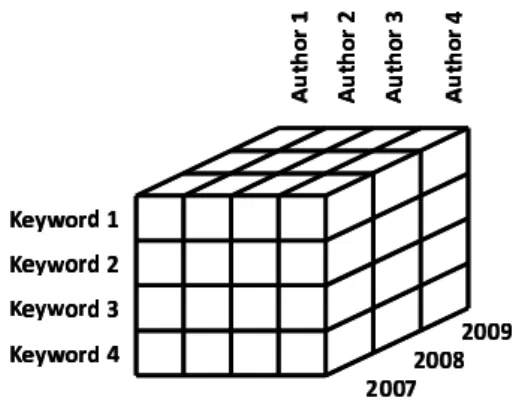
For example, the user can choose to work in the context of the publica-tions that were written between 2007 and 2009, by authors with the status of full professor. And in this context, the user can build, as in figure 2, a cube of publications based on keywords, year of publication and the name of the first author. In our example, the sub-cube is given by (Θ1, Θ2, Θ3, Θ4)= ({full
pro-fessor},{2007, 2008, 2009},{Keyword 1, Keyword 2, ..., Keyword 4},{Author 1, Author 2, ..., Author 4}). The measure Mq is the number of publications (Count).
Fig. 2.Cube of publications
4.3 Contingency table
Classically, correspondence analysis takes as input a contingency table. In our approach to online analysis of complex objects, the idea is to use traditional OLAP operators to build this contingency table.
In the sub-cubeC′, the user chooses two levels (that is to say, he chooses one level for two different dimensionsiandi′), on which he wants to visualize com-plex objects. Let Θi (respectivelyΘi′) be the set ofl (respectively l′) members chosen for the level of the dimensioni(respectivelyi′). The contingency tableT haslrows andl′columns the titles of which are given by{a1ij, ..., aijt, ..., aijl }and {ai1′j′, ..., ait′′j′, ..., ai
′j′
l′ }. At each intersection of rowtand columnt′, are counted the facts having the membersaijt andait′′j′.
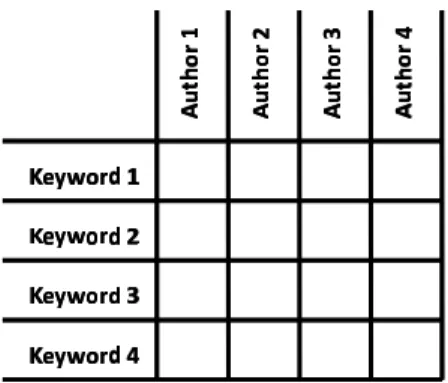
In our example, the contingency table crosses all the keywords with all the authors in the sub-cube. This consists in counting facts covering 3 years by doing a roll-up of the dimensionyear. This gives us a cross table with keywords in rows and authors in columns (figure 3). At the intersection of a row and a column, we have the number of publications written by an author for a given keyword. This table is ready to be processed by a correspondence analysis.
If the measure used is other than a simple count, and if it is a numerical measure, additive and with only positive values, then it is possible to use it to weigh the facts in the contingency table. The user is given the choice of using this measure as weighting or not.
Fig. 3.Contingency table
4.4 Correspondence analysis
Processing a correspondence analysis consists in projecting data on to synthetic axes so that much information is expressed by a minimum number of axes. The goal is to reduce the size of the representation space, that is to say, to reduce the number of rows and columns. Rows and columns have similar roles. The correspondence analysis makes possible simultaneous visualization of the projections of rows and columns in the same plane. The proximities between rows and columns can be interpreted.
In practice, the method starts by calculating the eigen values from which are deduced eigen vectors that define the factor axes. As the first two axes contain the most information, they define the first factor plane. Once row points and column points have been projected on to axes, auxiliary statistics are reported to help evaluate the quality of the axes and their interpretation. For each point, the most important statistics are the weight, the relative contribution of the point to the axis’ inertia and the quality of the representation on the axis (given by the cosine2). To give an interpretation of an axis and analyze proximity
between points on an axis, only points which contribute strongly to the inertia of the axis (whose contribution is three times the average contribution) and which are well represented by the axis (whose cosine2 is higher than 0.5) are taken into account.
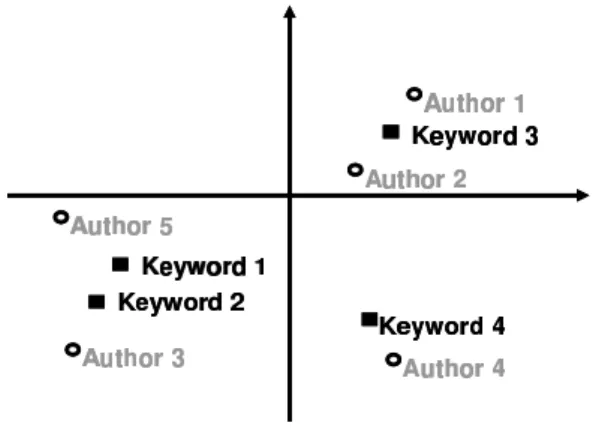
In our example, publications are represented by keywords and by authors; thanks to the correspondence analysis, identifying associations between authors and keywords will be possible. Figure 4 is a very short illustration of a possible result: keyword 1 and 2 are very close, suggesting that relevant publications were written by authors working on the same topics. However, keywords 3 and 4 are far apart and therefore appear to fall under two different research fields. The position of the authors makes it possible to have an overview of the search fields in which they work. For example, authors 3 and 5 seem to work in the same fields, while they are opposed to authors 1 and 2, who themselves are opposed to author 4. We thus get a graphic summary of what authors work on, and with whom.
4.5 Visualization
The first two factor axes are retained as new factor dimensions, because the coordinates in the projected objects give their position on these new axes. They can be seen as members of dimensions. As explained above, it is possible to in-terpret the factor dimensions.
Once the graph has been constructed (cf figure 5), an interactive tool gives, for each point, i.e. keyword or author, its statistic indicators (relative contri-bution and cosine2). Keywords and authors that have high indicators are
rep-resented in a different color. Thus, the user sees the most relevant points for analysis. Factor analysis provides automatic help in understanding and to ana-lyzing information. For example, the user can easily identify the most charac-teristic keywords, authors who work together or who do not work together and finally groups of authors working on certain keywords. In addition, if the user so requests, a photograph of the authors can replace their name. In an OLAP framework, it is efficient to use the most significant descriptors of dimensions in order to enhance the readability of the results obtained.
Furthermore, according to the OLAP principle, it is also possible on each point to perform a drill-down to see related publications (represented by their title). The user has another possibility of projecting a hierarchical level of an-other dimension into the graph. The members of this new level will be projected as points in factor space but they have not been involved in the construction of the axes. To maintain statistical consistency, only hierarchical levels whose dimensions are not in the sub-cube can be used as additional elements. A level of a dimension already used would be dependent on another level. In our ex-ample, the user could use as an additional element type of publication (journal, conference, technical report ...).
Fig.
5.
Visualization
of
4.6 Implementation
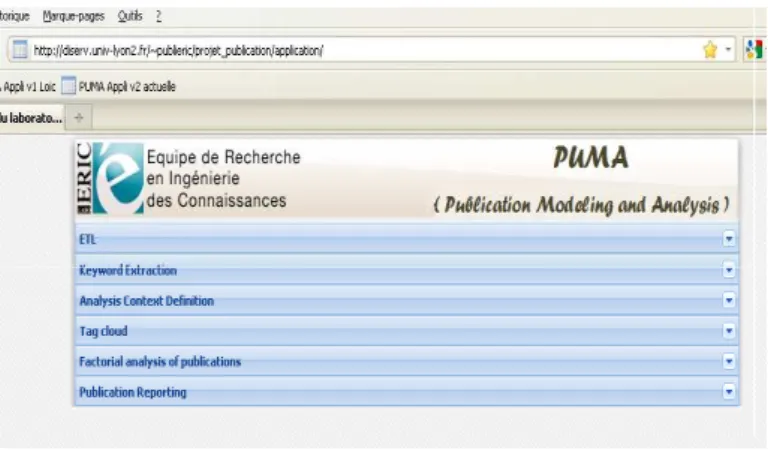
To validate our approach, we have developed a software platform namedPUMA
(PUblication Modeling and Analysis). This prototype affords to feed the data warehouse with the publications, to build the complex object cube and to make an online analysis of publications.
PUMAis a Web 2.0 Open Source application developing inPHP; the data warehouse is built withMySQL. The application also uses the software R with its package FactoMineR. It is designed as a three-third architecture with a figuration interface, an application server and a database server. From the con-figuration interface, the user feeds the data warehouse, defines the context of analysis by building a cube and parameters analysis he wishes to achieve. From a technical point of view, the graphic interface is managed by an ExtJS frame-work and with anAjax support. From a user point of view, the application looks like an accordion that has to be deployed step by step: cube construction, cor-respondence analysis process, publication visualization and reporting (cf figure 6).
Fig. 6. PUMA application (PUblication Modeling and Analysis)
5 Conclusion
In this paper, we have developed an approach to online analysis for complex objects. Our approach has demonstrated the feasibility of using correspondence
analysis to make it possible to visualize complex objects online. Our visualiza-tion operator takes into account the semantic content of complex objects. Our approach of displaying complex objects naturally takes its place in the online analysis. The publications case study illustrates our approach. Producing a soft-ware platform has allowed us to validate it.
In the multi-dimensional model, publications are described by keywords. Rather than asking authors to assign keywords themselves manually to their publication or rather than using an ontology, we think that it would be more relevant to automatically extract the keywords from the title, summary, or text (body) of the publication. Indeed, if the keywords were automatically extracted, they would capture some of the semantics contained in the document. Using in-formation retrieval (IR) principles, keywords could be extracted automatically. Furthermore, as publications contain documents and documents contain text, our idea is to use certain information retrieval (IR) techniques in order to model publications. The use of IR techniques can allow us to extract semantics from the text and this semantic information may be very helpful for modeling publica-tions in a multi-dimensional manner. In addition to combining OLAP and data mining, the coupling of OLAP and IR should further enhance online analysis.
References
1. K. Aouiche, D. Lemire and R. Godin. Web 2.0 OLAP: From Data Cubes to Tag Clouds. Proceedings of the 4thInternational Conference on Web Information
Sys-tems and Technologies (WEBIST 08). 2008, 5–12.
2. R. BenMessaoud, O. Boussaid, S. Loudcher-Rabaseda. A Data Mining-Based OLAP Aggregation of Complex Data: Application on XML Documents. International Jour-nal of Data Warehousing and Mining. 2 (4), 2006, 1–26.
3. R. BenMessaoud, O. Boussaid, S. Loudcher-Rabaseda. A multiple correspondence analysis to organize data cubes. Databases and InformationSystems IV - Frontiers in Artificial Intelligence and Applications. 155(1), 2007, 133–146.
4. J.P. Benzecri. Correspondence Analysis Handbook. Marcel Dekker, hardcover edi-tion, 1992.
5. D. Boukraa, O. Boussaid, F. Bentayeb, S. Loudcher. OLAP Operators For A Com-plex Object-Based Multidimensional Model. International Journal of Data Mining and Business Intelligence (DMBI). 2010. 34–46.
6. D. Boukra, R. Ben Messaoud, O. Boussaid. Modeling XML warehouses for complex data: the new issues. Open and Novel Issues in XML Database Applications: Future Directions and Advanced Technologies. 2009, 287–307.
7. S. Chaudhuri, U. Dayal. An overview of data warehousing and OLAP technology. SIGMOD Record, 26(1), 1997, 65-74.
8. E.F. Codd and S.B. Codd and C.T. Salley. Providing OLAP (On-line Analytical Processing) to User-Analysts: An IT Mandate. Hyperion Solutions Corporation. 1993.
9. S. Deerwester, S. Dumais, G.W. Furnas, T.K. Landauer, R. Harshman. Indexing by Latent Semantic Analysis. Journal of the Society for Information Science. 41(6), 1990, 391–407.
10. R. Kimball. The Data Warehouse Toolkit. John Wiley & Sons. 1996.
11. A. S. Maniatis, P. Vassiliadis, S. Skiadopoulos, Y. Vassiliou. Advanced visual-ization for OLAP. Proceedings of the 6th ACM International Workshop on Data
Warehousing and OLAP (DOLAP’2003). 2003,9–16.
12. L. Mabit, S. Loudcher, O. Boussaid. Analyse en ligne d’objets complexes avec l’analyse factorielle. 10me Confrence d’Extraction et Gestion des Connaissances (EGC 2010). 2010, 381–386.
13. M. Greenacre. Correspondence Analysis in Practice. Chapman Hall CRC, Second Edition. 2007.
14. A. Morin. Intensive use of correspondance analysis for information retrieval. Pro-ceedings of the 26thInternational Conference on Information Technology Interface (ITI 2004). 2004, 1–4.
15. C. Ordonez, Z. Chen. Exploration and Visualization of OLAP Cubes with Sta-tistical Tests. Proceedings of the 15th ACM SIGKDD International Conference on
Knowledge Discovery and Data Mining. Workshop on Visual Analytics and Knowl-edge Discovery. 2009,46–55.
16. F. Sureau, F. Bouali, G. Venturini. Optimisation heuristique et gntique de visual-isations 2D et 3D dans OLAP : premiers rsultats. 5mes Journes francophones sur les Entrepts de Donnes et l’Analyse en ligne (EDA 09). 2009, 62–75.
17. S. Vinnik, F. Mansmann. From analysis to interactive exploration: Building visual hierarchies from OLAP cubes. Proceedings of the 14thInternational Conference on