This is an
Accepted Manuscript
, which has been through the
Royal Society of Chemistry peer review process and has been
accepted for publication.
Accepted Manuscripts
are published online shortly after
acceptance, before technical editing, formatting and proof reading.
Using this free service, authors can make their results available
to the community, in citable form, before we publish the edited
article. We will replace this
Accepted Manuscript
with the edited
and formatted
Advance Article
as soon as it is available.
You can find more information about
Accepted Manuscripts
in the
Information for Authors
.
Please note that technical editing may introduce minor changes
to the text and/or graphics, which may alter content. The journal’s
standard
Terms & Conditions
and the
Ethical guidelines
still
apply. In no event shall the Royal Society of Chemistry be held
responsible for any errors or omissions in this
Accepted Manuscript
or any consequences arising from the use of any information it
contains.
Accepted Manuscript
Journal of
Materials Chemistry A
Graphical Abstract
A simple and template-free coprecipitation method using Na2O2 aqueous solution as the OH
-source has been developed to synthesize coral-like mesoporous NiO nanobar precursors, which were then transformed to NiO by a simple calcination procedure. The fabricated NiO nanomaterials have a relatively high specific surface area and porous structure, making them ideal candidates for pseudocapacitor applications. The pseudocapacitive properties of the as-prepared NiO electrodes have been examined by cyclic voltammetry (CV), cyclic
chronopotentiometry (CP) and electrochemical impedance spectroscopy (EIS) in 6.0 M KOH solution. A high specific capacitance (SC) of 1085 F g-1 with an excellent energy density of 30.52 Wh kg-1 could be obtained at a discharge current density of 1 A g-1. And the as-prepared NiO electrode also exhibits good long-term cycling stability at a high current density of 5 A g-1.
Page 1 of 9
Journal of Materials Chemistry A
J
o
u
rn
a
l
o
f
M
a
te
ri
a
ls
C
h
e
m
is
tr
y
A
A
c
c
e
p
te
d
M
a
n
u
s
c
ri
p
t
Journal of
Materials Chemistry A
Cite this: DOI: 10.1039/c0xx00000x
www.rsc.org/xxxxxx
Dynamic Article Links
►
ARTICLE TYPE
This journal is © The Royal Society of Chemistry [year] [journal], [year], [vol], 00–00 | 1
Coprecipitation fabrication and electrochemical performances
of coral-like mesoporous NiO nanobars
Jing Li
a, Fulian Luo
a, Qian Zhao
a, Zhanpeng Li
a, Hongyan Yuan
b, Dan Xiao
a,b*
Received (in XXX, XXX) Xth XXXXXXXXX 20XX, Accepted Xth XXXXXXXXX 20XX
5
DOI: 10.1039/b000000x
A simple and template-free coprecipitation method using Na2O2 aqueous solution as the OH- source has been developed to synthesize
coral-like mesoporous NiO nanobar precursors, which were then transformed to NiO by a simple calcination procedure. The fabricated NiO nanomaterials have a relatively high specific surface area and porous structure, making them ideal candidates for pseudocapacitor applications. The pseudocapacitive properties of the as-prepared NiO electrodes have been examined by cyclic voltammetry (CV), cyclic
10
chronopotentiometry (CP) and electrochemical impedance spectroscopy (EIS) in 6.0 M KOH solution. A high specific capacitance (SC) of 1085 F g-1 with an excellent energy density of 30.52 Wh kg-1 could be obtained at a discharge current density of 1 A g-1. And the as-prepared NiO electrode also exhibits good long-term cycling stability at a high current density of 5 A g-1.
15
1.
Introduction
Electrochemical capacitors (ECs) are now attracting intensive attentions for their ability to provide energy density greater than
20
conventional capacitors by orders of magnitude, and higher power density and longer cycle life than batteries by means of high-surface-area electrodes and fast surface-charge-storage processes1, 2. Generally, carbon materials, conducting polymers and metal oxides/hydroxides as the three main kinds of materials,
25
have been independently or collaboratively adopted in the carbon-based electrochemical double-layer capacitors (EDLCs)3, 4, polymer- and transition metal oxide/hydroxide-based pseudocapacitors5, 6, or hybrid supercapacitors2, 7, 8. Comparatively speaking, pseudocapacitors based on transition
30
metal oxides/hydroxides show remarkably larger capacitance than the EDLCs. Hence, much effort has been exerted to develop various transition metal oxides or hydroxides for the electrode materials of pseudocapacitors.
Among the various transition metal oxides, NiO has received
35
great attention due to its high theoretical specific capacitance (~2584 F g-1 within 0.5 V), high chemical and thermal stability, low cost and well defined redox behavior9, 10. It is well known
that the electron and ion transport efficiency for charge storage in the NiO-based pseudocapacitors mainly depends on the electrode
40
properties such as morphology, surface area and pore size distribution and so on. To date, various strategies have been formulated to prepare various NiO based electrodes with different capacitive performance including NiO hexagon plates (~72.2 F g
-1
)11, nanoporous pine-cone structured NiO powder (~337 F g-1)12,
45
flowerlike NiO hollow nanosphere (~770 F g-1)13, hierarchical NiO nanosheet hollow spheres (~866 F g-1)14, monolithic NiO/Ni nanocomposites (~910 F g-1)15 and mesoporous nanoball-like NiOx (~951 F g
-1
)16. However, all the values of the specific capacitance reported for the NiO based pseudocapacitors are
50
found to be much less than the theoretical values. And these synthetic methods mainly depending on molten-salt synthesis, hydrothermal method, electrochemical deposition or microwave-assisted synthesis, do not apply to large-scale production for their high cost and complex procedures.
55
In contrast, precipitation methods usually involve simple processes and are easy to control. Here, we report a facile and large-scale production coprecipitation to synthesize the coral-like NiO precursors using Na2O2 aqueous solution as the OH- source.
Then the NiO nanomaterials, which present the similar
60
morphology with plenty of mesoporous could be obtained by a simply annealing treatment of the precursors at 250 ˚C for 3 h. The prepared NiO nanomaterials have a relatively high specific surface area and porous structure, constituting ideal pseudocapacitive properties. It was found that an electrode based
65
on NiO nanomaterials in alkaline electrolyte could display excellent specific capacitance of 700 F g-1 at the discharge current density of 5 A g-1 and still maintained 92.7% of its maximum specific capacitance after 2000 charging-discharging cycles.
70
2. Experimental
2.1. Preparation of coral-like NiO
Analytical grade nickel nitrate hexahydrate (Ni(NO3)2·6H2O) and
Page 2 of 9
Journal of Materials Chemistry A
J
o
u
rn
a
l
o
f
M
a
te
ri
a
ls
C
h
e
m
is
tr
y
A
A
c
c
e
p
te
d
M
a
n
u
s
c
ri
p
t
2 | Journal Name, [year], [vol], 00–00 This journal is © The Royal Society of Chemistry [year]
sodium peroxide (Na2O2) were used as received without further
purification. Triply distilled water was used during all the experimental processes. Typically, 50 mL 0.15 M Ni(NO3)2
aqueous solution was rapidly poured to the equal volume of 0.4 M Na2O2 aqueous solution. Then the reaction was continued for 1
5
h without stirring at room temperature, followed by ageing in the mother liquor overnight. After that, the apple green precipitates could be obtained by centrifugation at 10 000 rpm with repeated washing with deionized water and absolute ethanol several times, respectively. The apple green materials were dried in a vacuum at
10
60 ˚C overnight and then calcinated in air at 250 ˚C for 3 h to obtain the final product.
2.2. Characterization
Thermogravimetric (TG) and differential thermal analysis (DTA)
15
were performed on a Henven HCT-2 thermal analyzer (Beijing, China) with a heating rate of 2 ˚C min-1
from room temperature to 800 ˚C under a stream of air. The crystal structures of the β-Ni(OH)2 and NiO nanomaterials were analyzed by a Tongda
TD-3500 X-ray powder diffractometer (Dandong Fangyuan
20
Instrument Co., Liaoning, China) with Cu-K α radiation ( λ = 0.15418 nm) operating at 30.0 kV and 20.0 mA. Fourier transform infrared spectra (FTIR) were recorded on a Thermo Scientific Nicolet 6700 FT-IR spectrometer (Sugar Land, TX, USA) with the KBr pellet technique in the range of 4000-400 cm
-25
1
. Field emission scanning electron microscopy (FESEM) images were acquired from a Hitachi S4800 scanning electron microscopy (Tokyo, Japan). The transmission electron microscope (TEM) images and the corresponding selected area electron diffraction (SAED) patterns were captured at room
30
temperature on a FEI Tecnai G2 F20 S-Twin transmission electron microscope at an acceleration voltage of 200.0 kV (Hillsboro, OR, USA).The X-ray photoelectron spectra (XPS) were obtained on a Kratos XSAM 800 spectrometer (Manchester, U.K.) with a Al-Kα X-ray (1486.6 eV) excitation source running at 15 kV, a
hemi-35
spherical electron energy analyzer and a multichannel detector. Nitrogen adsorption and desorption experiment was carried out at 77.3 K using Brunauer-Emmett-Teller (BET) gas adsorption method on a Quadrasorb Nava 4000 Automated Surface Area and Pore Size Analyzer (Quantachrome, Instruments, Boynton Beach,
40
FL, USA).
2.3. Preparation of electrode and electrochemical measurement
To evaluate the electrochemical performance of the as-prepared materials, working electrode was prepared as follows. Briefly, the
45
NiO active material, acetylene black as the conducting material and polyvinylidene fluoride (PVDF) as the binder were mixed in a mass ratio of 80 : 15 : 5 and the N-methyl-2-pyrrolidone (NMP) was added to form a slurry. The slurry was then coated onto the nickel foam substrate (surface, 1cm × 1cm) with a spatula,
50
followed by pressing under a pressure of 10 MPa. The NiO-coated nickel electrode was drying at 60 ˚C for 12 h in a vacuum oven.
All electrochemical measurements were performed on an Autolab PGSTAT 128N electrochemical workstation (Eco
55
Chemie B.V., Amsterdam, the Netherlands) using the traditional three-electrode system with the Ni foam coated with NiO electroactive materials as the working electrode, a Hg/HgO
reference electrode and a graphite sheet (2 cm × 2 cm) counter electrode. The weight of the NiO electroactive materials loaded
60
on the working electrode was approximately to be 3.5-5.7 mg. The electrochemical characteristics of the as-prepared NiO nanomaterials were measured by cyclic voltammetry (CV) and electrochemical impedance spectroscopy (EIS) in 6.0 M KOH solution at room temperature. The CV scans were done in a
65
potential window from 0.1 to 0.6 V (vs. Hg/HgO). EIS measurements of the working electrode were carried out in a frequency range 10 kHz – 10 mHz at open circuit potential with an ac perturbation of 10 mV. The electrochemical capacitance of the coral-like NiO was also characterized with cyclic
70
chronopotentiometry (CP) measurements. All of the electrochemical measurements were conducted at room temperature.
75
3.
Results and discussion
3.1 Characterization of coral-like NiO and its precursor
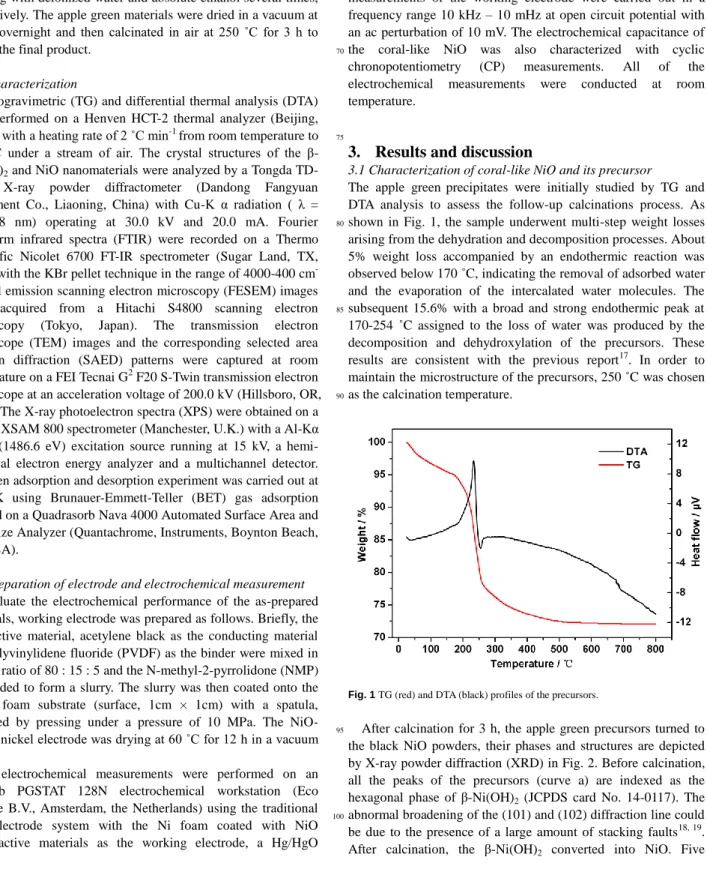
The apple greenprecipitates were initially studied by TG and DTA analysis to assess the follow-up calcinations process. As shown in Fig. 1, the sample underwent multi-step weight losses
80
arising from the dehydration and decomposition processes. About 5% weight loss accompanied by an endothermic reaction was observed below 170 ˚C, indicating the removal of adsorbed water and the evaporation of the intercalated water molecules. The subsequent 15.6% with a broad and strong endothermic peak at
85
170-254 ˚C assigned to the loss of water was produced by the decomposition and dehydroxylation of the precursors. These results are consistent with the previous report17. In order to
maintain the microstructure of the precursors, 250 ˚C was chosen as the calcination temperature.
90
Fig. 1TG (red) and DTA (black) profiles of the precursors.
After calcination for 3 h, the apple green precursors turned to
95
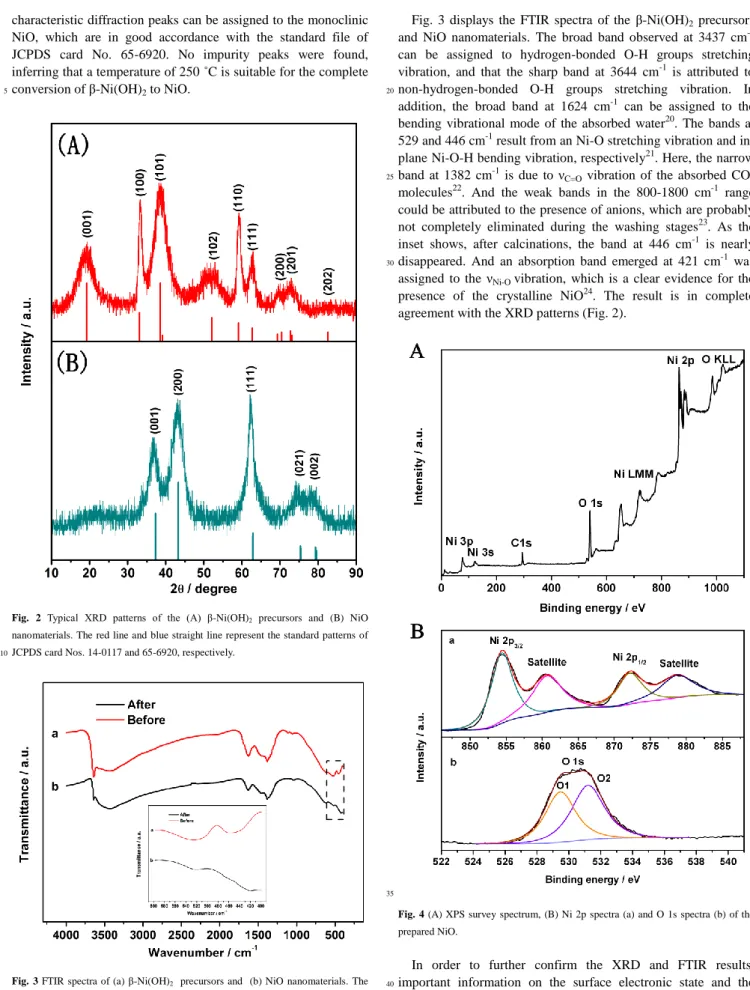
the black NiO powders, their phases and structures are depicted by X-ray powder diffraction (XRD) in Fig. 2. Before calcination, all the peaks of the precursors (curve a) are indexed as the hexagonal phase of β-Ni(OH)2 (JCPDS card No. 14-0117). The
abnormal broadening of the (101) and (102) diffraction line could
100
be due to the presence of a large amount of stacking faults18, 19. After calcination, the β-Ni(OH)2 converted into NiO. Five
Page 3 of 9
Journal of Materials Chemistry A
J
o
u
rn
a
l
o
f
M
a
te
ri
a
ls
C
h
e
m
is
tr
y
A
A
c
c
e
p
te
d
M
a
n
u
s
c
ri
p
t
This journal is © The Royal Society of Chemistry [year] Journal Name, [year], [vol], 00–00 | 3
characteristic diffraction peaks can be assigned to the monoclinic NiO, which are in good accordance with the standard file of JCPDS card No. 65-6920. No impurity peaks were found, inferring that a temperature of 250 ˚C is suitable for the complete conversion of β-Ni(OH)2 to NiO.
5
Fig. 2 Typical XRD patterns of the (A) β-Ni(OH)2 precursors and (B) NiO
nanomaterials. The red line and blue straight line represent the standard patterns of JCPDS card Nos. 14-0117 and 65-6920, respectively.
10
Fig. 3 FTIR spectra of (a) β-Ni(OH)2 precursors and (b) NiO nanomaterials. The
inset is the enlarge view of the spectra in the range of 600-400 cm-1 corresponding to
the dashed box.
15
Fig. 3 displays the FTIR spectra of the β-Ni(OH)2 precursors
and NiO nanomaterials. The broad band observed at 3437 cm-1 can be assigned to hydrogen-bonded O-H groups stretching vibration, and that the sharp band at 3644 cm-1 is attributed to non-hydrogen-bonded O-H groups stretching vibration. In
20
addition, the broad band at 1624 cm-1 can be assigned to the
bending vibrational mode of the absorbed water20. The bands at
529 and 446 cm-1 result from an Ni-O stretching vibration and in-plane Ni-O-H bending vibration, respectively21. Here, the narrow band at 1382 cm-1 is due to νC=O vibration of the absorbed CO2
25
molecules22. And the weak bands in the 800-1800 cm-1 range could be attributed to the presence of anions, which are probably not completely eliminated during the washing stages23. As the inset shows, after calcinations, the band at 446 cm-1 is nearly disappeared. And an absorption band emerged at 421 cm-1 was
30
assigned to the νNi-O vibration, which is a clear evidence for the
presence of the crystalline NiO24. The result is in complete agreement with the XRD patterns (Fig. 2).
35
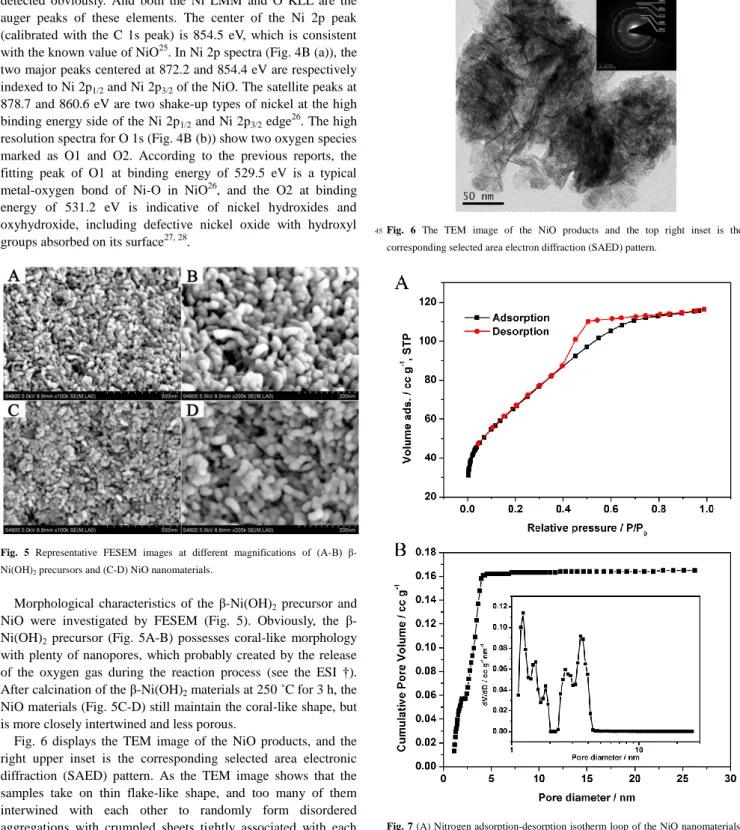
Fig. 4 (A) XPS survey spectrum, (B) Ni 2p spectra (a) and O 1s spectra (b) of the prepared NiO.
In order to further confirm the XRD and FTIR results, important information on the surface electronic state and the
40
oxidation state of our prepared NiO, XPS measurement was performed. Fig. 4A shows that only the Ni and O element can be
J
o
u
rn
a
l
o
f
M
a
te
ri
a
ls
C
h
e
m
is
tr
y
A
A
c
c
e
p
te
d
M
a
n
u
s
c
ri
p
t
4 | Journal Name, [year], [vol], 00–00 This journal is © The Royal Society of Chemistry [year]
detected obviously. And both the Ni LMM and O KLL are the auger peaks of these elements. The center of the Ni 2p peak (calibrated with the C 1s peak) is 854.5 eV, which is consistent with the known value of NiO25. In Ni 2p spectra (Fig. 4B (a)), the two major peaks centered at 872.2 and 854.4 eV are respectively
5
indexed to Ni 2p1/2 and Ni 2p3/2 of the NiO. The satellite peaks at
878.7 and 860.6 eV are two shake-up types of nickel at the high binding energy side of the Ni 2p1/2 and Ni 2p3/2 edge26. The high
resolution spectra for O 1s (Fig. 4B (b)) show two oxygen species marked as O1 and O2. According to the previous reports, the
10
fitting peak of O1 at binding energy of 529.5 eV is a typical metal-oxygen bond of Ni-O in NiO26, and the O2 at binding energy of 531.2 eV is indicative of nickel hydroxides and oxyhydroxide, including defective nickel oxide with hydroxyl groups absorbed on its surface27, 28.
15
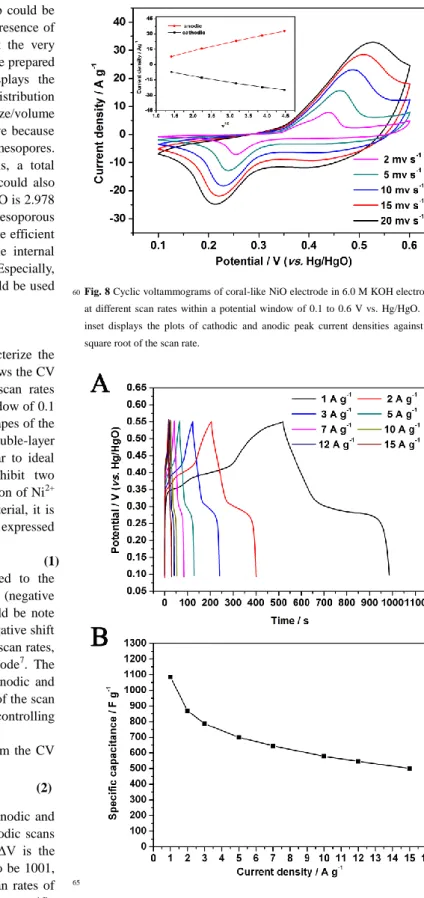
Fig. 5 Representative FESEM images at different magnifications of (A-B) β-Ni(OH)2 precursors and (C-D) NiO nanomaterials.
20
Morphological characteristics of the β-Ni(OH)2 precursor and
NiO were investigated by FESEM (Fig. 5). Obviously, the β-Ni(OH)2 precursor (Fig. 5A-B) possesses coral-like morphology
with plenty of nanopores, which probably created by the release of the oxygen gas during the reaction process (see the ESI †).
25
After calcination of the β-Ni(OH)2 materials at 250 ˚C for 3 h, the
NiO materials (Fig. 5C-D) still maintain the coral-like shape, but is more closely intertwined and less porous.
Fig. 6 displays the TEM image of the NiO products, and the right upper inset is the corresponding selected area electronic
30
diffraction (SAED) pattern. As the TEM image shows that the samples take on thin flake-like shape, and too many of them interwined with each other to randomly form disordered aggregations with crumpled sheets tightly associated with each other. Furthermore, the corresponding SAED pattern shows a set
35
of concentric discontinuous diffraction rings consisting of discrete diffraction dots indicating that the nanoflakes possess single-crystal nature. And the formative rings can be indexed to monoclinic NiO, which corresponds with the XRD results (Fig. 2). Based on these, we could speculate that the nanobars we have
40
observed in Fig. 5 probably are constructed with numerous of nanoflakes29.
Fig. 6 The TEM image of the NiO products and the top right inset is the
45
corresponding selected area electron diffraction (SAED) pattern.
Fig. 7 (A) Nitrogen adsorption-desorption isotherm loop of the NiO nanomaterials. (B) Cumulative pore volume and (inset) the corresponding pore-size distribution
50
(calculated by using a slit/cylindrical NLDFT model).
The surface and pore-size characterization of the prepared NiO was performed by nitrogen (77.3 K) adsorption and desorption experiment with advanced methods based on the nonlocal density
55
functional theory (NLDFT). As shown in Fig. 7A, the adsorption-desorption isotherm can be identified as type IV with a H2 hysteresis loop according to the International Union of Pure and Applied Chemistry (IUPAC) classification, which is characteristic
Page 5 of 9
Journal of Materials Chemistry A
J
o
u
rn
a
l
o
f
M
a
te
ri
a
ls
C
h
e
m
is
tr
y
A
A
c
c
e
p
te
d
M
a
n
u
s
c
ri
p
t
This journal is © The Royal Society of Chemistry [year] Journal Name, [year], [vol], 00–00 | 5
of mesoporous materials30. An obvious hysteresis loop could be observed in the range of 0.4-0.9 P/P0, indicating the presence of
mesoporous31. And there is a steep uptake of N2 at the very
beginning of measurement (P/P0 <0.02) suggests that the prepared
NiO sample also has micropores32. Figure 7B displays the
5
corresponding cumulative pore volume and pore size distribution by applying the NLDFT kernel. The obtained pore-size/volume distribution indicates that this NiO sample is distinctive because of the existence of the well-defined micro- and mesopores. According to Brunauer-Emmett-Teller (BET) analysis, a total
10
specific surface area of 241.8 m2g-1 is obtained. We could also calculate that the average pore diameter of prepared NiO is 2.978 nm. The relatively high BET surface area and mesoporous structure of the prepared nanomaterials can facilitate the efficient transport and migration of the electrolyte ions to the internal
15
active material during the charge-discharge process7. Especially, the relatively small amount of the micropores also could be used for charge accommodation33.
3.2. Electrochemical behaviors of the coral-like NiO
20
CV is usually considered as a suitable tool to characterize the capacitive behavior of an electrode material. Fig. 8 shows the CV curves of the coral-like NiO electrode at different scan rates ranging from 2.0 to 20 mV s-1 within the potential window of 0.1 to 0.6 V (vs. Hg/HgO) in 6.0 M KOH solution. The shapes of the
25
CV curves are well distinguished from the electric double-layer capacitance, in which case the shape is normally near to ideal rectangular shape. And all of the CV curves exhibit two significant redox peaks, which correspond to the reaction of Ni2+ to Ni3+ occurs at the surface of the NiO electrode material, it is
30
well accepted that the surface Faradaic reaction can be expressed as follows6, 34:
NiIIO+OH-↔NiIIIOOH+H2O+e
(1)
The anodic peak (positive current density) is related to the oxidation of NiO to NiOOH and the cathodic peak (negative
35
current density) is due to the reverse process. It should be note that a slight positive shift of the anodic peaks and a negative shift of cathodic peaks can be observed with the increase of scan rates, which mainly attribute to the resistance of the electrode7. The inset of Fig. 8 reveals a good linear relationship of anodic and
40
cathodic peak current densities against the square root of the scan rate, indicating that the diffusion of OH- is the rate controlling
process16.
The specific capacitance (SC) can be calculated from the CV curves according to the following equation35:
45
(2) where C is the SC (F g-1), qa and qc are the sums of anodic and
cathodic voltammetric charges on the anodic and cathodic scans (C), m is the mass of the active material (g) and V is the potential range of CV (V). The SCs were calculated to be 1001,
50
872, 742, 663 and 605 F g-1, corresponding to the scan rates of 2.0, 5.0, 10, 15 and 20 mV s-1, respectively. The specific capacitance decreases gradually with the scan rate increasing, which can be attributed to the electrolytic ions diffusing and migrating into the active materials at low scan rates. At high scan
55
rates, the diffusion effect, limiting the migration of the electrolytic ions limited, and then causes some active surface areas to become inaccessible for the charge storage36.
Fig. 8 Cyclic voltammograms of coral-like NiO electrode in 6.0 M KOH electrolyte
60
at different scan rates within a potential window of 0.1 to 0.6 V vs. Hg/HgO. The inset displays the plots of cathodic and anodic peak current densities against the square root of the scan rate.
65
Fig. 9 (A) The charge-discharge curves of the coral-like NiO electrode in the potential range from 0.1 to 0.55 V at different current densities. (B) The corresponding specific capacitances at various current densities.
Fig. 9A shows the charge-discharge curves of the NiO
70
electrode at different current densities between 0.1 and 0.55 V. The shapes of the charge-discharge curves show mainly the
J
o
u
rn
a
l
o
f
M
a
te
ri
a
ls
C
h
e
m
is
tr
y
A
A
c
c
e
p
te
d
M
a
n
u
s
c
ri
p
t
6 | Journal Name, [year], [vol], 00–00 This journal is © The Royal Society of Chemistry [year]
characteristic of pseudocapacitor, rather than the double-layer capacitance, which are in agreement with the the CV tests37. The specific capacitance (SC) could be calculated from the cyclic chronopotentiometric curves based on the following equations37:
(3)
5
where the Csp, I, t, m, and V are successively the SC (F g-1),
charge or discharge current (A), the time for discharge duration (s), the weight of the active material (g), and the voltage range for a full charge or discharge (V). Fig. 9B displays the corresponding SC of the NiO-modified electrode at different current densities. A
10
maximum SC of 1085 F g-1 is obtained at a current density of 1.0 A g-1. When the current density increases to 5 A g-1, the SC remains to be 700 F g-1. The reduction in capacitance must be caused by the large voltage drop, which is produced with the discharge current increase. Even so, the SC at 5 A g-1 is still about
15
64.5% of that at the discharge current of 1 A g-1. The high SC can mainly be attributed to the high surface area and the porous nanostructure, which could provide effective diffusion channels for the electrolyte ions13.
20
Fig. 10 Ragone plots of energy density vs. power density for coral-like NiO electrode.
Power density and energy density are two important factors
25
that influence the electrochemical property of the supercapacitor electrode. Using the galvanostatic charge-discharge curves, the energy density (E) and power density (P) could be calculated according to the equation (4) and (5) as follows38:
(4)
30
and
(5)
where the E,Csp, V, t and P are indicating of the energy
density (Wh kg-1), SC (F g-1), potential window of discharge (V), time of discharge (s) and power density (W kg-1), respectively.
35
The Ragone plots (the energy density as a function of power density) is shown in Fig. 10. As shown that the energy density decreased from 30.52 Wh kg-1 to 14.06 Wh kg-1 and the power density increased from 230 W kg-1 to 3380 W kg-1 respectively, as the discharge current density increased from 1 A g-1 to 15 A g-1. It
40
shows that the NiO electrode has met the requirements of Ni-MH, Ni-Cd and Pb-acid based batteries39. Even now it could not be used as an actual supercapacitor, more studies may be performed on this electrode to optimize the energy and power densities and make the NiO nanomaterials to be potential electrode material for
45
actual supercapacitor.
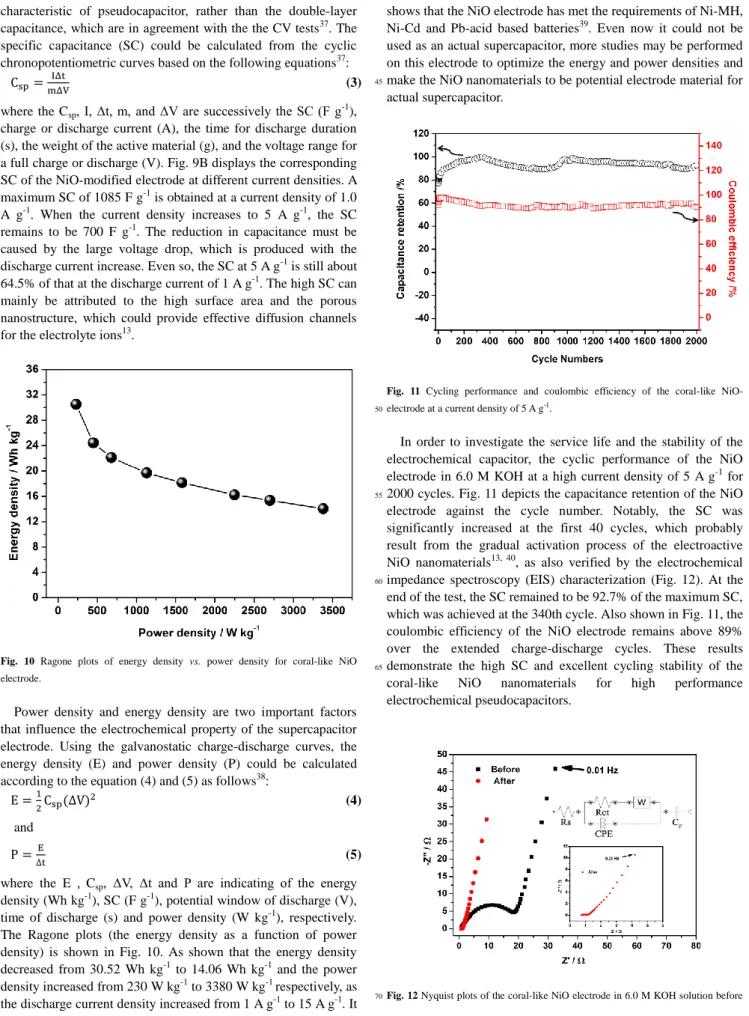
Fig. 11 Cycling performance and coulombic efficiency of the coral-like NiO-electrode at a current density of 5 A g-1.
50
In order to investigate the service life and the stability of the electrochemical capacitor, the cyclic performance of the NiO electrode in 6.0 M KOH at a high current density of 5 A g-1 for 2000 cycles. Fig. 11 depicts the capacitance retention of the NiO
55
electrode against the cycle number. Notably, the SC was significantly increased at the first 40 cycles, which probably result from the gradual activation process of the electroactive NiO nanomaterials13, 40, as also verified by the electrochemical impedance spectroscopy (EIS) characterization (Fig. 12). At the
60
end of the test, the SC remained to be 92.7% of the maximum SC, which was achieved at the 340th cycle. Also shown in Fig. 11, the coulombic efficiency of the NiO electrode remains above 89% over the extended charge-discharge cycles. These results demonstrate the high SC and excellent cycling stability of the
65
coral-like NiO nanomaterials for high performance electrochemical pseudocapacitors.
Fig. 12 Nyquist plots of the coral-like NiO electrode in 6.0 M KOH solution before
70
Page 7 of 9
Journal of Materials Chemistry A
J
o
u
rn
a
l
o
f
M
a
te
ri
a
ls
C
h
e
m
is
tr
y
A
A
c
c
e
p
te
d
M
a
n
u
s
c
ri
p
t
This journal is © The Royal Society of Chemistry [year] Journal Name, [year], [vol], 00–00 | 7
and after activation. The inset displays an enlarged view of the electrode after activation.
Fig. 12 displays the Nyquist plots of the NiO electrode before and after activation. The impedance spectra are almost similar in
5
shape, both of which consist of one semicircle in the high frequency zone and a linear plot in the mid-low frequency zone, indicating that the redox reaction is controlled by the diffusion of OH- ions. A deviation from straight line is apparent in the low frequency region infers that non-ideally ionic diffusion appears
10
during the charge-discharge process41. The equivalent circuit in accordance with the Nyquist plots is presented in Fig. 12 upper right inset, where Rs is the resistance of the solution, which includes the following three parts: the resistance of the KOH electrolyte, the intrinsic resistance of the electroactive materials
15
and the contact resistance at the interface between electroactive materials and the current collector42, Rct is the Faradaic interfacial charge transfer resistance, CPE is the constant phase element which accounts for a double-layer capacitance, W is the Warburg impedance, and CF is the Faradaic pseudocapacitance10.
20
The bulk solution resistance Rs and the charge transfer resistance Rct can be obtained from the Nyquist plots, where the high frequency semicircle intercepts the real axis at Rs and (Rs + Rct). Before and after activation, the bulk solution resistances do not change much, both of which are about 0.73 Ω. And the
25
corresponding charge transfer resistances are 17.8 and 0.39 Ω, respectively. Obviously, the charge transfer resistance is remarkably reduced after activation.
30
4.
Conclusions
In this work, we are the first to report a facile and additive-free method for the fabrication of coral-like NiO. As the precursor, β-Ni(OH)2 nanobars were successfully synthesized by a simple
coprecipitation method without stirring at room temperature
35
using Na2O2 aqueous solution as the OH- source. The fabricated
NiO nanomaterials have relatively large BET specific surface area and porous structure, for characteristics that are ideal for pseudocapacitive applications, The NiO-modified electrode exhibits high specific capacitance and energy density, as well as
40
excellent cycle performance. It is anticipated that the proposed facile and large-scale synthesis method could be extended to prepare other EC materials.
Acknowledgments
45This work was financially supported by the Natural Science Foundation of China (Nos. 21177090, 21275104 and 21175094).
Notes
a College of Chemistry, Sichuan University, 29 Wangjiang Road,
50
Chengdu 610064, China. b
College of Chemical Engineering, Sichuan University, 29 Wangjiang Road, Chengdu 610064, China.
*Corresponding author.
Tel: +86-28-85416029; fax: +86-28-85415029.
55
E-mail address: [email protected] (Dan Xiao).
†Electronic Supplementary Information (ESI) available. See
DOI: 10.1039/b000000x/
References
60
1 P. Simon and Y. Gogotsi, Nature mater., 2008, 7, 845.
2 Z. S. Wu, D. W. Wang, W. Ren, J. Zhao, G. Zhou, F. Li and H. M.
Cheng, Adv. Funct. Mater., 2010, 20, 3595.
3 D. Sun, X. Yan, J. Lang and Q. Xue, J. Power Sources, 2012, 15, 52.
4 Y. Lv, L. Gan, M. Liu, W. Xiong, Z. Xu, D. Zhu and D. S. Wright, J.
65
Power Sources, 2012, 209, 152.
5 H. Xu, J. Li, Z. Peng, J. Zhuang and J. Zhang, Electrochim. Acta, 2012,
90, 393.
6 B. Ren, M. Fan, Q. Liu, J. Wang, D. Song and X. Bai, Electrochim. Acta, 2013, 92, 197.
70
7 J. Yan, W. Sun, T. Wei, Q. Zhang, Z. Fan and F. Wei, J. Mater. Chem., 2012, 22, 11494.
8 J. Yan, Z. Fan, W. Sun, G. Ning, T. Wei, Q. Zhang, R. Zhang, L. Zhi and F. Wei, Adv. Funct. Mater., 2012, 22, 2632.
9 J. W. Lee, T. Ahn, J. H. Kim, J. M. Ko and J.-D. Kim, Electrochim. Acta,
75
2011, 56, 4849.
10 K. Liang, X. Tang and W. Hu, J. Mater. Chem., 2012, 22, 11062.
11 Y. Z. Zheng and M.-L. Zhang, Mater. Lett., 2007, 61, 3967.
12 S. K. Meher, P. Justin and G. R. Rao, Electrochim. Acta, 2010, 55, 8388.
80
13 C. Y. Cao, W. Guo, Z. M. Cui, W. G. Song and W. Cai, J. Mater. Chem., 2011, 21, 3204.
14 S. Ding, T. Zhu, J. S. Chen, Z. Wang, C. Yuan and X. W. D. Lou, J. Mater. Chem., 2011, 21, 6602.
15 Q. Lu, M. W. Lattanzi, Y. Chen, X. Kou, W. Li, X. Fan, K. M. Unruh, J.
85
G. Chen and J. Q. Xiao, Angew. Chem. Int. Ed., 2011, 123, 6979.
16 X. Tian, C. Cheng, L. Qian, B. Zheng, H. Yuan, S. Xie, D. Xiao and M.
M. Choi, J. Mater. Chem., 2012, 22, 8029.
17 M. Aghazadeh, A. N. Golikand and M. Ghaemi, Int. J. Hydrogen
Energy, 2011, 36, 8674.
90
18 C. Delmas and C. Tessier, J. Mater. Chem., 1997, 7, 1439.
19 C. Tessier, L. Guerlou-Demourgues, C. Faure, A. Demourgues and C.
Delmas, J. Mater. Chem., 2000, 10, 1185.
20 H. Li, S. Liu, C. Huang, Z. Zhou, Y. Li and D. Fang, Electrochim. Acta, 2011, 58, 89.
95
21 P. Oliva, J. Leonardi, J. Laurent, C. Delmas, J. Braconnier, M. Figlarz, F. Fievet and A. d. Guibert, J. Power Sources, 1982, 8, 229.
22 G. J. d. A. Soler-Illia, M. Jobbágy, A. E. Regazzoni and M. A. Blesa, Chem. Mater., 1999, 11, 3140.
23 R. Acharya, T. Subbaiah, S. Anand and R. Das, J. Power Sources, 2002,
100
109, 494.
24 B. Pejova, T. Kocareva, M. Najdoski and I. Grozdanov, Appl. Surf. Sci., 2000, 165, 271.
25 Y. Zhan, C. Yin, C. Zheng, W. Wang and G. Wang, J. Solid State Chem., 2004, 177, 2281.
105
26 A. Mansour, Surf. Sci. Spectra, 1994, 3, 231.
27 J. R. Manders, S. W. Tsang, M. J. Hartel, T. H. Lai, S. Chen, C. M.
Amb, J. R. Reynolds and F. So, Adv. Func. Mater., 2013. 23, 2993.
28 A. R. Gonzalez-Elipe, J. P. Holgado, R. Alvarez and G. Munuera, J. Phys. Chem., 1992, 96, 3080.
110
29 W. Zhou, M. Yao, L. Guo, Y. Li, J. Li and S. Yang, J. Am. Chem. Soc., 2009, 131, 2959.
30 R. Pierotti and J. Rouquerol, Pure Appl. Chem., 1985, 57, 603.
31 M. Xu, L. Kong, W. Zhou and H. Li, The J. Phys. Chem. C, 2007, 111,
19141.
115
32 C. Yu, L. Zhang, J. Shi, J. Zhao, J. Gao and D. Yan, Adv. Func. Mater., 2008, 18, 1544.
33 D. W. Wang, F. Li, M. Liu, G. Q. Lu and H. M. Cheng, Angew. Chem. Int. Ed, 2008, 120, 379.
34 Y. Zhang, X. Xia, J. Tu, Y. Mai, S. Shi, X. Wang and C. Gu, J. Power
120
Sources, 2012, 199, 413.
35 R. Y. Song, J. H. Park, S. Sivakkumar, S. H. Kim, J. M. Ko, D. Y. Park,
S. M. Jo and D. Y. Kim, J. Power Sources, 2007, 166, 297.
J
o
u
rn
a
l
o
f
M
a
te
ri
a
ls
C
h
e
m
is
tr
y
A
A
c
c
e
p
te
d
M
a
n
u
s
c
ri
p
t
8 | Journal Name, [year], [vol], 00–00 This journal is © The Royal Society of Chemistry [year]
36 H. Li, M. Yu, F. Wang, P. Liu, Y. Liang, J. Xiao, C. Wang, Y. Tong and
G. Yang, Nature commun., 2013, 4, 1894.
37 D. Dubal, V. Fulari and C. Lokhande, Microporous and Mesoporous
Mater., 2012, 151, 511.
38 A. K. Singh, D. Sarkar, G. G. Khan and K. Mandal, J. Mater. Chem. A,
5
2013, 1, 12759.
39 B. Scrosati, Nature, 1995, 373, 557.
40 C. Yuan, X. Zhang, L. Su, B. Gao and L. Shen, J. Mater. Chem., 2009,
19, 5772.
41 G. W. Yang, C. L. Xu and H. L. Li, Chem. Commun., 2008, 48, 6537.
10
42 F. Zhang, C. Yuan, J. Zhu, J. Wang, X. Zhang and X. W. Lou, Adv. Func. Mater., 2013, 23, 3909.