Application of artificial intelligence for technical screening of enhanced
oil recovery methods
1,2University of Aberdeen, UK
1Sonangol EP; Academia Sonangol - Angola; Polytechnic Institute of Technology and Sciences (ISPTEC), Department of Engineering and Technology (DET), Av. Luanda Sul, Rua Lateral Via S10, Talatona, Luanda Angola
*Corresponding author
Geraldo A. R. Ramos, School of Engineering, College of Physical Sciences, University of Aberdeen, UK, Email: Received:October 27, 2017 | Published:December 19, 2017
Copyright© 2017 Ramos et al. This is an open access article distributed under the terms of the Creative Commons Attribution License, which permits unrestricted use, distribution, and reproduction in any medium, provided the original author and source are credited.
Abstract
An artificial intelligence technique based on five (5) layered feedforward backpropagation algorithm is applied in this study for technical screening of enhanced oil recovery (EOR) methods. Explicit knowledge pattern associated with the field data are extracted by taking advantage of the robustness of fuzzy logic reasoning and learning capability of neural networks. Associated field data from successful EOR projects include parameters such as depth, porosity, permeability, viscosity, oil API and oil saturation. These parameters were used as input and predicted output in the training and validation processes, respectively. The developed model was then tested by using data set from Block T of the Angolan oilfield. Sensitivity analysis was performed between the Mandani and the Takagi Sugero (TSK) model approach incorporated in the algorithm. The results of the sensitivity analysis have shown the robustness of the ANFIS approach in comparison to other approaches for the prediction of suitable EOR technique. Five non-regression models (linear, potential, logarithm, power and polynomial) were applied to evaluate the accuracy of the model between the trained and the tested data set. The results of simulation show that hydrocarbon gas, polymer, combustion and CO2 are the
suitable EOR techniques and could be used for further experimental and numerical studies.
Keywords:
Enhanced Oil Recovery (EOR), neuro-fuzzy, artificial intelligence, reservoir screening, neural networkIntroduction
The current decline of oil production in Angolan oilfields and the prolonged downtown in the industry has necessitated the need to recover more oil from existing hydrocarbon reservoirs rather than moving to the deep and ultra-deep waters. Effective planning on the selection of the suitable technique is crucial to the success of the EOR implementation. This is due to the fact that most of the implementation of the EOR techniques in new brown fields can be challenging and expensive in comparison to secondary recovery processes if not cautiously planned. This process involves integration of a set of parameters governing technical and economic performance of a reservoir [1] but not limited to the environmental, commercial, political and governmental factors [2-4].
Several studies have been conducted and published on the screening of reservoir candidates for the purpose of EOR. Example of these include: data analysis by using tables and graphs [5-8]; laboratory work [9] and artificial intelligence (AI) [1,3,10-15]. The first study on screening criteria for EOR selection was performed by Taber et al. [16]. This was updated by Goodlett et al.
[9] and later improved by Adasani and Bai [5], Dickson et al. [12], Taber et al. [7-8].
The application of AI in screening reservoir candidates for the purpose of EOR was first published Guerillot [14]. Subsequent upon this, several works have been published to improve the quality and accuracy of the models. These models are based on fuzzy-logic (FL) and expert system approach [11,17], artificial neural network (ANN) [18], least square support vector machine (LSSVM) [19], and very recently combination of both fuzzy-logic (FL) and neuro-fuzzy (NF) [1,10,20]. These works and other recent works on screening techniques published in literature are summarised in the work presented by Ramos and Akanji [1]. In this study, a neuro-fuzzy (NF) approach based on five-layered feedforward-backpropagation technique was employed in the technical selection of suitable EOR technique of Block T in offshore Angola. The model combines both searching potential of fuzzy-logic (FL) and the learning capability of neural network (NN) to make a priori decision [1]. 365 data set from multiple successful
thermal, miscible gas, chemical and biological EOR projects worldwide were used in the model. A total of 959 field data set are mined from Angola Block T; which consists of 11 fields, 41 reservoirs and 61 wells. The mined data are then analysed using cross plot, box-plot and histogram techniques.
Data gathering and Analysis
Data sets are initially analysed before running the simulation model to ensure that reliable and accurate results are obtainable from the simulation runs. A total of 365 data sets obtained from
365 worldwide successful EOR projects (Figure 1) are used in the training and validation (prediction) process. The data consists of ten (10) different EOR techniques including miscible hydrocarbon gas, CO2, combustion, steam, polymer, surfactants, nitrates, microbial, hot water, and acid gas [10,21].
The testing data from Block T in offshore Angola were collected from ten (10) fields (Table 1) and from several reports including well test, geochemistry, fluid sampling, final well, thermodynamic, geological, DST and log interpretation reports.
Figure 1: Data set gathered from successful EOR projects: (a) countries; (b) reservoir rock and fluid parameters [21].
Table 1: Range of rock and fluid properties for Block T in offshore Angolan oilfields. (Courtesy: Sonangol EP)
Variables Block T
Type Number Min Avg Max
Depth (ft) 210 4980 8721 11385 API 117 23.1 32.1 36.6 Viscosity (cp) 27 0.5 2.5 17.1 Porosity (%) 146 12 25.4 38 Permeability (mD) 9 560 1059 2330 Oil Saturation (%) 125 15 76.5 95 Net Thickness (ft) 63 3 77 230 Temperature ( F) 92 97 166 210 Pressure (Psia) 170 893 4094 6000
Data analysis: Due to insufficient training/validation data
from some of the EOR techniques such as surfactants, nitrates, microbial, hot water, acid gas and missing variables data such as pressure, thickness, salinity, temperature these techniques and parameters were not investigated. Duplicated, inconsistent data from Angolan oilfields were re-moved to ascertain the quality of the data-set and results obtainable from simulation. Analysis of each variable (i.e API, depth, porosity, permeability, saturation, and viscosity) for different EOR techniques was performed by using cross plots (Figure 2), box-plots (Figure 3), and histograms (Figure 4), respectively.
a)
c) d)
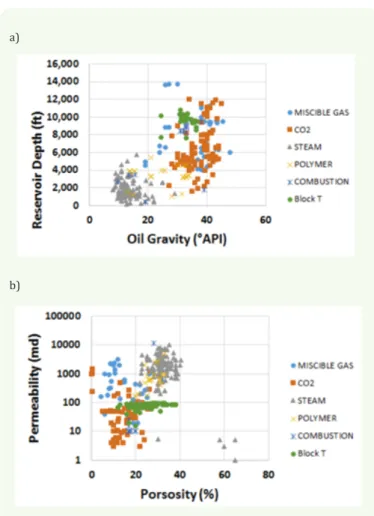
Figure 2: Scatter plots of producing EOR projects and Block T in offshore Angolan oilfields: (a) depth vs. API, (b) permeability vs. porosity, (c) saturation vs. porosity, (d) viscosity vs. API. Data source: Worldwide successful EOR data [21]; Angolan oilfield data (Sonangol EP).
a) b) c)
d) e) f)
Figure 3: Reservoir properties distribution vs. EOR methods using box-plots: (a) oil gravity; (b) reservoir depth; (c) permeability; (d) porosity; (e) oil saturation; (f) viscosity. Data source: Worldwide successful EOR data [21]; Angolan oilfield data (Sonangol EP).
d) e) f)
Figure 4: Histogram represents reservoir properties distribution vs. EOR methods of hydrocarbon gas: (a) oil gravity; (b) reservoir depth; (c) permeability; (d) porosity; (e) oil saturation; (f) viscosity. Data source: Worldwide successful EOR data [21]; Angolan oilfield data (Sonangol EP).
The first analysis was performed using the scatter (cross) plots. This was achieved by combining data from both successful EOR projects and those from the investigated oilfield (Block T). These plots are used to display the relationships between pair of variables and also to detect the outliers [6]. The variables relationships screened in this study are data associated the reservoir rock (reservoir depth, log permeability and porosity) and fluid properties (oil gravity, log oil viscosity and oil saturation). This investigation led to the analysis of the impact of the investigated parameters on the existing EOR methods (Figure 2).
The plots show that the six parameters investigated from the existing EOR projects characterise most of the EOR techniques. Although some data for steam for cross plots between permeability and porosity, oil saturation and porosity (Figures 2b and 2c) are distant from the rest, we cannot consider these as outliers due to the fact that they are data from successfully implemented EOR projects. From the plots, it can be seen that steam is the least suitable EOR technique of the investigated Block (Block T). Similarly, box-plots were used to illustrate the distribution of the parameters for both successful EOR projects and the investigated Block T. A data set from successful EOR projects was used to obtain the required statistics involving minimum, maximum, average, 1st quartile, 2nd quartile (median) and 3rd quartile for each variable. As an example, considering miscible CO2 as an EOR technique (Figure 3), the lower and upper limit of the variable saturation for successful projects are 27 and 89% and for Block T are 15 and 95%;
[
27 89∪] [
∩ 15 95∪] [
= 27 89∪]
, which means the values within the range of 27 and 89 may be suitable.Following the outcome of the box-plots and scatter plots, histogram technique is then used to represent the distribution of the data sets. The range of the values of the histogram was defined by the statistical data obtained from the box-plots (minimum, maximum, average, 1st quartile, 2nd quartile (median) and 3rd quartile). These parameters were determined from the data set of the successful EOR data set and then, defined the intervals for the data distribution in horizontal axis. Besides values aforementioned, zero is added to represent the interval of zero < minimum, and value > maximum values, which represents the first and last column of the histogram. Figure 4 represents the distribution of the hydrocarbon gas of the data from Angola oilfield within the defined interval. The data from the first and last column are the
investigated data considered out of the range, or not suitable for the investigated technique. This procedure was applied in the analysis of other EOR techniques (steam, combustion, CO2 and polymer).
These plots (cross plots, box-plots and histograms) provide a quick and efficient way to analyse the data as well as a quick way of defining the suitability of the parameters under investigation. However, it does not quantify the degree of uncertainty or add weight of each parameter, which requires a sophisticated system such as Neuro-Fuzzy, simulation or laboratory test for further investigation [1].
Neuro-Fuzzy Model Development
The NF model adopted in this work is a five (5) layered feedforward-backpropagation neural networks (Figure 5). The first and last layers are input and output layers, the intermediate layer, called the hidden layer and their neurons [3,19]. The number of neurons for the input and output layers are dependent on the type of problem and the number of input and output variables [3] while the number of neurons and hidden layers are based on the accuracy of the model [3].
The modelling process consists of training, validation and testing processes. During the training process, sensitivity analysis was performed by employing the developed model based on TSK (Takagi and Sugeno) approach against the Mamdani approach incorporated in the mode [22-25]. The data for the training and validation are from successful EOR projects grouped in two sets of 4/5 (80%) as the training and 1/5 (20%) as the validation data set, generating more than 1,350 runs as described in Ramos and Akanji [1]. During the training and validation stage, the weights are estimated to minimise the deviations between the actual and predicted outputs, whilst the testing data are used for checking the perform of the model [3]. The objective function of the model is the root mean square error (RMSE) with the threshold designed to be 0.01 and the number of epochs per each training case is set to a maximum number of 2,000. The accuracy of the model was examined by the least RMSE which also leads to a least non-dimensional error index (NDEI) [10].
( )
2 1 1 N i RMSE y x d N = = ∑ − (1)( )
RMSE NDEI d σ = (2)Where y x
( )
is the predicted output, σ( )
d is the standard deviation of the target series, i is the data point that varies from 1 to N. The error computation is crucial for training and validation process. This ensures the accuracy and performance of the model at the testing stage thereby ascertaining the suitability of the choice of EOR process or technique under investigation.The NF model adopted in this investigation has some advantages compared to other models. This includes the use of raw data in the training and validation process. Further, it does not require any normalisation neither does it make an assumption about the
process, but matches the pattern from the reservoir field under investigation to the least error data from the successful EOR projects [1]. It provides the degree of suitability of a typical EOR project obtained from the model prior to full field implementation as well as permits to segregate more oil properties and reservoir characteristics that could impact on EOR projects [1]. In order to reduce the cost of function that may lead to prediction that are less robust by using raw data [3,26], NDEI was used as decision making in testing process. The model has good performance when run with enough training, validation and testing data sets. Not having enough data may result in over-fitting leading to unexpected results. If the NN is successfully trained, it can now be used to predict the suitability of the test data for the respective EOR technique under investigation. Detailed description of the model has been presented in [1,10].
Figure 5: A typical 5-layer neuro-fuzzy framework [10].
Results and Discussion
The five (5) layered NF model based on feedforward-backpropagation neural networks was employed for technical screening of reservoir candidates of Block T in offshore Angolan oilfields. First, the data from worldwide successful EOR projects was grouped by variables (depth, permeability, porosity, oil viscosity, oil saturation, oil gravity) and EOR techniques (steam, miscible hydrocarbon gas, CO2 and combustion). Data was analysed using combined scattered plots, box-plots and histogram. This analysis is a quick look of suitability of EOR techniques and if all set of the parameters are not within the range of successful EOR projects, this set could be ignored from the NF simulation. Although, it is not a guaranteed, the RMSE used as object function is considered small and acceptable when the actual and predicted values are close to each other.
Training and validation process: The available data set from successful EOR projects was randomly divided into two sub-data sets of training (80%) and validation (20%). This data was used to construct and optimise the model parameters by using RMSE and NDEI [19].
Two approaches employed in the model were used to perform the sensitivity analysis of the model for the six parameters investigated (depth, porosity, permeability, viscosity, saturation and oil gravity) and five EOR techniques (steam, misc. gas, CO2, combustion and polymer). Besides the six variables and the five EOR techniques, three membership functions (triangular, trapezoidal and Gaussian) were employed in the training and validation process to determine the optimal model for testing purposes. The approach based on TSK and Mamdani approach were tested; generating 1, 350 runs with 15 runs for each variable and 90 runs for each technique. The results in general, showed that the TSK approach is more accurate (see Tables 2-4). In these tables, the selected optimum model for oil gravity of steam EOR technique is from Run 3 of TSK approach of trapezoidal MFs, with RMSE and NDEI of 0.000197 and 0.00038, respectively. This constructed model, is far better than the ones resulted from Mamdani approach for both COG and MOM as highlighted in bold in Tables 3 and 4. This process was performed for other variables and techniques. Then, the best validated data set (with the least RMSE) from the model, is then used as predicted output in the testing process.
Table 2: Results of oil gravity (°API) of the training and validation process to find the optimal configuration with epoch 2,000. The TSK approach for steam. The best network is in bold.
Run Pattern Triangular MFs Trapezoidal MFs Gaussian MFs MEAN STDV
Epochs RMSE NDEI Epochs RMSE NDEI Epochs RMSE NDEI
1 29 125 0.309887 0.22849 125 0.065191 0.048067 110 0.303569 0.223832 12.531034 1.356238
2 29 124 0.675353 0.149907 2000 0.657173 0.145872 111 1.183153 0.262623 13.641379 4.505132
3 29 2000 0.07245 0.013875 2000 0.000197 0.00038 108 0.433159 0.082952 17.637931 5.221799
4 29 2000 0.097927 0.062669 2000 0.113394 0.072567 110 0.192009 0.122877 12.758621 1.562606
5 29 125 1.702931 0.430815 103 1.79685 0.454575 112 1.973466 0.499256 13.127586 3.955816
Table 3: Results of oil gravity (°API) of the training and validation process to find the optimal configuration with epoch 2,000. The Mandami centre of Gravity (COG) approach for steam. The best network is in bold.
Run Pattern Triangular MFs Trapezoidal MFs Gaussian MFs MEAN STDV
Epochs RMSE NDEI Epochs RMSE NDEI Epochs RMSE NDEI
1 29 146 6.163418 4.54495 102 6.4377661 4.746704 259 0.959346 0.707358 12.531034 1.356238
2 29 155 5.293849 1.175071 102 8.341161 1.85148 102 4.127155 0.916101 13.641379 4.505132
3 29 109 8.892479 1.702953 102 8.819793 1.689033 167 2.690042 0.515156 17.637931 5.221799
4 29 263 5.055945 3.235586 102 6.547927 4.19039 233 1.162933 0.744227 12.758621 1.562606
5 29 154 7.267683 1.838609 102 6.025043 1.524244 191 2.678014 0.677495 13.127586 3.955816
Table 4: Results of oil gravity (°API) of the training and validation process to find the optimal configuration with epoch 2,000. The Mandami Min of Max (MOM) approach for steam. The best network is in bold.
Run Pattern Triangular MFs Trapezoidal MFs Gaussian MFs MEAN STDV
Epochs RMSE NDEI Epochs RMSE NDEI Epochs RMSE NDEI
1 29 161 6.164843 4.224194 102 6.436874 4.746124 258 0.944291 0.696257 12.531034 1.356238
2 29 158 5.305021 1.177551 102 8.341308 1.851512 131 3.798238 0.843091 13.641379 4.505132
3 29 258 8.558428 1.63891 102 8.819894 1.689053 332 2.444718 0.468175 17.637931 5.221799
4 29 223 5.058352 3.237127 102 6.5477099 4.190251 253 1.343862 0.860014 12.758621 1.562606
5 29 158 7.260287 1.836738 102 6.023378 1.5323819 199 2.604579 0.658917 13.127586 3.955816
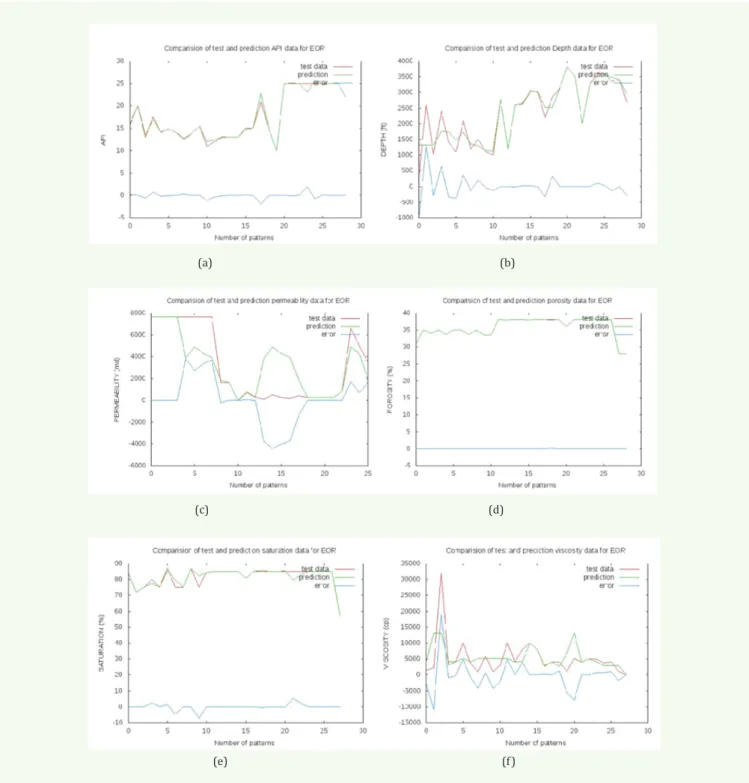
Testing process: The testing process was performed using the data from the Block T (Angola), the actual output, and the predicted output, represented by the least RMSE while the decision making was based on NDEI. In this stage, the investigation of the model performance and accuracy is employed. During the testing process, the best validation data set generated during the training and validation process is used as validation data set or predicted output in the testing process. Figure 6 shows the plots of the testing process for steam EOR technique of data set from Angola oilfield (Block T).
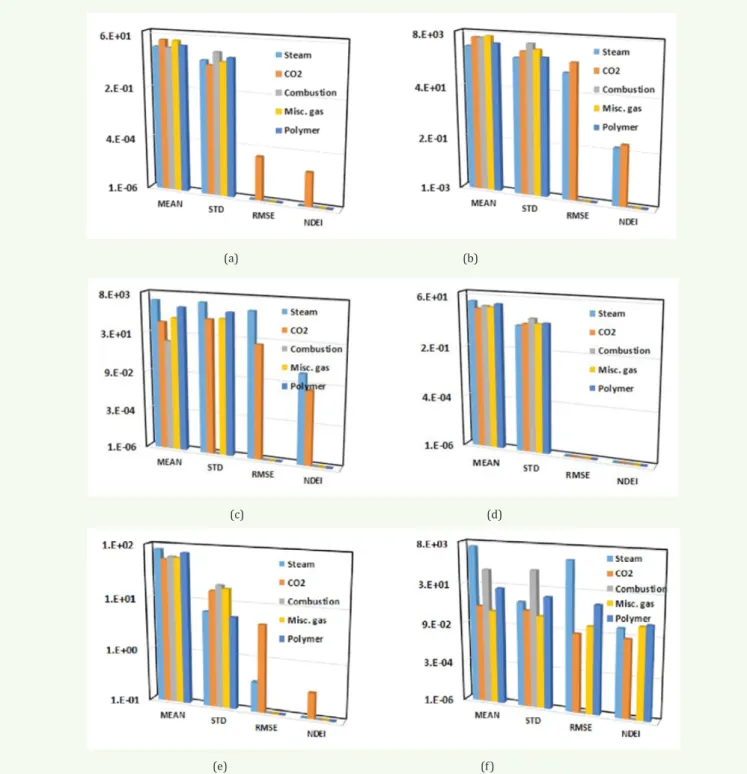
For the statistical error analysis of the model four indicators were presented: mean, standard deviation (STDV), RMSE, NDEI. These are summarised in Figure 7, where the four values are plotted from the five (5) EOR techniques investigated in this study. For the purpose of the interpretation and analysis of the results, three scenarios were investigated: (1) the least RMSE combined with 20 < NDEI 30%; (2) the least RMSE combined with 10 < NDEI 20%; (3) the least RMSE combined with NDEI 10% [1]. This procedure was performed on the six variables investigated
(API, depth, porosity, saturation, permeability and viscosity) for five EOR techniques (miscible gas, steam, CO2, polymer and combustion). The results are summarised in Table 5.
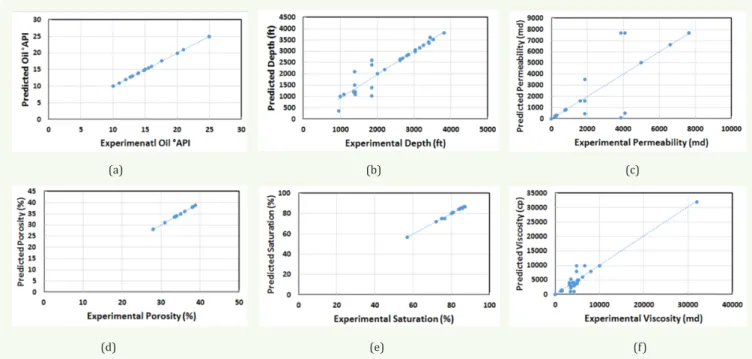
Regression analysis: Scatter plots of predicted output versus actual output (experimental data) for the model were generated and fitted for five different regression methods: linear, exponential, logarithmic, polynomial, and power. The steam EOR technique in the Figure 8 shows that oil gravity, porosity, and oil saturation for the model matched better the actual field data. The values estimated by the model are closer to the field data or the fitting data is within the unit slope line.
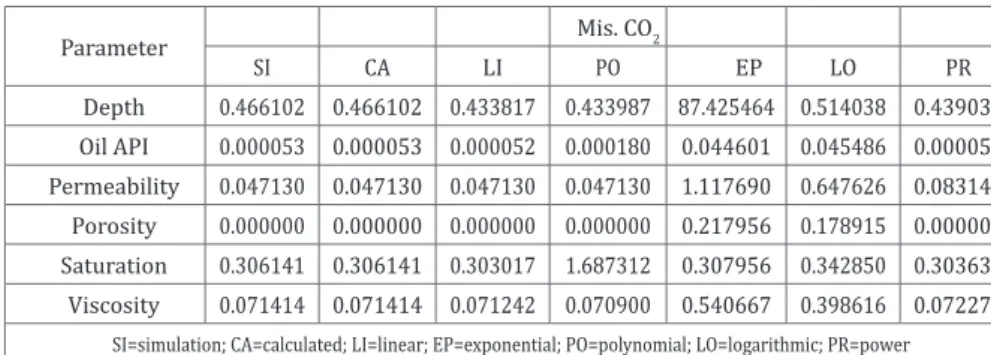
From the Figure 6, the permeability data does not display good match between the predicted and actual output which as illustrated in Figure 8, the distribution is outside the unit slope. This exercise is performed for all parameters and techniques investigated in this study. Equations 1 and 2 used for the model simulation were used to verify the code analytically. The results of the analysis are presented from Tables 6 to 10.
The results from simulation and hand calculation values are the same showing that model calculations are correct. On the other hand, the predicted output and actual output of the model for most of the parameters are distributed around the unit slope line than the other analytical solutions obtained from other four regression techniques (polynomial, exponential, logarithmic and
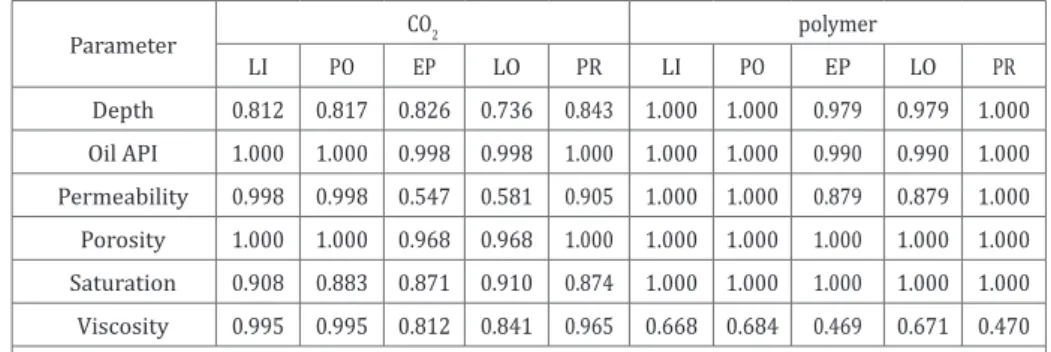
power). This means that the predicted output data are close to the actual output data (field data), representing the high capability of the model based on the TSK approach in predicting the EOR techniques of heterogeneous reservoirs. The R-squared (R2) representing the percent variance of the model for different regression are listed in Tables 11 and 12.
(a) (b)
(c) (d)
(e) (f)
Figure 6: Plots of the weighted testing data, prediction data and associated error versus number of patterns for steam (Block T): (a) oil gravity, (b) reservoir depth, (c) permeability, (d) porosity, (e) oil saturation, (f) viscosity.
(a) (b)
(c) (d)
(e) (f)
Figure 7: Statistical data plots of steam, CO2, combustion, miscible gas and polymer injection for Block T of the Angolan oilfield. Variables include:
(a) oil gravity, (b) reservoir depth, (c) permeability, (d) porosity, (e) oil saturation, (f) viscosity.
Table 5: Block T simulation results from Neuro-Fuzzy model with the least RMSE and NDEI.
Scenario Steam Misc Gas CO2 Polymer Combustion
20 < NDEI ≤ 30% X ✓ ✓ ✓ ✓
10 < NDEI ≤ 20% X ✓ X ✓ ✓
(a) (b) (c)
(d) (e) (f)
Figure 8: Scatter plots linear fitting for predicted values and actual values for NF model of the steam technique: (a) oil gravity, (b) reservoir depth, (c) permeability, (d) porosity, (e) oil saturation, (f) viscosity.
Table 6: Performance results of simulation and analytical methods for steam using NDEI.
Parameter Steam SI CA LI PO EP LO PR Depth 0.324365 0.324365 0.321814 0.320550 0.473427 0.337396 0.339365 Oil API 0.000000 0.000000 0.000000 0.000000 0.090890 5.443559 0.000000 Permeability 0.454122 0.454122 0.454122 0.454122 0.728152 0.672317 0.574595 Porosity 0.000000 0.000000 0.000000 0.000000 0.054259 0.143148 0.000000 Saturation 0.057939 0.057939 0.055442 10.674425 0.054781 0.058817 0.055456 Viscosity 0.283203 0.283203 0.282863 0.280728 0.565539 0.832379 0.328155 SI=simulation; CA=calculated; LI=linear; EP=exponential; PO=polynomial; LO=logarithmic; PR=power
Table 7: Performance results of simulation and analytical methods for miscible gas using NDEI.
Parameter Misc. Gas
SI CA LI PO EP LO PR Depth 0.000000 0.000000 0.000000 0.000000 1.386614 0.081001 0.000000 Oil API 0.000000 0.000000 0.000000 0.000000 0.067919 0.055888 0.000000 Permeability 0.000000 0.000000 0.000000 0.000000 0.158819 0.347757 0.000000 Porosity 0.000000 0.000000 0.000000 0.000000 0.095191 0.090337 0.000000 Saturation 0.000000 0.000000 0.000000 0.000000 0.221130 0.195978 0.000000 Viscosity 0.447923 0.447923 0.420748 0.196051 0.257979 0.574626 0.489657 SI=simulation; CA=calculated; LI=linear; EP=exponential; PO=polynomial; LO=logarithmic; PR=power
Table 8: Performance results of simulation and analytical methods for CO2 using NDEI. Parameter Mis. CO2 SI CA LI PO EP LO PR Depth 0.466102 0.466102 0.433817 0.433987 87.425464 0.514038 0.439033 Oil API 0.000053 0.000053 0.000052 0.000180 0.044601 0.045486 0.000053 Permeability 0.047130 0.047130 0.047130 0.047130 1.117690 0.647626 0.083146 Porosity 0.000000 0.000000 0.000000 0.000000 0.217956 0.178915 0.000000 Saturation 0.306141 0.306141 0.303017 1.687312 0.307956 0.342850 0.303638 Viscosity 0.071414 0.071414 0.071242 0.070900 0.540667 0.398616 0.072270
SI=simulation; CA=calculated; LI=linear; EP=exponential; PO=polynomial; LO=logarithmic; PR=power
Table 9: Performance results of simulation and analytical methods for combustion using NDEI.
Parameter Combustion
SI CA LI PO EP LO PR
Depth 0.000000 0.000000 0.000000 0.000000 0.221102 0.337955 0.000000 Oil API 0.000000 0.000000 0.000000 0.000000 0.632631 0.224721 0.117584
Permeability N/A N/A N/A N/A N/A N/A N/A
Porosity 0.000000 0.000000 0.000000 0.000000 0.002859 0.000247 0.000000 Saturation 0.000000 0.000000 0.000000 0.000000 0.090288 0.063407 0.000000 Viscosity 0.000000 0.000000 0.000000 0.000000 0.010699 0.000048 0.000000
SI=simulation; CA=calculated; LI=linear; EP=exponential; PO=polynomial; LO=logarithmic; PR=power
Table 10: Performance results of simulation and analytical methods for polymer using NDEI.
Parameter polymer SI CA LI PO EP LO PR Depth 0.000000 0.000000 0.000000 0.000000 0.266222 0.144220 0.000000 Oil API 0.000000 0.000000 0.000000 0.000000 0.090802 0.101077 0.000000 Permeability 0.000000 0.000000 0.000000 0.000000 0.061974 0.135700 0.000000 Porosity 0.000000 0.000000 0.000000 0.000000 0.008275 0.000237 0.000000 Saturation 0.000000 0.000000 0.000000 0.000000 0.007731 0.004740 0.000000 Viscosity 0.000880 0.000880 0.000869 0.000848 0.001010 0.000865 0.000911
SI=simulation; CA=calculated; LI=linear; EP=exponential; PO=polynomial; LO=logarithmic; PR=power
Table 11: Performance results of simulation and analytical methods for steam, misc. gas and combustion using R2.
Parameter Steam Misc. Gas Combustion
LI PO EP LO PR LI PO EP LO PR LI PO EP LO PR
Depth 0.896 0.897 0.754 0.886 0.808 1.000 1.000 0.993 0.993 1.000 1.000 1.000 0.886 0.886 1.00 Oil API 1.000 1.000 0.989 0.989 1.000 1.000 1.000 0.997 0.997 1.000 1.000 1.000 N/A N/A N/A Permeability 0.794 0.794 0.589 0.548 0.773 1.000 1.000 0.879 0.879 1.000 N/A N/A N/A N/A N/A Porosity 1.000 1.000 0.997 0.997 1.000 1.000 1.000 0.992 0.992 1.000 1.000 1.000 1.000 1.00 1.00 Saturation 0.994 0.994 0.994 0.993 0.994 1.000 1.000 0.962 0.962 1.000 1.000 1.000 0.996 0.996 1.00 Viscosity 0.920 0.921 0.325 0.307 0.878 0.823 0.962 0.937 0.670 1.000 1.000 1.000 1.000 1.00 1.00
Table 12: Performance results of simulation and analytical methods for CO2 and polymer using R2. Parameter CO2 polymer LI PO EP LO PR LI PO EP LO PR Depth 0.812 0.817 0.826 0.736 0.843 1.000 1.000 0.979 0.979 1.000 Oil API 1.000 1.000 0.998 0.998 1.000 1.000 1.000 0.990 0.990 1.000 Permeability 0.998 0.998 0.547 0.581 0.905 1.000 1.000 0.879 0.879 1.000 Porosity 1.000 1.000 0.968 0.968 1.000 1.000 1.000 1.000 1.000 1.000 Saturation 0.908 0.883 0.871 0.910 0.874 1.000 1.000 1.000 1.000 1.000 Viscosity 0.995 0.995 0.812 0.841 0.965 0.668 0.684 0.469 0.671 0.470
LI=linear; PO=polynomial; EP=exponential; LO=logarithmic; PR=power
Conclusion
A comprehensive study of data analysis has been presented using scatter plots, box-plots and histograms. These plots were generated by combining data set of the successful EOR techniques and data set of the investigated oilfield data (Block T in offshore Angola). The plots served as a useful tool for exploring the relationship between the reservoir parameters, the range and distribution of the investigated parameters within the screening criteria data set.
After preliminary screening, a five layer feed forward-back propagation model based on TSK and Mamdani was used in the training, validation and testing of the successful EOR data against the oilfield data from Block T in offshore Angola. The results in general, showed that the TSK approach being more accurate. Then, the performance of the model was proved by fitting scatter plots of the predicted output and actual output with five different regressions methods: linear, exponential, logarithmic, polynomial, logarithmic and power law. The distribution of the parameters around the unit slope line, presents the capability of the model in predicting the suitability screening candidate reservoirs for EOR applications.
The model was tested by using the oilfield data from Block T in offshore Angola, and results presented that the Polymer, hydrocarbon gas, combustion are suitable techniques and CO2 and steam being least suitable. However, additional evaluations such as laboratory core analysis, reservoir simulation and field pilot tests are required in order to confirm the applicability of the selected EOR technique.
Acknowledgment
This study is sponsored by the Angolan National Oil Company (Sonangol EP) and the authors are grateful for their support and the permission to use data and publish this manuscript.
Conflict of Interest:
The authors declare that there is no conflict of interest regarding the publication of this manuscript.Nomenclature
GeneralANFIS Adaptive - Network - Based Fuzzy Inference System
DST Drill Stem Test
FL Fuzzy-Logic
HC Hydrocarbon
Mbbls/day Millions of barrels per day
MFs Membership Functions
NDEI Non-dimensional error index
NF Neuro-Fuzzy
NNs Neural Networks
PI Productivity Index
RMSE Root mean square
TSK Takagi and Sugeno
Appendix
SI metric conversion factor
g/cm3=°API141.5/(131.5+°API) cp=mPa.s m=ft ✕ 0.3048g/l=1000ppm °C=°F(°F-32) ✕ 9/5 KPa=Psi ✕ 6.894757 µm2=md ✕ 9.869233 ✕ 10-4 D = 9.869233 ✕ 10-13 m2
References
1. Ramos GA, Akanji L. Data Analysis and Neuro-Fuzzy Technique for EOR Screening: Application in Angolan Oilfields. Energies. (2017);10(7):837.
2. Al-Mutairi SM, Kokal SL. EOR potential in the middle east: current and future trends. In: SPE EUROPEC/EAGE Annual Conference and Exhibition. Society of Petroleum Engineers. (2011).
3. Kamari A, Nikookar M, Sahranavard L, Mohammadi AH. Efficient screening of enhanced oil recovery methods and predictive economic analysis. Neural Comput & Applic. (2014);25(3-4):815
24. 4. Mohan H, Biglarbigi K, Carolus MJ, Van Wagener D. Assessing theEOR Potential of the United States. In: SPE Enhanced Oil Recovery Conference. Society of Petroleum Engineers. (2011).
5. Al Adasani A, Bai B. Analysis of EOR projects and updated screening
6. Saleh LD, Wei M, Bai B. Data analysis and updated screening criteria for polymer flooding based on oilfield data. SPE Reservoir Evaluation & Engineering. (2014);17(01):15
25.7. Taber JJ, Martin FD, Seright RS. EOR screening criteria revisited-Part 1: Introduction to screening criteria and enhanced recovery field projects. SPE Reservoir Engineering. (1997);12(03):189
98. 8. Taber JJ, Martin FD, Seright RS. EOR screening criteria revisited—part2: applications and impact of oil prices. SPE Reservoir Engineering. (1997);12(03):199
206.9. Goodlett GO, Honarpour MM, Chung FT, Sarathi PS. The role of screening and laboratory flow studies in EOR process evaluation. In: SPE Rocky Mountain Regional Meeting. Society of Petroleum Engineers. (1986).
10. Akanji L, Sandrea R. A Neuro-Fuzzy Approach to Screening Reservoir Candidates for EOR. Advances in Petroleum Exploration and Development. (2016);12(1):1
14.11. Chung T-H, Carroll HB, Lindsey R. Application of fuzzy expert systems for EOR project risk analysis. In: SPE Annual Technical Conference and Exhibition. Society of Petroleum Engineers. (1995).
12. Dickson JL, Leahy-Dios A, Wylie PL. Development of improved hydrocarbon recovery screening methodologies. In: SPE Improved Oil Recovery Symposium. Society of Petroleum Engineers. (2010). 13. Gharbi RB. An expert system for selecting and designing EOR
processes. J Pet Sci Eng. (2000);27(1):33
47.14. Guerillot DR. EOR screening with an expert system. In: Petroleum Computer Conference. Society of Petroleum Engineers. (1988). 15. Zhou CD, Wu X-L, Cheng J-A. Determining reservoir properties in
reservoir studies using a fuzzy neural network. In: SPE Annual Technical Conference and Exhibition. Society of Petroleum Engineers. (1993).
16. Taber JJ. Technical screening guides for the enhanced recovery of oil. In: SPE Annual Technical Conference and Exhibition. Society of Petroleum Engineers. (1983).
17. Nageh M, El Ela MA, El Tayeb ES, Sayyouh H. Application of Using Fuzzy Logic as an Artificial Intelligence Technique in the Screening Criteria of the EOR Technologies. In: SPE North Africa Technical Conference and Exhibition. Society of Petroleum Engineers. (2015).
18. Choubineh A, Mousavi SR, Vafaee Ayouri M, Ahmadinia M, Choubineh D, Baghban A. Estimation of the CO2-oil minimum miscibility pressure for enhanced oil recovery. Pet Sci Technol. (2016);34(22):184
54. 19. Kamari A, Moeini F, Shamsoddini-Moghadam M-J, Hosseini S-A,Mohammadi AH, Hemmati-Sarapardeh A. Modeling the permeability of heterogeneous oil reservoirs using a robust method. Geosciences Journal. (2016);20(2):259
71.20. Ramos G, Akanji L. Technical Screening of Enhanced Oil Recovery Methods-A Case Study of Block C in Offshore Angolan Oilfields. In: First EAGE/ASGA Petroleum Exploration Workshop. (2017). 21. Koottungal, L. Worlwide EOR Survey. Oil & Gas. (2014).
22. Chai Y, Jia L, Zhang Z. Mamdani model based adaptive neural fuzzy inference system and its application. International Journal of Computational Intelligence. (2009);5(1):22
9.23. Lin C-T. Neural fuzzy systems: a neuro-fuzzy synergism to intelligent systems. Prentice hall PTR. (1996).
24. Lin C-T, Lin C-J, Lee CG. Fuzzy adaptive learning control network with on-line neural learning. Fuzzy Sets Syst. (1995);71(1):25
45. 25. Mamdani EH, Assilian S. An experiment in linguistic synthesis with afuzzy logic controller. Int J Hum Comput Stud. (1999);51(2):135


![Figure 5: A typical 5-layer neuro-fuzzy framework [10].](https://thumb-us.123doks.com/thumbv2/123dok_us/10961119.2984445/5.892.70.819.405.736/figure-a-typical-layer-neuro-fuzzy-framework.webp)