Hazard Function Deployment: a QFD based tool for the assessment of working
1
tasks – A practical study in the construction industry
2
Despite the efforts made, the number of accidents has not significantly decreased in the 3
construction industry. The main reasons can be found in the peculiarities of working activities 4
in this sector, where hazard analysis and safety management result in being more difficult than 5
in other industries. To deal with these problems, a comprehensive approach for hazard 6
analysis is needed, focusing on the activities in which a working task is articulated since they 7
are characterized by different types of hazards and thus risk levels. The study proposes a 8
methodology that integrates the Quality Function Deployment (QFD) and Analytic Network 9
Process (ANP) methods to correlate working activities, hazardous events and possible 10
consequences. This provides a more effective decision making, while reducing the ambiguity 11
of the qualitative assessment criteria. The results achieved can augment the knowledge on the 12
usability of QFD in safety research, providing a basis for its application for further studies. 13
14
Keywords: occupational health and safety; Quality Function Deployment; Analytic Network 15
Process; occupational risk assessment; hazards prioritization; safety management; construction 16 industry. 17 18 List of abbreviations 19
HoQ = House of Quality Rs = Risks’ types
ECs = Engineering Characteristics P = Probability
CRs = Customer Requirements S = Severity
Wi = i-th matrix/eigenvector As = Activities
RI = Random Index Hs = Hazards’ types
CI = Consistency Index Cs = Consequences
HFD = Hazard Function Deployment QFD = Quality Function Deployment RHFD = risks calculated using the HFD approach ANP = Analytic Network Process
RT = risks calculated using the traditional approach PHA = Preliminary Hazard Analysis JSA = Job Safety Analysis ORA = Occupational Risk Assessment
20
1. Introduction
21
In recent years, standards and regulations concerning occupational safety have become more and
22
more rigorous. Despite such an effort, the number of accidents and victims is still significant and
the construction sector is certainly one of the most affected by this situation [1-6]. For example, in
24
the European Union (EU), the statistics and reports related to construction accidents show that,
25
although a reduction of the overall number of accidents was registered in recent years, the average
26
number of fatalities is still significant at about 1.000 cases per year and over 800.000 workers are
27
injured [7].
28
The main reasons for this situation are due to the specific characteristics of the sector [8-10].
29
As a matter of fact, the large variety of activities usually carried out by companies, the use of
30
obsolete machinery and equipment, the continuous change of workplaces, and the simultaneous use
31
of the working site by different companies, are all factors that make the management of safety
32
issues a difficult task to deal with [11-15]. To achieve effective results, safety managers should
33
adopt a proactive hazard identification and elimination approach [16]. In addition, Underwood and
34
Waterson [17] underlined the need of a holistic approach for risk assessment in order to better
35
understand and evaluate the interactions among the operator, the technical systems, and the working
36
environment. In such a context, Mitropoulos et al. [18] emphasized the role of the analysis of the
37
working task characteristics in construction accidents, as the normative approaches do not consider
38
the characteristics of the working processes properly. Working tasks should be considered with
39
more attention, since ensuring the safety of the various tasks performed in a construction site can be
40
the precondition for ensuring a higher level of safety at both project and company levels [10, 19].
41
Parise et al. [20] argued that an extensive effort is required to develop a hazard assessment approach
42
based on the analysis of the specific tasks executed in a construction site. Accordingly, Zhou et al.
43
[21] remarked the lack of construction safety research on the specific working tasks. Furthermore,
44
the relevance of accidents related to the use of machinery and work equipment in a construction site
45
was pointed out in numerous studies (e.g. in [22-27]). Accordingly, Jaafar et al. [28] remarked that
46
the leading causes of this situation are mainly due to the operators’ unsafe behavior, as well as to
47
the lack of the proper management of the work equipment. Hence, when performing risk assessment
48
of a working task such as the use of a work equipment, all of the specific activities related to its use
and management (e.g. setting, operating, maintaining, cleaning, etc.) should be considered, since
50
they can present different levels of risk [29]. To address these concerns, a more user-centred
51
approach is needed to investigate the different phases that characterize the use of a machinery or an
52
equipment in practice [30].
53
On these considerations, it is clear that safety managers /professionals need to implement a
54
risk assessment approach in order to provide companies with information concerning potential
55
hazards as well as prevention and improvement measures (i.e. a safety plan) based on the specific
56
working activities carried out. To deal with such an issue, several studies suggested the use of the
57
Quality Function Deployment (QFD) method [31] as a means of performing hazard analysis and
58
risk assessment of the working tasks in a holistic manner [32, 33]. In particular, both Liu and Tsai
59
[34] and Bas [35] focused on the use of QFD to perform risk assessment concerning the working
60
tasks in the construction industry. These two studies propose effective procedures for safety
61
management at a general level. However, at a practical level, a more specific and hands-on
62
approach should be adopted, in order to make its use easier also in the case of Small and
Medium-63
sized Enterprises (SMEs), which often rely on external professional services to carry out the
64
activities related to the protection and prevention of occupational risks, due to the lack of internal
65
resources [11, 36-39]. To address these issues, the paper presents a procedure for the hazard
66
analysis of the working activities related to the use of a work equipment, which takes into account
67
all of the foreseeable phases of its usage. In other words, this study is an attempt to answer the
68
following research question: How to correlate the activities concerning a working task (e.g. the use
69
of a work equipment), the related hazardous situations and events, and their corresponding
70
prevention and improvement measures in an effective and thorough manner?
71
With this goal in mind, we propose a risk assessment methodology based on the use of
72
QFD, augmented by the integration of the Analytic Network Process (ANP) approach [40]. Its
73
validity was verified by means of a practical case study concerning the use of an in-transit concrete
74
mixer, which was carried out in collaboration with two companies operating in the construction
industry. In such a context, the working task is the use and management of the machinery which
76
consist of a set of working activities (e.g. preparation of the concrete mixer, concrete discharge,
77
maintenance and cleaning, etc.).
78
The remainder of the paper is articulated as follows. In Section 2, the background and
79
research motivations are introduced. Section 3 presents our research approach, while its application
80
to the case study is described in section 4. Then, Section 5 discusses the results achieved and
81
Section 6 concludes the article addressing further work.
82
2. Background and motivations
83
The need to focus on the relationships between the operator, the working system and the working
84
environment when performing risk assessment activities has been largely discussed in the literature,
85
as notably remarked by Karwowski [41]. Dealing with these issues requires a holistic approach
[42-86
45], which should take into account the feedback from the system’s (i.e. the equipment) users [46,
87
47]. In such a context, several studies proposed the use QFD as a means of carrying out hazard
88
analysis and risk assessment activities in a holistic manner, through the analysis of the
inter-89
relationships and interactions among hazards, causes, effects and their consequences [30, 33-35,
90
48].
91
The core of the method is certainly the so-called “House of Quality” (HoQ), whose
92
innermost part is represented by the relationship matrix, which links customer needs and
93
expectations (i.e. the so-called Customer Requirements (CRs), also called the “whats”) to
94
appropriate technical attributes (i.e. the Engineering Characteristics (ECs), also called the “hows”),
95
providing their weight and thus their prioritization (Figure 1).
96 97
Figure 1. Scheme of the traditional House of Quality (HoQ) (adapted from [31]).
98
[Figure 1 near here]
100
In particular, focusing the attention on occupational safety in the construction industry, two main
101
approaches were presented. Firstly, Liu and Tsai [34] introduced a two-phase approach (by means
102
the development of two Houses of Quality (HoQs)) that provides a correlation among construction
103
items (i.e. working tasks), hazard types and hazard causes (Figure 2), following a top-down
104
approach for hazard analysis [49].
105
[Figure 2 near here]
106
Figure 2. Scheme of the approach proposed by Liu and Tsai [34].
107 108
To augment the effectiveness of the QFD, both the Analytic Network Process (ANP) and the
109
Fuzzy-Failure Modes and Effect Analysis (FMEA) approaches were implemented. More in detail,
110
the ANP approach was used to address the inner-relationships and inter-relationships among the
111
HoQ’s components. In addition, the Fuzzy Logic approach was applied to allow a more accurate
112
analysis. Hence, the study included the use of a fuzzy-FMEA method to complete the risk
113
assessment activities (i.e. the estimation of the risk level of each hazard cause to determine the
114
relative preventive and protective measures).
115
A more comprehensive approach based on the QFD method is the one presented by Bas
116
[35]. In this study, a three-phase approach is represented (Figure 3), where three HoQs were used to
117
consider the relationships between tasks and hazards, hazards and events, and events compared with
118
preventive and protective measures.
119
[Figure 3 near here]
120
Figure 3. Scheme of the approach proposed by Bas [35].
121 122
Compared with the former study, this framework presents a more complete risk assessment
123
approach, since:
• the hazard analysis follows a bottom-up approach [49];
125
• it enables the analysis of the relationships between the hazards and the possible
126
preventive/protective measures;
127
• the final priority weight of the events (in the third phase) considers the probability of
128
occurrence, the expected economic cost of each event, and the expected consequences of the
129
events.
130
Nevertheless, some drawbacks can be underlined: the validation of the procedure by means
131
of an empirical application was not performed. Second, the availability of statistical data on the
132
occurrence of accidents was used to complete the third phase of the procedure, while the correlation
133
relationships were not considered, limiting the benefits of the HoQ in assessing mutual relationships
134
among its parameters. In addition, both the above-mentioned approaches are aimed at supporting
135
engineers at a project level and thus they take into account macro-activities, while the specific
136
activities that characterize a working task are not addressed sufficiently. Moreover, focusing on the
137
operator and the activities carried out when performing a specific task, the use of a structured risk
138
management approach can allow the achievement of safer solutions [50]. Merging these
139
considerations, we can observe that, when carrying out occupational risk assessment (ORA)
140
activities, four main issues need to be addressed:
141
1. a bottom-up approach should be preferred to provide engineers with a thorough procedure
142
for hazard analysis and prioritization;
143
2. in order to meet the practical needs of companies that operate in a construction site, the
144
specific activities in which a working task is articulated need to be analyzed;
145
3. involving operators in the risk assessment process allows engineers to better define the
146
specific tasks, the identification of hazards and the determination of risks [51];
4. the evaluation of the inner relationships among the different parameters analyzed (e.g.
148
working activities, hazardous events and consequences) is significant in order to make their
149
assessment more consistent.
150
In the literature, numerous ORA approaches can be found: as remarked by Pinto et al. [52],
151
in the construction industry one of the most commonly used ORA methods is the Preliminary
152
Hazard Analysis (PHA). Accordingly, with the goal of accident prevention through planning, more
153
specific tools were proposed to properly address the above mentioned issues. In particular, the
154
approaches based on the Job Safety Analysis (JSA) (or Task Hazard Analysis (THA)) [53] stress on
155
the importance of identifying hazards and the potential accidents starting from the analysis of the
156
specific activities in which each job can be split, while the assessment criteria are similar to the ones
157
used in the traditional PHA-based methods [54]. Despite the unquestioned benefits that can be
158
achieved by the JSA approach, which allows engineers to address the first three ORA issues
159
mentioned above, some limitations can be found [55-56], especially when considering its capability
160
to deal with the mutual influences of the different factors analyzed.
161
To tackle these issues, a QFD-based methodology was developed for the risk assessment of
162
a working task concerning the use of a machinery in a construction site.
163 164
3. Research approach
165
The proposed safety assessment tool consists of three main phases, each based on the HoQ
166
augmented by the ANP approach to assess the inner and outer relationships [57].
167
3.1. The HoQ augmented by the ANP 168
The ANP approach uses pairwise comparisons to allow the evaluation and ranking of alternatives
169
while deciding on the optimal solutions to a complex problem [40, 58-59]. Hence, the use of the
170
ANP can support engineers in reducing the limitations of the traditional QFD in differentiating the
relative importance of different attributes effectively [60]. In Figure 4 a scheme of such an
172
integration is reported, where the CRs (i.e. the “whats”) correspond to the HoQ’s inputs, while the
173
ECs (i.e. the “hows”) represent the outputs [61].
174
[Figure 4 near here]
175
Figure 4. Scheme of the integration of the ANP approach in the HoQ.
176 177
Accordingly, the augmented HoQ can be represented as in Figure 5, where:
178
• W1 is an eigenvector representing the weight (i.e. the importance level) of each EC.
179
• W2 is the correlation matrix representing the inner dependency matrix of CRs.
180
• W3 is the relationship matrix, where the pairwise comparison of each CR with respect to
181
each EC is determined.
182
• W4 is the correlation matrix among representing the inner dependency matrix of ECs.
183
• W5 is an eigenvector representing the weight of each EC.
184
185
[Figure 5 near here]
186
Figure 5. Scheme of the HoQ augmented by the ANP.
187 188
In practice, the integration of the ANP within the HoQ is carried out by means of the
189
following procedure:
190
1. Definition of the list of CRs and ECs.
2. Definition of the eigenvector W1: pairwise comparisons of CRs with respect to each CR are
192
carried out taking into account that there is no dependence among the CRs. The output (W1)
193
is represented by the importance degrees of each CR.
194
3. Definition of the correlation matrix W2: pairwise comparisons of CRs with respect to each
195
CR are performed. The output (W2) is represented by the importance degrees of each CR
196
(inner dependencies).
197
4. Definition of the eigenvector W3: pairwise comparisons of ECs with respect to each CR are
198
carried out taking into account that there is no dependence among the ECs. The output is
199
represented by the relationship matrix W3 that provides the importance degrees of each EC.
200
5. Definition of the correlation matrix W4: pairwise comparisons of ECs with respect to each
201
EC are performed. The output (W4) is represented by the importance degrees of each EC
202
(inner dependencies).
203
6. Definition of the inter-dependent priorities of CRs: the interdependent weight of CRs is
204
calculated by means of the following equation:
205
WCRs = (W2× W1) (1)
206
7. Definition of the inter-dependent priorities of ECs: the interdependent weight of ECs is
207
calculated by means of the following equation:
208
WECs = (W4× W3) (2)
209
8. Definition of the overall priorities (W5): the overall priorities of the ECs are calculated by
210
multiplying the four resulting weight vectors/matrices as in the following equation:
211
W5 = (W4 ×W3) × (W2 × W1) = WECs× WCRs (3)
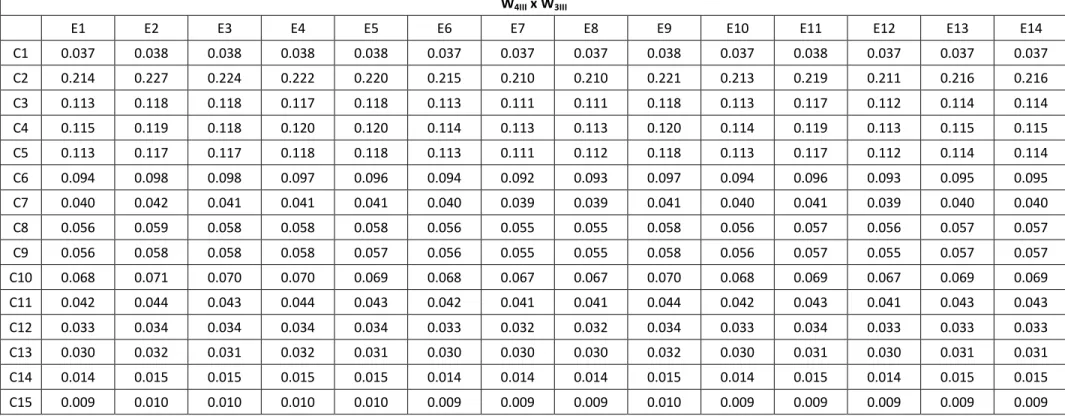
As per the criteria used in the pairwise comparisons, the judgment scores reported in Table 1 can be
213
used [34].
214
[Table 1 near here]
215
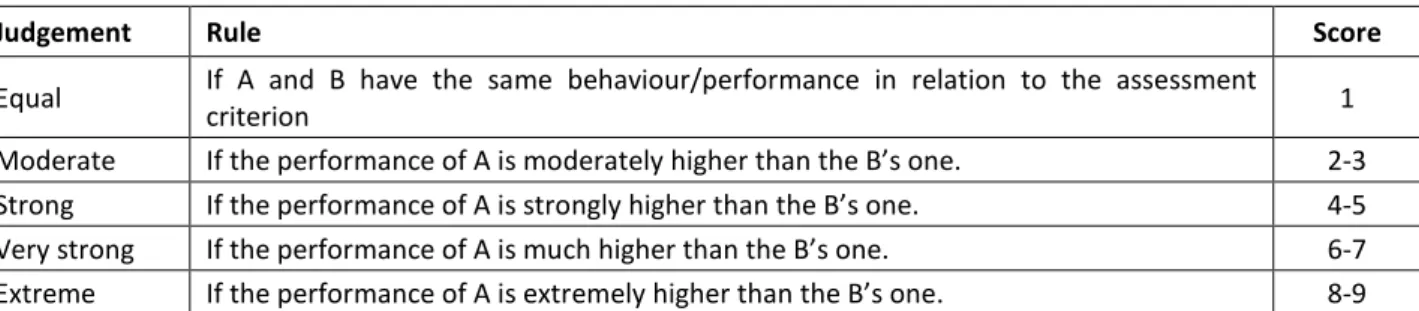
Accordingly, to verify the consistency of each pairwise comparison matrix for m elements, the
216
values reported in Table 2 for the computation of the Random Index (RI) [40] can be used
217 following equations: 218 () = (4) 219 = (5) 220
where λmax represents the largest eigenvalue of the pairwise comparison matrix, while CI is the
221
consistency index. It has to be noted that the consistency ratio of a pairwise comparison matrix has
222
to be lower than 0.1 to guarantee the consistency in human judgement [34].
223
[Table 2 near here]
224 225
3.2. The Hazard Function Deployment (HFD) methodology 226
Following such a scheme, the proposed methodology provides a bottom-up approach for
227
hazards identification and assessment, i.e. when focusing on a specific task, the analysis starts from
228
the identification of the working activities related to such a task, followed by examining the hazards
229
and the possible hazardous situations and how they can lead to harms [49]. The general scheme of
230
the proposed approach, called Hazard Function Deployment (HFD), is shown in Figure 6, where the
231
main phases are the followings:
232
Phase I. Hazard types’ assessment: from the activities that characterize a certain working task
233
(e.g. the use of a machinery), hazard types are defined and assessed.
Phase II. Hazardous events’ assessment: starting from the type of hazards, hazardous situations
235
and events are defined and assessed.
236
Phase III. Hazards effects’ assessment: starting from the hazardous situations and events, effects
237
and consequences are defined and assessed.
238
With reference to the scheme proposed in Figure 6, in the name of each matrix and vector
239
the number of the phase was added. For example, the equation (3) for Phase I becomes:
240
W5I = (W4I ×W3I) × (W2I × W1I) (6)
241
[Figure 6 near here]
242
Figure 6. Scheme of the HFD approach.
243 244
The definition of the various parameters of the three HoQs should be carried out with the
245
support of experts and experienced operators. In fact, on the one hand, the experts’ consultation
246
concerning the importance of both hazardous situations/events and their possible consequences can
247
facilitate the risk assessment activities, since the ranking provided already takes into account the
248
probability factors based on the experts’ know-how. It order to prevent any bias in the assessment
249
activities carried out by the group of experts, the Delphi technique can be used. Such a tool is a
250
well-known means of gathering experts' opinions through several rounds of consultation and
251
controlled feedback of results [62]. In particular, it is a suitable approach when the analysis carried
252
out is based on a subjective assessment (e.g. the definition of the weights or importance levels) [63].
253
On the other hand, also the feedback from experienced operators can help the safety
254
managers in better addressing the implementation of the HoQs, especially for what concern the
255
definition of the specific activities carried out when performing a task [47]. It has to be noted that in
256
the present study a working task is the general assignment the operator carries out (e.g. use of the
257
in-transit concrete mixer). A working task consists of several specific activities (e.g. setting the
258
machinery, discharge the concrete, cleaning). Moreover, in our model the output of the analysis of
the hazardous situations (i.e. the specific working situation during a working activity that exposes
260
the operator to the hazard) and hazardous events (i.e. how the hazard can cause harm) is synthetized
261
in the category “hazardous situations and events”. In order to verify the validity of this approach, it
262
was applied to an empirical case study concerning the use of a truck mixer in a construction site. On
263
these considerations, in order to define and assess the various parameters of the three HoQs, the
264
company’s operators are interviewed in order to define the activities related to the use of the work
265
equipment, including all foreseeable operations, as well as experienced accidents, near misses, and
266
operative troubles.
267
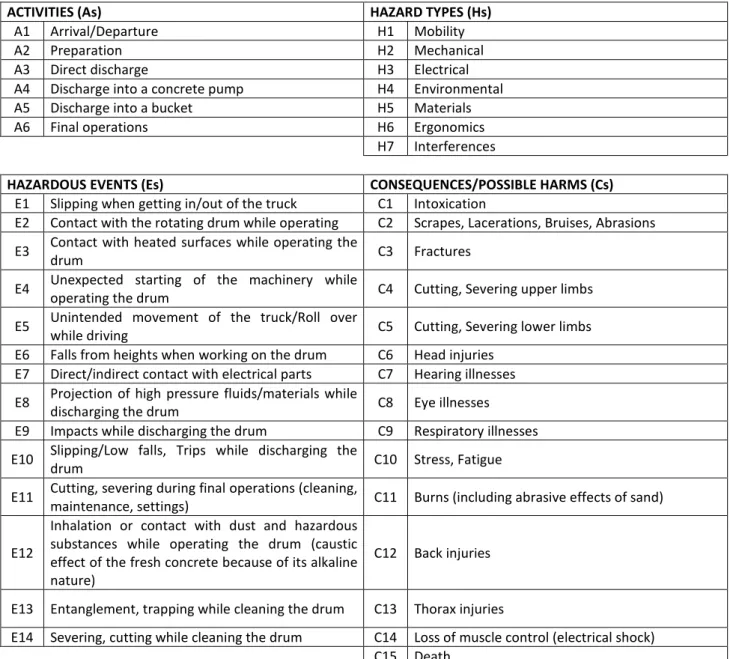
The list of the CRs and ECs for each phase, as well as their mutual assessment, can be
268
defined in collaboration with a group of experts in the field of occupational safety in the
269 construction industry. 270 271 4. Case Study 272
The validity of the HFD approach was tested in collaboration with a company that operates in the
273
construction industry where the use of an in-transit concrete mixer was considered. As far as
274
accidents related to this type of machinery is concerned, official statistics cannot be considered
275
exhaustive. In fact, on the one hand data provided by the Italian Workers’ Compensation Authority
276
(INAIL) provide a detailed information concerning the fatal accidents occurred in recent years
277
while operating a truck mixer: in Table 3 the number and the type of causalities of fatal accidents
278
that occurred in the period 2008-2015 are reported [64].
279
[Table 3 near here]
280
On the other hand, information concerning non-fatal accidents, especially when minor
281
injuries incurred, is often treated with a low amount of detail, while data concerning these injuries
282
are provided at a macro level (i.e. accidents involving any heavy machinery in construction sites).
The study was carried out in collaboration with two small sized companies operating in such a
284
sector. More in detail, 15 operators were interviewed to gather practical information concerning the
285
working activities that accomplish the task “use of the in-transit mixer” and the safety problems
286
they have experienced while performing them. On this, a group of experts was defined, consisting
287
of 2 company managers (1 per each company) who have experience both as safety managers and
288
supervisors, and 3 experts belonging to the Italian Workers’ Compensation Authority, who have
289
experience in machinery safety and ORA in the construction industry. The group was asked to
290
define the list of activities, the related hazard types, the hazardous events and situations and events,
291
as well as the potential consequences/possible harms in order to fill the three HoQs (Table 4).
292
[Table 4 near here]
293
It has to be noted that in Table 4 the various elements are summarized due to space limits,
294
since a more formal definition of each of them would have required longer sentences (e.g. instead of
295
“Direct/indirect contact with electrical parts” a more appropriate sentence to indicate this hazardous
296
situation should be “The operator is close to a conductive metallic body of the machinery or to an
297
unprotected/worn out cable”). Then, following the procedure exposed in the previous section, the
298
ANP-QFD approach was applied. To reduce the potential bias and to respect the privacy concerns
299
of the companies, the Delphi technique was used in the assessment activities carried out by the
300
group of experts. More precisely, once collected the information from the operators, two rounds of
301
consultations were organized by means of questionnaires. While the first round concerned the
302
definition of the elements of each phase of the procedure (i.e. the list of activities, hazard types,
303
hazardous events, etc.), the second round concerned the pairwise comparisons. In detail, data used
304
as input in the meetings were provided by means of structured (in the case of the first round) and
305
semi-structured (in the case of the pairwise comparisons) questionnaires. It has to be noted that,
306
although the participants knew each other, individual responses to questions were asked separately
307
and kept anonymous in the further discussion to determine the final results of each round.
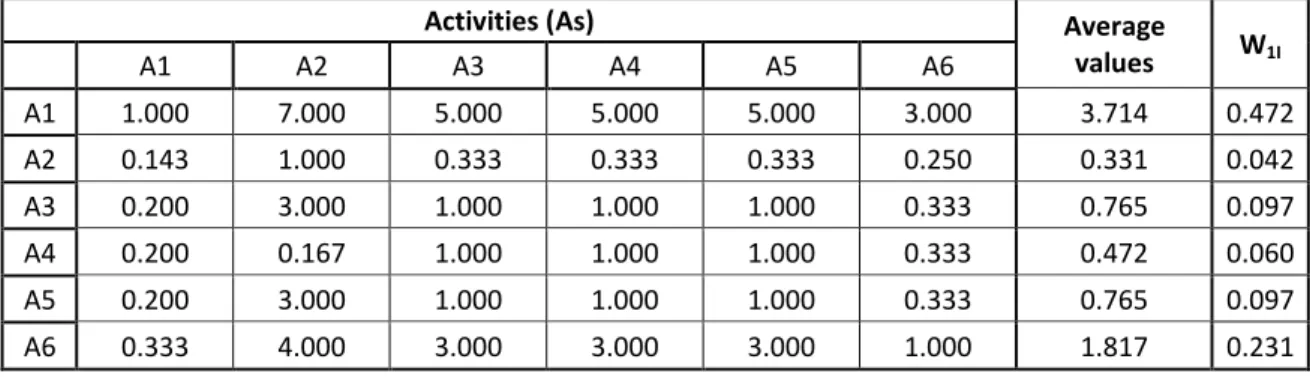
4.1 Phase I 309
In collaboration with the group of experts, the pairwise comparisons among activities and hazard
310
types were carried out based on the criteria exposed in section 3:
311
• Eigenvector W1I: the group of experts was asked to respond to a questionnaire, where each
312
question inquired the relative importance between pairs of activities concerning the goal
313
(determine important hazard types). calculated as shown in Table 5.
314
• Matrix W3I: the comparison among hazard types was carried out considering the impact
315
level of activities on each of the hazard types. The responses were provided using the
316
criteria exposed in Table 1. It is worth nothing that when comparing an element of the
317
matrix to itself (e.g. H1 compared to H1) a score of 1 is given (hence the values of the
318
diagonal are equal to 1); while the values below the diagonal are the inverse of the
319
corresponding values above the diagonal. This means that if aij represents the relative 320
importance of the i-th element compared to the j-th element, then the relative importance of
321
the j-th element compared to the i-th element is represented by aji = 1/aij. To better clarify 322
the calculation mechanism, all the matrices used to derive the values for the matrix W3I are
323
reported in Annex I.
324
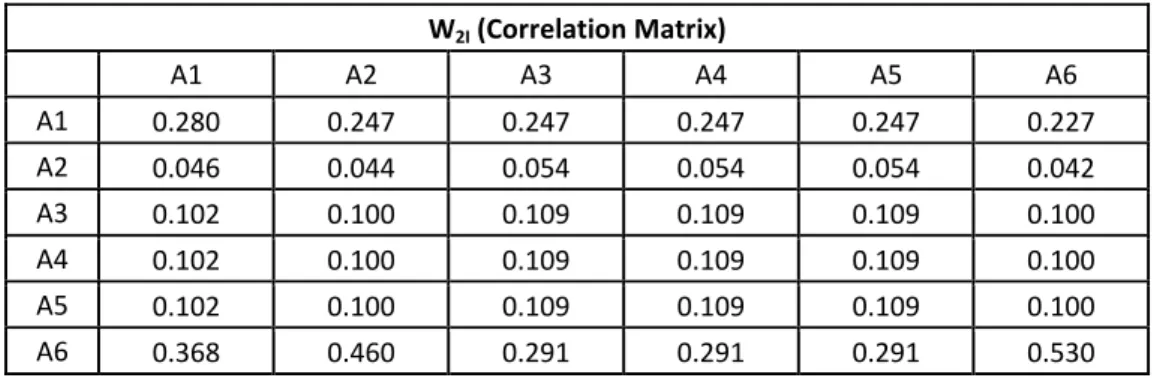
• Matrix W2I: the comparison among the activities was performed using as criterion the
325
occurrence of accidents (without considering their effects). In other words, the judgement
326
score of 1 was given when the occurrence of accidents during an activity A was considered
327
equal to the one of an activity B. Hence, following the same computational process reported
328
in Annex I, the type of questions used in this case was: “With respect to A1 (arrival,
329
departure, transit), what is the relative importance of: A1 compared to A2; A1 compared to
330
A3; A1 compared to A4; etc.?” (Table 6).
331
• Matrix W4I: the comparison among the hazards was performed using as criterion the
relevance of hazard types [34]. Following the same computational process reported in
333
Annex I, the type of questions used in this case was: “With respect to H1 (mobility), what is
334
the relative importance of: H11 compared to H2; H1 compared to H3; etc.?”.
335
[Tables 5-6 near here]
336
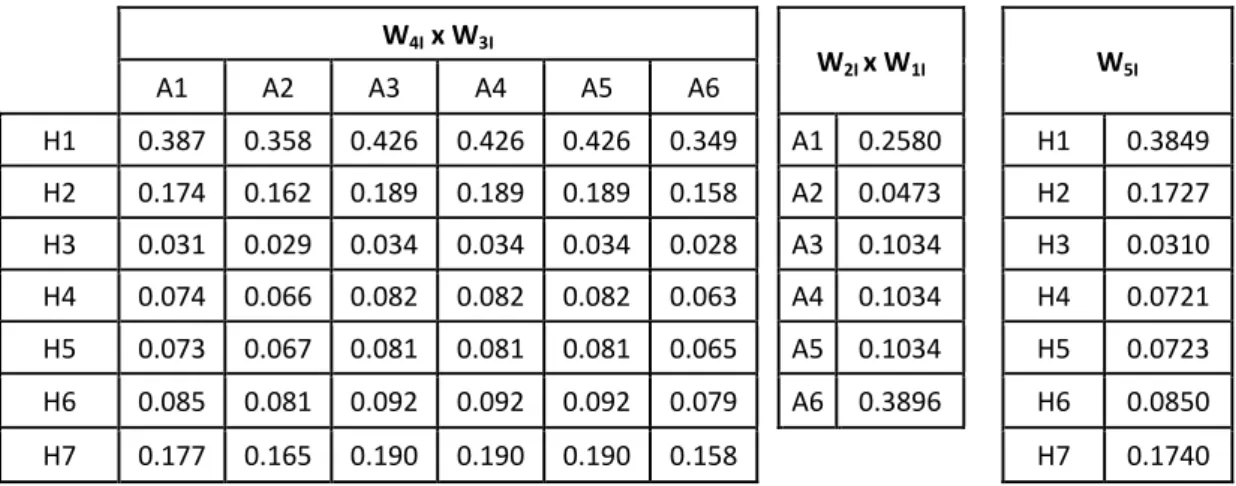
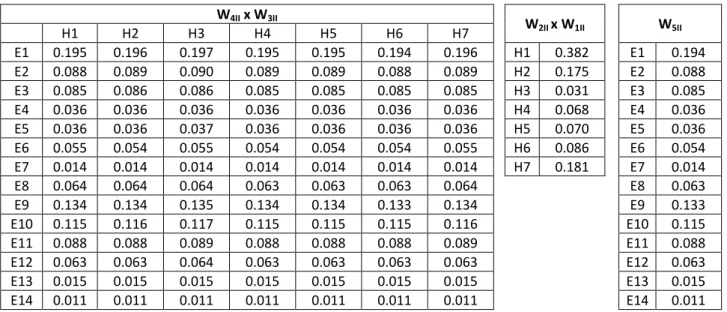
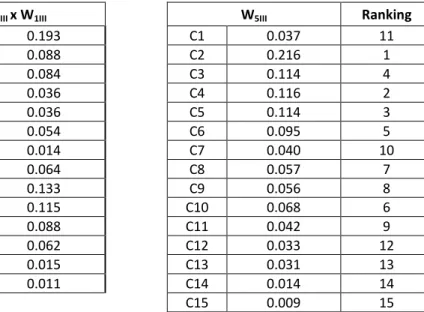
In detail, the final results obtained in the first phase are shown in Table 7, where:
337
• W4I × W3I provides the interdependent weight of hazard types when compared with
338
reference to working activities;
339
• W2I × W1I represents the interdependent weight of working activities when compared with
340
reference to hazard types; and
341
• W5I provides the importance weights of hazard types, i.e. their overall priorities.
342
[Table 7 near here]
343
4.2 Phase II 344
Following the same approach as in Phase I, at this stage the overall priorities of the possible
345
hazardous events were calculated, as shown in Table 8, where:
346
• W4II ×W3II provides the interdependent weight of hazardous events when compared with
347
reference to hazardous events;
348
• W2II × W1II = W2I × W1I represents the interdependent weight of hazard types derived from
349
Phase I; and
350
• W5II provides the weights of hazardous events, i.e. their overall priorities.
351
[Table 8 near here]
352
The numerical values of each matrix of Phase II are reported in Annex II.
4.3 Phase III 354
Similarly, in the last phase of the procedure the overall priorities of the possible consequences were
355
calculated, as shown in Table 9 and Table 10, where:
356
• W2II × W1II represents the interdependent weight of hazardous events derived from Phase II
357
(Table 9);
358
• W4III ×W3III provides the interdependent weight of possible consequences when compared
359
with reference to hazardous events (Table 10);
360
• W5III provides the weights of the possible consequences (Table 9).
361
[Table 9-10 near here]
362
The numerical values of each matrix of Phase III are reported in Annex II.
363
5. Discussion of results
364
5.1. The case study outputs 365
The results obtained from the case study can be summarized in the following figures, where the
366
weights (i.e. the overall priorities) of the hazard types (Figure 7), the hazardous events (Figure 8)
367
and the possible consequences (Figure 9) are shown (note that the values of the “y” axes are
368
dimensionless, as they are normalized values).
369
[Figure 7 near here]
370
Figure 7. Weights of hazard types.
371 372
[Figure 8 near here]
373
Figure 8. Weights of hazardous events.
375
[Figure 9 near here]
376
Figure 9. Weights of possible consequences.
377 378
According to these data, the most relevant consequence while operating the truck mixer is
379
represented by C2, i.e. scrapes, lacerations, and bruises. Such a result augments the information
380
provided by accident statistics, since this type of injuries are hardly reported as they normally
381
require a few days to recover from. In fact, according to law requirements, if an accident causes an
382
injury recoverable within three days (apart from the day when the accident occurred), it should not
383
be reported. Hence, while accidents that caused serious injuries are reported correctly, accidents
384
with minor consequences (e.g. those ones requiring few days of recovery) are reported with fewer
385
details. Therefore, official statistics on accidents at work provide incomplete information on what
386
happens in reality regarding the assessment of minor injuries. Moreover, it is consistent with results
387
obtained in the second phase of the procedure, where the most important hazardous event concerns
388
slipping when getting in/out from the truck’s cabin (E1), followed by impacts while discharging the
389
drum (E9). In other words, the results show (see Figures 8 and 9) the relevance of accidents related
390
to slipping and impacts, which mainly lead to scrapes, contusions, lacerations, and bruises injuries,
391
consistently with the findings of Lipscomb et al. [65]. This is also in line with findings by Shibuya
392
et al. [66], who pointed out that slips and trips should be considered a contributing factor for
393
occupational injuries among truck drivers. Accordingly, these results also confirm implications
394
provided by Aminbakhsh et al. [67], who reported that “trips and falls” together with risks related to
395
the use of “machinery and equipment” are among the most significant risks in the construction
396
industry. This can help engineers in carrying out risk assessment more correctly and easily. In other
397
words, when we consider the traditional approach followed to perform the hazard analysis, for
398
instance by means of the Preliminary Hazard Analysis (PHA) method [52, 68], the likelihood of the
events is usually classified into rather broad categories (e.g. using a scale ranging from 1 (very
400
unlikely) to 5 (very likely)). Hence, in our case study, we should assign a score of 5 to C2 and 1 to
401
C15 (death), which means that the ratio between them is 1 to 5, while following the proposed
402
procedure such a relationship is extended to 1 to 20 (see Table 11). This wider range represents a
403
value much closer to the reality.
404
To better evaluate these differences, the group of experts was asked to perform the
405
occupational risk assessment following the rules of the PHA method [69] and the hints provided by
406
the report ISO/TR 14121-2 [49]. More in detail, each risk type (Rs) corresponds to the occurrence
407
of the related hazardous event (i.e. R1, R2, R3 etc. are the risks related to the occurrence of E1, E3,
408
E3 etc. that lead to the consequence C1, C2, C3, etc. respectively). As for the traditional approach,
409
the risk level (RT ) was estimated by means of the equation (7):
410
RT = P × S (7)
411
where P is the probability of occurrence of a hazardous event estimated through a 1 to 5
412
scale (1 = very unlikely – 5 = very likely) and S indicates the severity of its consequences
413
(estimated by means of a 1 to 5 scale, where 1 = minor effects and 5 = catastrophic effects (e.g.
414
death)). The estimation of the risk level in accordance with the HFD methodology (RHFD) was
415
performed using the output of the proposed approach: the weight of the possible consequences (Cs)
416
determined at the end of Phase III was multiplied per the corresponding values of Severity (S)
417
obtained with the traditional approach (Table 11).
418
[Table 11 near here]
419
More precisely, the comparison between the results of the two risk assessment activities is
420
shown in Figure 10, where the solid line connects the values (i.e. the importance levels) related to
421
the risks computed following the traditional approach (RT), while the broken line represents the
422
results achieved by means of the HFD approach (RHFD). These results bring to light that significant
differences occur depending on the approach used to calculate risks. First, it has to be pointed out
424
that the traditional approach provides slight differences among the various risks: i.e. risks vary in a
425
small range of values of about 5.5 %. Conversely, the HFD approach leads to a higher level of
426
differentiation of the risks’ values: i.e. circa 11.5 %. Secondly, the HFD approach allows engineers
427
to clearly distinguish the difference of one risk from another since risks with a similar weight were
428
not found, while some strong resemblances can be observed among the results achieved through the
429
traditional approach. In addition, also when hazardous situations that might lead to diseases were
430
evaluated, the HFD approach provided a clearer level of resolution, as in the case of R10 (stress and
431
fatigue).
432
[Figure 11 near here]
433
Figure 11. Risks’ values determined through the traditional (RT - solid line) and the HFD (RHFD -
434
broken line) approaches.
435 436
The results achieved were considered very positive from the group of experts, especially for
437
what concerns the assessment of minor injuries, as their impact is often underestimated when
438
performing traditional risk assessment. Hence, these issues need to be addressed better at the
439
company level by means of a more specific training of the operators.
440
5.2. The methodology 441
From a safety management point of view, the proposed approach does not start from a standardized
442
set of health and safety risks, but it relies on a process-oriented analysis considering all the activities
443
related to a specific task. Hence, it provides a contribution to the research hints and clues stressed
444
by Zhou et al. [21], who underlined the lack of construction safety research at the working task
445
level. This is also in line with Gangolells et al. [16], who remarked the lack of construction safety
446
research on the specific working tasks. Commonly with other research works in different fields (e.g.
in [70-72]), this study found that the coordinated use of QFD and ANP can offer a more precise
448
analysis due to the integration of interdependent relationships among the attributes, providing
449
consistent information as to improve the safety conditions at the company level. Hence, such an
450
approach allowed us to effectively correlate working activities related to a specific task (such as the
451
use of a working equipment), hazardous events and possible consequences.
452
These practical implications for companies are in line with research clues provided by Seker
453
et al. [45] and Samantra et al. [73]), and can be considered beneficial when considering that
454
traditional risk assessment activities provide a relatively limited scoring “resolution” (i.e. when
455
different risks get the same score as well as when the scores vary in a limited range of values),
456
especially when data concerning the likelihood of occurrence are poor. Such an aspect is quite
457
relevant in SMEs, as observed by Bohm and Harris [74], who carried out a study on risk perception
458
and risk assessment of dumper drivers operating in construction sites. On the contrary, the HFD
459
approach allows a more accurate assessment of the risks, ensuring a clearer ranking of them that can
460
lead to a more efficacious decision making. This result, answering our research question, also
461
accomplishes research suggestions provided by Kines et al. [75], who stressed on the importance of
462
providing a more thorough risk analysis approach to bring to light the relevance of minor injuries
463
and uncomfortable working situation. In other words, HFD provides a more precise risk analysis
464
and ranking than the traditional risk assessment approaches, even when the availability of official
465
statistics concerning workers’ accidents is limited.
466
Finally, the HFD approach was compared with the above mentioned studies from the
467
literature concerning the application of the QFD method for risk assessment in the construction
468
industry. As summarized in Table 12, the proposed approach can provide more practical insights for
469
risk assessment of working tasks (e.g. the use of machinery or work equipment). This accomplishes
470
the need of providing the improvement of safety conditions not relying on the compliance with
471
normative requirements only, but also considering the practical context of working activities [76].
472 473
[Table 12 near here]
474
Hence, it has to be pointed out that such an approach can accomplish the need of developing
475
new risk analysis methods to identify and assess risks in an acceptable way so that the information
476
is reliable for decision making [3, 32, 77], augmenting the knowledge on the use of QFD in the
477
safety management context.
478
5.3. Practical implications 479
From the practical point of view, the HFD methodology extends the benefits of the traditional JSA
480
approach. In fact, on the one hand, it relies on a process of identifying activity-related factors that
481
may result in potential hazards, as for example the use of a work equipment, with the aim of
482
proposing rules to eliminate or control these hazards. On the other hand, the HFD provides a more
483
structured framework, which takes into account the mutual influences that might arise among the
484
different hazards and the related potential effects, augmenting the effectiveness of risk assessment
485
activities, since carrying out risk assessment in a sequential manner (i.e. cause-effect analysis) is
486
insufficient to consider the complexity of these interactions. Moreover, although the proposed
487
methodology consists in the definition of a series of matrices that make the HFD’s process more
488
complex than other diffused ORA approaches (e.g. the JSA), it is worth nothing that the HFD
489
assessment criteria rely on simple pairwise comparisons, enabling a clearer understanding and
490
differentiation of the results.
491
Another contribution of the paper is the presentation of a concrete case of occupational risk
492
assessment related to the use of a diffused work equipment in the construction sector, including the
493
exemplification of each step of the HFD methodology. This contribution is more relevant to practice
494
in this industry, but it is also useful to advance the scientific knowledge regarding ontologies in the
495
adoption of task-based ORA models.
5.4. Limitations 497
However, despite these positive aspects, the present study presents some limitations. Firstly, the
498
computational efforts required to apply the ANP approach might be problematic and
time-499
consuming for unexperienced practitioners. The development of a procedure based on the
500
implementation of an ease-to-use software can certainly reduce this drawback, making the usability
501
of the HFD methodology larger and more suitable for an unexperienced audience. Similarly, the
502
role of costs related to safety measures should also be taken into account to provide companies with
503
a more complete approach [78-80]. Then, in the experts group, a difficulty emerged when the
504
effects of noise and vibrations were considered, hence these concerns not taken into account in the
505
final results. To address these limitations, a more detailed differentiation of possible consequences
506
might help engineers in providing better results. The implementation of fuzzy logic could also
507
facilitate the assessment of this type of hazardous effects, further reducing possible errors or
508
inconsistencies in the evaluation [34, 81]. Finally, it has to be underlined that the results were
509
obtained from a single case study. Hence, while the use of a single case-study as a research tool for
510
exploratory investigation and to generate new understandings is recognized by several authors
[82-511
83], caution is needed when generalizing the findings [84].
512 513
6. Conclusions
514
This study proposes a novel tool, based on the integrated use of QFD and ANP, which is aimed at
515
supporting safety managers in performing risk assessment of working tasks in the construction
516
sector. Practical results showed that the HFD approach can be used for the risk assessment
517
effectively, allowing engineers to obtain the priority of hazards and possible consequences, and thus
518
of the interventions aimed at increasing the safety level of the working activities considering the
519
mutual relationships among these factors, while reducing the ambiguity of qualitative assessment
520
criteria used in traditional risk assessment activities. Hence, this study can provide a basis for the
development of occupational risk assessment methodologies and for practitioners in this type of
522
industry. This article is the result of an initial stage of development of the HFD approach: to
523
augment its validity reducing the above-mentioned limitations further work is needed. Currently,
524
both the development of a procedure based on the use of an ease-to-use software as well as its
525
application to different industries, e.g. the agricultural sector that presents similar peculiarities from
526
the occupational safety point of view [85-87], are being analyzed.
527 528 529
References
530
[1] Cheng CW, Leu SS, Lin, CC et al. Characteristic analysis of occupational accidents at small
531
construction enterprises. Saf Sci. 2010;48(6):698-707.
532
[2] Arquillos AL, Romero JCR, Gibb A. Analysis of construction accidents in Spain, 2003-2008. J
533
Saf Res. 2012;43(5):381-388.
534
[3] Sousa V, Almeida NM, Dias LA. Risk-based management of occupational safety and health in
535
the construction industry–Part 1: Background knowledge. Saf Sci. 2014;66:75-86.
536
[4] HSE (Health and Safety Executive). European comparisons. [internet] 2016 [cited 2017 Nov
537
30]. Available from: www.hse.gov.uk/copyright.htm
538
[5] Cornelissen PA, Van Hoof JJ, De Jong MD. Determinants of safety outcomes and performance:
539
A systematic literature review of research in four high-risk industries. J Saf Res.
2017;62:127-540
141.
541
[6] Jo BW, Lee YS, Kim JH et al. Trend analysis of construction industrial accidents in Korea from
542
2011 to 2015. Sustain. 2017;9(8):1297.
543
[7] European Agency for Safety and Health at Work (EU-OSHA). Estimating the cost of
work-544
related accidents and ill-health: An analysis of European data sources. [internet] 2017 [cited
545
2017 Dec 13]. Available from:
https://osha.europa.eu/en/tools-and-546
publications/publications/estimating-cost-work-related-accidents-and-ill-health-analysis/view
547
[8] Lombardi M, Rossi G. Cluster analysis of fatal accidents series in the Infor.mo database:
548
analysis, evidence and research perspectives. Int J Saf Secur Eng. 2013;3(4):317-331.
[9] Dumrak J, Mostafa S, Kamardeen I et al. Factors associated with the severity of construction
550
accidents: The case of South Australia. Constr Econ Build. 2013;13(4):32-49.
551
[10] Forteza FJ, Carretero-Gómez JM, Sese A. Occupational risks, accidents on sites and economic
552
performance of construction firms. Saf Sci. 2017;94:61-76.
553
[11] Fargnoli M, De Minicis M, Di Gravio G. Knowledge Management integration in Occupational
554
Health and Safety systems in the construction industry. Int J Prod Dev. 2011:14(1-4);165-185.
555
[12] Guarascio M, Lombardi M, Rossi G et al. Risk analysis and acceptability criteria. WIT Trans.
556
Built Environ. 2007;94:131-138.
557
[13] Suárez-Cebador M, Rubio-Romero JC, López-Arquillos A. Severity of electrical accidents in
558
the construction industry in Spain. J Saf Res. 2014;48:63-70.
559
[14] Ersoy M. A Proposal on Occupational Accident Risk Analysis: A Case Study of a Marble
560
Factory. Hum Ecol Risk Assess: Int J. 2015;21(8):2099-2125.
561
[15] Forteza FJ, Sese A, Carretero-Gómez J.M. CONSRAT. Construction sites risk assessment tool.
562
Saf Sci. 2016;89;338-354.
563
[16] Gangolells M, Casals M, Forcada N et al. Mitigating construction safety risks using prevention
564
through design. J Saf Res.2010;41(2):107-122.
565
[17] Underwood P, Waterson P. Systemic accident analysis: examining the gap between research
566
and practice. Accid Anal Prev. 2013;55:154-164.
567
[18] Mitropoulos P, Cupido G, Namboodiri M. Cognitive approach to construction safety: Task
568
demand-capability model. J Constr Eng Manag. 2009;135(9):881-889.
569
[19] Sousa V, Almeida NM, Dias LA. Risk-based management of occupational safety and health in
570
the construction industry–Part 2: Quantitative model. Saf Sci. 2015;74:184-194.
571
[20] Parise G, Parise L, Lombardi M. Collision theory in electric shock risk assessment. In AEIT
572
Annual Conference-From Research to Industry: The Need for a More Effective Technology
573
Transfer. 2014 Sept 18-19; Trieste, Italy: IEEE; 2014. p.1-4.
574
[21] Zhou Z, Goh YM, Li Q. Overview and analysis of safety management studies in the
575
construction industry. Saf Sci. 2015;72:337-350.
576
[22] Hinze JW, Teizer J. Visibility-related fatalities related to construction equipment. Saf Sci.
577
2011;49(5):709-718.
[23] Khosravi Y, Asilian-Mahabadi H, Hajizadeh E et al. Factors influencing unsafe behaviors and
579
accidents on construction sites: a review. Int J Occup Saf Ergon. 2014;20(1):111-125.
580
[24] Chong HY, Low TS. Accidents in Malaysian construction industry: statistical data and court
581
cases. Int J Occup Saf Ergon. 2014;20(3):503-513.
582
[25] Jafari MJ, Gharari M, Ghafari M et al. An epidemiological study of work-related accidents in a
583
construction firm. Saf Promot Inj Prev. 2015;2(3):196-203.
584
[26] Marsh SM, Fosbroke DE. Trends of occupational fatalities involving machines, United States,
585
1992–2010. Am J Ind Med. 2015;58(11):1160-1173.
586
[27] Seifi Azad Mard HR, Estiri A, Hadadi P et al. Occupational risk assessment in the construction
587
industry in Iran. Int J Occup Saf Ergon. 2017;23(4):570-577.
588
[28] Jaafar MH, Arifin K, Aiyub K et al. Occupational safety and health management in the
589
construction industry: a review. Int J Occup Saf Ergon. 2017;1-14.
590
[29] Aneziris ON, Papazoglou IA, Konstandinidou M et al. Quantification of occupational risk
591
owing to contact with moving parts of machines. Saf Sci. 2013;51(1):382-396.
592
[30] Sadeghi L, Dantan JY, Mathieu L et al. A design approach for safety based on Product-Service
593
Systems and Function–Behavior–Structure. CIRP J Manuf Sci Technol. 2017;9:44-56.
594
[31] Akao Y, Quality function deployment: Integrating customer requirements into product design.
595
Cambridge, MA: Productivity Press;1990.
596
[32] Sadeghi L, Dantan JY, Siadat A et al. Design for human safety in manufacturing systems:
597
applications of design theories, methodologies, tools and techniques. J Eng Des.
598
2016;27(12):844-877.
599
[33] Fargnoli M, Sakao T. Uncovering differences and similarities among quality function
600
deployment-based methods in design for X: Benchmarking in different domains. Qual Eng.
601
2017;29(4):690-712.
602
[34] Liu HT, Tsai YL. A fuzzy risk assessment approach for occupational hazards in the
603
construction industry. Saf Sci. 2012;50(4):1067-1078.
604
[35] Bas E. An integrated quality function deployment and capital budgeting methodology for
605
occupational safety and health as a systems thinking approach: The case of the construction
606
industry. Accid Anal Prev. 2014;68:42-56.
607
[36] Fabiano B, Currò F, Pastorino R. A study of the relationship between occupational injuries and
608
firm size and type in the Italian industry. Saf Sci 2004;2(7):587-600.
[37] Kines P, Andersen D, Andersen LP et al. Improving safety in small enterprises through an
610
integrated safety management intervention. J Saf Res. 2013;44:87-95.
611
[38] Holte KA, Kjestveit K, Lipscomb HJ. Company size and differences in injury prevalence
612
among apprentices in building and construction in Norway. Saf Sci. 2015;71:205-212.
613
[39] Gunduz M, Laitinen H. A 10-step safety management framework for construction small and
614
medium-sized enterprises. Int J Occup Saf Ergon. 2017;23(3):353-359.
615
[40] Saaty TL. Fundamentals of the analytic network process-Dependence and feedback in
616
decision-making with a single network. J Sys Sci Sys Eng. 2004;13(2):129-157.
617
[41] Karwowski W. Ergonomics and human factors: the paradigms for science, engineering, design,
618
technology and management of human-compatible systems. Ergon. 2005;48(5):436-463.
619
[42] Fargnoli M, Laurendi V, Tronci M. Design for safety in agricultural machinery. In: Marjanovic
620
D, Storga M, Pavkovic N, Bojcetic N, editors, Proceedings of the 11th Int. Design Conference;
621
2010 May 17-20; Dubrovnik (Croatia); 2010; p. 701-710.
622
[43] Grote G. Safety management in different high-risk domains–All the same? Saf Sci
623
2012;50(10):1983-1992.
624
[44] Lombardi M, Guarascio M, Rossi G. The Management of Uncertainty: model for evaluation of
625
human error probability in railway system. Am J Appl Sci. 2013;11(3):381-390.
626
[45] Seker S, Recal F, Basligil H. A Combined DEMATEL and Grey System Theory Approach for
627
Analyzing Occupational Risks: A Case Study in Turkish Shipbuilding Industry. Hum Ecol Risk
628
Assess: Int J. 2017;23(6):1340-1372.
629
[46] Hale A, Kirwan B, Kjellén U. Safe by design: where are we now?. Saf Sci.
2007;45(1):305-630
327.
631
[47] Rausand M, Utne IB. Product safety–Principles and practices in a life cycle perspective. Saf
632
Sci. 2009;47(7);939-947.
633
[48] Lombardi M, Fargnoli M. Prioritization Of Hazards By Means Of A Qfd-Based Procedure. Int
634
J Saf Secur Eng. 2018;8(2):342-353.
635
[49] ISO, 2012. ISO/TR 14121-2:2012 - Safety of machinery - Risk assessment - Part 2: Practical
636
guidance and examples of methods. International Organization for Standardization, Geneva.
637
[50] Horberry T, Burgess-Limerick R. Applying a human-centred process to re-design equipment
638
and work environments. Saf. 2015;1(1):7-15.
[51] Horberry T, Burgess-Limerick R, Cooke T et al. Improving Mining Equipment Safety Through
640
Human-Centered Design. Ergon Des. 2016;24(3):29-34.
641
[52] Pinto A, Nunes IL, Ribeiro RA. Occupational risk assessment in construction industry–
642
Overview and reflection. Saf Sci. 2011;49(5):616-624.
643
[53] Wang HH, Boukamp F. Ontology-based representation and reasoning framework for
644
supporting job hazard analysis. J Comput Civil Eng. 2011;25(6):442-456.
645
[54] Rausand M. Job Safety Analysis. In: Rausand M, editor. Risk Assessment: Theory, Methods,
646
and Applications. Hoboken (NJ): John Wiley & Sons; 2011. p. 457-468.
647
[55] Rozenfeld O, Sacks R, Rosenfeld Y, et al. Construction job safety analysis. Saf Sci.
648
2010;48(4):491-498.
649
[56] Zhang S, Boukamp F, Teizer J. Ontology-based semantic modeling of construction safety
650
knowledge: Towards automated safety planning for job hazard analysis (JHA). Autom Constr.
651
2015;52:29-41.
652
[57] Büyüközkan G, Ertay T, Kahraman C et al. Determining the importance weights for the design
653
requirements in the house of quality using the fuzzy analytic network approach. Int J Intell
654
Syst. 2004;19(5):443-461.
655
[58] Kahraman C, Ertay T, Büyüközkan G. A fuzzy optimization model for QFD planning process
656
using analytic network approach. Eur J Op Res. 2006;171(2):390-411.
657
[59] Patriarca R, Di Gravio G, Mancini M et al. Change management in the ATM system:
658
integrating information in the preliminary system safety assessment. Int J Appl Decis Sci.
659
2016;9(2):121-138.
660
[60] Lam JSL. Designing a sustainable maritime supply chain: A hybrid QFD–ANP approach.
661
Transp Res Part E: Logist Transp Rev. 2015;78:70-81.
662
[61] Zaim S, Sevkli M, Camgöz-Akdağ H et al. Use of ANP weighted crisp and fuzzy QFD for
663
product development. Expert Syst Appl. 2014;41(9):4464-4474.
664
[62] Buckley CC. Delphi technique supplies the classic result?. Austral Library J.
1994;43(3):158-665
164.
666
[63] Grisham T. The Delphi technique: a method for testing complex and multifaceted topics. Int J
667
Manag Proj Bus. 2009;2(1):112-130.
[64] Italian Workers’ Compensation Authority (INAIL). Database concerning occupational
669
accidents and injuries. [internet]; 2017 [cited 2017 Nov 13]. Available from:
670
http://bancadaticsa.inail.it/bancadaticsa/bancastatistica.asp?cod=2
671
[65] Lipscomb HJ, Schoenfisch AL, Shishlov KS. Non-fatal contact injuries among workers in the
672
construction industry treated in US emergency departments, 1998-2005. J Saf Res.
673
2010;41(3):191-195.
674
[66] Shibuya H, Cleal B, Kines P. Hazard scenarios of truck drivers’ occupational accidents on and
675
around trucks during loading and unloading. Accid Anal Prev. 2010;42(1):19-29.
676
[67] Aminbakhsh S, Gunduz M, Sonmez R. Safety risk assessment using analytic hierarchy process
677
(AHP) during planning and budgeting of construction projects. J Saf Res. 2013;46:99-105.
678
[68] Ericson CA. Hazard analysis techniques for system safety. Hoboken (NJ): John Wiley & Sons;
679
2015; p. 124-144.
680
[69] Foussard C, Denis-Remis CRisk assessment: methods on purpose?. Int J Process Sys Eng
681
2014;2(4):337-352.
682
[70] Ayağ Z, Özdemir RG. An analytic network process-based approach to concept evaluation in a
683
new product development environment. J Eng Des. 2007;18(3):209-226.
684
[71] Raharjo H, Brombacher AC, Xie M. Dealing with subjectivity in early product design phase: A
685
systematic approach to exploit Quality Function Deployment potentials. Comput Ind Eng.
686
2008;55(1):253-278.
687
[72] Büyüközkan G, Berkol Ç. Designing a sustainable supply chain using an integrated analytic
688
network process and goal programming approach in quality function deployment. Expert Sys
689
Appl. 2011;38(11):13731-13748.
690
[73] Samantra C, Datta S, Mahapatra SS. Analysis of occupational health hazards and associated
691
risks in fuzzy environment: a case research in an Indian underground coal mine. Int J Inj
692
Control Saf Promot. 2017;24(3):311-327.
693
[74] Bohm J, Harris D. Risk perception and risk-taking behavior of construction site dumper
694
drivers. Int J Occup Saf Ergon. 2010;16(1):55-67.
695
[75] Kines P, Spangenberg S, Dyreborg J. Prioritizing occupational injury prevention in the
696
construction industry: Injury severity or absence? J Saf Res. 2007;38(1):53-58.
697
[76] Narasimhan G, Crowe TG, Peng Y, et al. A task-based analysis of machinery entanglement
698
injuries among Western Canadian farmers. J Agromedicine. 2011;16(4):261-270.
[77] Sadhana C, Shanmugapriya S. Assessment of Risk in Construction Projects by Modified Fuzzy
700
Analytic Hierarchy Process. Int Res J Eng and Technol. 2017;4(3):1695-1700.
701
[78] Thompson KM, Graham JD. Going beyond the single number: using probabilistic risk
702
assessment to improve risk management. Hum Ecol Risk Assess: Int J. 1996;2(4):1008-1034.
703
[79] Etherton J, Taubitz M, Raafat H et al. Machinery risk assessment for risk reduction. Hum Ecol
704
Risk Assess: Int J. 2001;7(7):1787-1799.
705
[80] Fargnoli M, Pighini U. SCRM: A new design tool for improving safety level of mechanical
706
systems. In: Folkeson A, Gralen K, Norell M, Sellgren U, editors. Proceedings of the 14th Int.
707
Conference on Engineering Design; 2003 Aug 19-21; Stockholm (Sweden); 2003.
708
[81] Guneri AF, Gul M, Ozgurler S. A fuzzy AHP methodology for selection of risk assessment
709
methods in occupational safety. Int J Risk Assess Manag. 2015;18(3-4):319-335.
710
[82] Voss C, Tsikriktsis N, Frohlich M. Case research in operations management. International J
711
Oper Prod Manag. 2002;2(2):195-219.
712
[83] Yin RK. Case study research: design and methods (3rd edition). Sage Publications. Thousand
713
Oaks (CA); 2003.
714
[84] Reddy KS. The state of case study approach in mergers and acquisitions literature: A
715
bibliometric analysis. Future Bus J. 2015;1(1);13-34.
716
[85] Fargnoli M, Vita L, Gattamelata D et al. A reverse engineering approach to enhance machinery
717
design for safety. In: Marjanovic D, Storga M, Pavkovic N, Bojcetic N, editors, Proceedings of
718
the 12th Int. Design Conference; 2012 May 21-24; Dubrovnik (Croatia); 2012; p. 627-636.
719
[86] Caffaro F, Roccato M, Cremasco MM et al. Part-time farmers and accidents with agricultural
720
machinery: a moderated mediated model on the role played by frequency of use and unsafe
721
beliefs. J. Occup Health. 2018;60(1):80-84.
722
[87] Pillay, M. Accident causation, prevention and safety management: a review of the
state-of-the-723
art. Procedia Manuf. 2015;3:1838-1845.
724 725
Table 1. The ANP judgement scores when considering two characteristics A and B.
Judgement Rule Score
Equal If A and B have the same behaviour/performance in relation to the assessment
criterion 1
Moderate If the performance of A is moderately higher than the B’s one. 2-3
Strong If the performance of A is strongly higher than the B’s one. 4-5
Very strong If the performance of A is much higher than the B’s one. 6-7
Table 2. Values of the Random Index (RI) depending on the number of elements [34]. Number of elements (m) 3 4 5 6 7 8 9 10 11 12 13 14 15 Value of the Random Index (RI) 0.52 0.89 1.11 1.25 1.35 1.40 1.45 1.49 1.52 1.54 1.56 1.58 1.59
Table 3. Types of causal factors that lead to fatal accidents in the period 2008-2015 (source: [59]).
CAUSAL FACTORS 2008 2009 2010 2011 2012 2013 2014 2015
Hit by falling materials when
operating the machinery 3
Unintended movement of
the truck/Roll over 2 1 1 1
Contact with the machinery
parts 1 1
Unintended starting of the
machinery 1 1
Hit by ejected materials 1
Electric shock (direct) 1 1 1
![Table 2. Values of the Random Index (RI) depending on the number of elements [34]. Number of elements (m) 3 4 5 6 7 8 9 10 11 12 13 14 15 Value of the Random Index (RI) 0.52 0.89 1.11 1.25 1.35 1.40 1.45 1.49 1.52 1.54 1.56 1.](https://thumb-us.123doks.com/thumbv2/123dok_us/10934600.2982164/31.892.111.781.176.272/table-values-random-depending-elements-number-elements-random.webp)
![Table 3. Types of causal factors that lead to fatal accidents in the period 2008-2015 (source: [59])](https://thumb-us.123doks.com/thumbv2/123dok_us/10934600.2982164/32.892.142.754.175.474/table-types-causal-factors-fatal-accidents-period-source.webp)