Kristian Koerselman
Tuomas Pekkarinen
The timing of puberty and
gender differences in
educational achievement
VATT WORKING PAPERS
97
The timing of puberty and
gender differences in
educational achievement
Kristian Koerselman
Tuomas Pekkarinen
Valtion taloudellinen tutkimuskeskus VATT Institute for Economic Research
Kristian Koerselman, FIER and School of Business and Economics, University
of Jyväskylä, [email protected]
Tuomas Pekkarinen, VATT Institute for Economic Research,
[email protected]
ISBN 978-952-274-204-9 (PDF)
ISSN 1798-0291 (PDF)
Valtion taloudellinen tutkimuskeskus
VATT Institute for Economic Research
The timing of puberty and gender differences in
educational achievement
VATT Institute for Economic Research
VATT Working Papers 97/2017
Kristian Koerselman – Tuomas Pekkarinen
Abstract
In this paper, we study the effect of the timing of puberty on educational
achievement and examine to what extent the gender differences in the timing of
puberty can explain gender differences in achievement. We use British cohort
data that combine information on pubertal development with test scores,
behavioral outcomes as well as final educational attainment and earnings.
Controlling for age 7 cognitive skills and family background, we show that late
pubertal development is associated with a slower rate of cognitive skill growth
during adolescence. This disadvantage in cognitive development is also reflected
in lower levels of educational attainment and earnings for late developed
individuals. The number of late developing boys is however too small to explain
more than a fraction of the gender gap in educational outcomes. Furthermore, we
find no effects on self-discipline or other behavioral outcomes in adolescence,
suggesting a mechanism wholly separate from other causes of the gender gap.
Key words:
ducation, gender, adolescence, puberty, cognitive skills,
non-cognitive skills, attainment, earnings
1
Introduction and background
The emergence of female dominance on virtually all available measures of educational attainment has attracted a lot of attention and sparked a debate on the potential causes of these gender differences. The recent literature has particularly emphasized the role of non-cognitive skills. It is often found that the gender gap is larger when outcome measures are more easily affected by effort, and gender differences in self-discipline and other non-cognitive skills have been shown to be able to explain a substantial part of the overall gap. (Jacob, 2002; Silverman, 2003; Duckworth & Seligman, 2006).
The drivers of observed gender gaps in both behavior and educational out-comes remain unclear. In this paper we draw attention to one very robust gender difference in development during adolescence: the timing of puberty. It is a well-known fact that girls mature earlier than boys, and since the gender difference in pubertal development is greatest during the years in which important secondary education decisions are taken, it is often cited as one potential cause of gender differences in adolescents’ behavioral problems, educational attainment and in their later educational achievement.
We use the British National Child Development Study (NCDS) to examine the effects of the timing of pubertal development. The NCDS has the unique feature of combining information on pubertal development with educational and labor market outcomes at various ages. Furthermore, the data contain a rich set of questions on problem behavior and academic motivation during adolescence as well as test scores that measure cognitive skills at different ages. Using this information, we examine whether pubertal development affects education and labor market outcomes directly or indirectly through its effects on behavior and cognitive development, and whether these effects are likely to contribute to the observed gender differences in education today. Boys and girls go through puberty at different ages, with boys typically trail-ing girls by one to two years. At age 15–16, most girls have emerged from puberty, while a sizable portion of boys are typically still undergoing im-portant physical changes (Tanner, 1962; Steinberg, 2014). Several studies have documented the association between the timing of puberty and various educational outcomes for both sexes. For boys, it is in fact almost univer-sally found that early developing students do better at school. For example
consequentially have lower levels of educational attainment in adulthood.1 There are however various reasons to suspect that the correlations reported in the earlier literature do not reflect the true effect of the timing of puberty on attainment. First of all, since the measurement of puberty is intrusive when performed by a professional, many of the studies cited above rely on self-assessments. The available evidence suggests that self-assessed measures of pubertal development are very noisy.2 Furthermore, we should be worried
that children who develop unusually early or late are less likely to agree to participate in these kinds of studies at all.
Second, as shown in Susman & Dorn (2009), the timing of puberty is corre-lated with childhood circumstances such as malnutrition, obesity, stress, and other problems in early life. These factors are likely to have direct effects on educational outcomes, and can be correlated with other background factors that affect education negatively. Though it is debatable what exactly should be held constant when discussing the causal effects of the timing of puber-tal development, it seems clear that differences in childhood circumstances should be adjusted for. This is an issue which is regrettably often overlooked in existing studies.
Simple correlations also do not tell us anything about the mechanisms through which puberty affects educational outcomes. The previous literature has shown that puberty is correlated with the development of both cognitive and non-cognitive skills. For example, a meta-study by Newcombe & Dubas (1987) shows that pubertal development and IQ are positively correlated for both genders. There is also evidence that suggests that childhood cognitive skills can account for a large part of the correlation between pubertal devel-opment and adult outcomes. For example, Case & Paxson (2008) show that the correlation of adult earnings and physical growth during adolescence, re-ported in Persico et al. (2004), disappears when one controls for cognitive development. On the other hand, puberty can have behavioral effects that are related to hormonal changes during puberty (Peper & Dahl, 2013). These behavioral changes may in turn affect educational outcomes negatively. In the present study, we try to address these issues by using data from the NCDS. The NCDS has sampled members of the 1958 birth cohort in the United Kingdom, with regular follow-ups that are still being carried out today. A unique feature of these data is that they contain information on
1The evidence on girls is less conclusive with some studies, such as Dreber et al. (2011),
finding evidence of a negative relationship while others, such as Koivusilta & Rimpelä (2004) find no relationship.
the timing of pubertal development as asserted by a medical professional at relatively low levels of non-response. The pubertal development information in the NCDS can furthermore be linked to earlier-age cognitive test scores as well as to a rich set of control variables for family background. In addition, the NCDS contains questions that can be used to measure behavioral changes during adolescence.
We contribute to the literature by showing that late developing children experience lower cognitive skill growth between ages 7 and 16, even when adjusting for other background variables as well as for non-response on the pubertal development measures. Furthermore, this effect of late development on educational attainment seems to be independent of the behavioral effects of puberty for which we actually do not find any evidence once the family background and early childhood skills are controlled for. This evidence is consistent with what we know of roughly coinciding, qualitative changes in cognitive functioning in adolescence (cf. Steinberg, 2008; Blakemore et al., 2010).
Our results also suggest that the timing of pubertal development affects adult outcomes such as final educational attainment and wages through cognitive development at age 16. Once controls for age 16 tests scores are included, the correlation of pubertal development and attainment disappears while that with earnings is diminished. Since boys develop later than girls, the cognitive effects of the timing of puberty explain a part of the gender gap in educational outcomes. However, quantitatively this is a small effect. Even if very late developing boys do substantially worse in school, their numbers are not large enough to substantially affect the mean gap.
The rest of the paper proceeds as follows. In the next section we present the data and the empirical strategy that we use in our analysis. We present our results in the third section. The fourth section concludes.
2
Data
The main challenge in studying the association between pubertal develop-ment and educational attaindevelop-ment is to find data sets that combine reliable measures of both these variables. Here, we use the UK National Child
De-The NCDS aims to follow all those living in Great Britain that were born in the week starting on the 3rd of March 1958, and involves frequent follow-ups. It has been used widely in the literature. In particular, several authors such as Persico et al. (2004) and Case & Paxson (2008) have used these data to study how adolescent height affects adult outcomes.
2.1
Puberty measures
In the 1974 sweep, when the sample was 16 years old, the NCDS respondents were subjected to a medical examination which, among other things, collected information on pubertal development.3 The details that were recorded
in-cluded the development of pubic and axillary hair for both genders (1 absent; 2 sparse; 3 intermediate; 4 adult), the development of facial hair for boys (1 absent; 2 sparse; 3 adult) and of breast development for girls (1 absent; 2 intermediate; 3 adult). These measurements roughly follow Tanner’s stages of pubertal development (Tanner, 1962) which is still the standard that is followed in the scaling of physical development during adolescence.
To reduce their dimensionality and to facilitate analysis, we create a single summary measure by adding the three different measures of pubertal devel-opment together and rescaling the resulting sum to the 0–1 interval. On this measure, a value of 0 thus indicates that the respondent’s pubertal develop-ment was assessed to be ‘absent’ on all three variables, and a value of 1 that the respondent’s development was ‘adult’ on all three variables. Through-out the analysis, we report estimates as predicted conditional differences in outcomes between these two (mostly hypothetical) extremes.
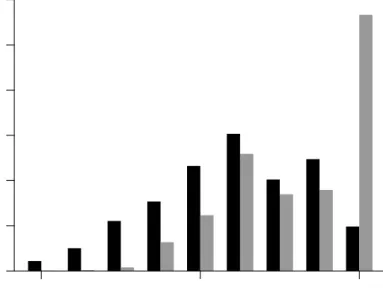
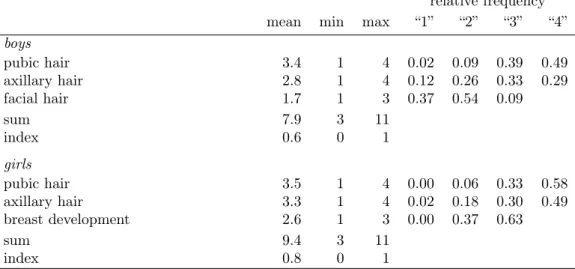
Table 1 reports the summary statistics of the puberty measures in the NCDS data by gender. As is clear from the table, these measures of pubertal devel-opment reveal large gender differences in develdevel-opment at age 16 in the NCDS cohort. While for example 11% of boys have absent or sparse pubic hair, and 38% have absent or sparse axillary hair, the same proportions for girls are 7% and 20% respectively. Our summary measures of pubertal development also clearly reflect these gender differences. The mean difference between girls and boys is 0.2 but, as can be seen from Figure 1, this mean difference masks much larger differences in the shape of the distribution of pubertal
3The NCDS also contains puberty measurements at age 11. However, these correlate
poorly with the age 16 development measures, and should be expected to have a weaker relationship with the cognitive changes that occur towards the end of puberty. Age 16 is also when students make important educational choices concerning secondary education so we would expect the differences in the timing of puberty at age 16 to be more important for educational achievement.
development index across gender. Whereas, girls are clearly concentrated at the higher end of the distribution with the mode of 1 indicating full maturity, boys are more evenly spread across the distribution. Indeed, at the lower end of the distribution there are only boys.
Figure 1: The distribution of the pubertal development index for boys (black bars) and girls (grey bars). Girls are clearly concentrated at the higher end of the distribution with the mode of 1 indicating full maturity, while boys are more evenly spread across the distribution.
0 0.5 1 0 300 600 900 1200 1500 1800 individuals
Table 1: Pubertal development measures
relative frequency
mean min max “1” “2” “3” “4”
boys pubic hair 3.4 1 4 0.02 0.09 0.39 0.49 axillary hair 2.8 1 4 0.12 0.26 0.33 0.29 facial hair 1.7 1 3 0.37 0.54 0.09 sum 7.9 3 11 index 0.6 0 1 girls pubic hair 3.5 1 4 0.00 0.06 0.33 0.58 axillary hair 3.3 1 4 0.02 0.18 0.30 0.49 breast development 2.6 1 3 0.00 0.37 0.63 sum 9.4 3 11 index 0.8 0 1
Notes: The sum of the three individual pubertal development measures has a range of 3–11. The index rescales this linearly to 0–1. The scale for the variables that take four values are 1: Absent, 2: Sparse, 3: Intermediate, 4: Adult. For the variables that take three values they are 1: Absent, 2: Sparse, 3: Adult.
2.2
Background variables
To account for background characteristics that may be correlated with the timing of puberty and educational attainment, we use the rich NCDS infor-mation on family background and cognitive ability. We control for the indi-vidual’s background and childhood circumstances using father’s and mother’s educational attainment by ISCED level, as well as levels of father’s social status based on his occupation when the sample member was born. In the NCDS, the social class of the father is based on the 1958 interviews of the subjects’ mothers who were asked about their husbands’ occupations, and separated into six levels. We add as a separate category that the father is missing or that the information is otherwise unavailable. We similarly add separate categories for missing parental education information. Finally, we add dummy variables for eleven regions of residence at age 16, for gender, as well as interactions of all controls with gender.
In addition to the family background variables, the NCDS allows us to control for early test scores that can serve as a control for baseline childhood cognitive ability. The NCDS subjects took standardized test at ages 7, 11, and 16. We use age 7 test scores as controls for pre-pubertal cognitive skills. These scores
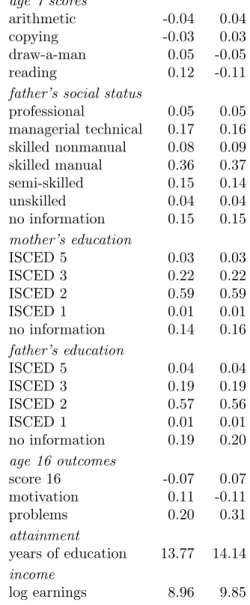
Table 2: Sample means of main covariates and outcomes by gender. girls boys age 7 scores arithmetic -0.04 0.04 copying -0.03 0.03 draw-a-man 0.05 -0.05 reading 0.12 -0.11
father’s social status
professional 0.05 0.05 managerial technical 0.17 0.16 skilled nonmanual 0.08 0.09 skilled manual 0.36 0.37 semi-skilled 0.15 0.14 unskilled 0.04 0.04 no information 0.15 0.15 mother’s education ISCED 5 0.03 0.03 ISCED 3 0.22 0.22 ISCED 2 0.59 0.59 ISCED 1 0.01 0.01 no information 0.14 0.16 father’s education ISCED 5 0.04 0.04 ISCED 3 0.19 0.19 ISCED 2 0.57 0.56 ISCED 1 0.01 0.01 no information 0.19 0.20 age 16 outcomes score 16 -0.07 0.07 motivation 0.11 -0.11 problems 0.20 0.31 attainment years of education 13.77 14.14 income log earnings 8.96 9.85
are the results of a word recognition and word comprehension tests, a copying designs test to assess perceptuo-motor abilities, a draw-a-man test to assess general mental and perceptual abilities, and an arithmetic test.
Table 2 reports the mean values of the background variables by gender. As should be expected, parental background variables do not differ by gender. However, there are clear gender differences in the levels of test scores at age 7. Whereas boys do better in arithmetic and copying tests, girls have an advantage in draw-a-man and reading tests.
2.3
Outcome variables
The NCDS follow-up at age 16 provides us with a rich set of variables that we can use to examine the effect of pubertal development on cognitive abilities and behavior. At age 16, sample members were administered a mathematics and a reading test. By design, raw reading scores are strongly negatively skewed, and to avoid overweighting students with poor reading skills as well as to aid in the interpretation of regression coefficients, we map each set of scores onto a standard normal distribution.
To create a measure of motivation, effort and self-discipline, we use the age 16 student survey questions ‘I feel school is a waste of time’, ‘I am quiet in the classroom and get on with my work’, ‘I think homework is a bore’, ‘I find it difficult to keep my mind on my work’, ‘I never take work seriously’, ‘I don’t like school’, ‘I think there is no point in planning for the future; you should take things as they come’ and ‘I’m always ready to help the teacher’, as well as a teacher rating of whether she thinks the sample member is hardworking. We further create a measure of problem behavior by combining survey questions about whether the sample member has been in contact with the police, has ever been to court, whether the parents have arguments about their child drinking, as well as two measures of truancy.
We need to combine each group of outcome variables into one. Unlike the pubertal development index, the cognitive skill scores and the motivation variables do not have a natural, easily intepreted scale. We therefore extract the first principal component from either group of variables using Principal Component Analysis or PCA. Principal components are essentially weighted sums of the original variables. Variables receive more weight if they correlate more strongly with the other variables in the group, the intuition being that they are less noisy measures of the underlying trait. For the cognitive skill scores, only two measures are available, and so the first principal compo-nent reduces to the unweighted mean of the two normalized scores. For the
motivation-related variables, the weights are available in Appendix A. We will express estimates of effects on cognitive skill scores and motivation in sample standard deviations throughout.
We follow a different approach for problem behavior. For three quarters of the sample no problems are indicated at all while for the remaining quarter the child will usually be reported to display more than one problem at once, even if a greater number of problem indications does not necessarily indicate graver problems. This makes a summed measure hard to interpret. We therefore instead measure whether the child displays problem behavior at all with an indicator variable equaling one when the child has been reported to have problems on any of these measures.
We use the educational attainment measure from the seventh NCDS sweep at age 46. The attainment information in the seventh sweep is cumulative, so that the information would for example also be available for an individual missing from the seventh sweep, but not from the sixth. The exact degrees available to individuals as well as their associated grading scales differ from area to area, and we convert all attainment information to years of education to maintain comparability across regions.
As a measure of earnings, we take mean log earnings in the most recent job measured at ages 33 and at 42. Different respondents report amounts corresponding to different payment periods, and so we annualize all amounts before logarithmizing. For individuals who report take home pay but not earnings, we impute earnings from take home pay within the sweep. We use the mean of the two logarithmized yearly earnings observations in our analysis.
Table 2 reports gender differences in the mean values of our outcome variables in the data. In the case of some of the outcome variables examined in Table 2, gender differences differ from what we would observe for the cross section of the UK population today. In particular, women of the 1958 cohort have lower levels of completed educational attainment than men. In addition, women score lower in tests at age 16. However, the rest of the gender differences in the outcome variables are less surprising: girls have higher levels of academic motivation and are less likely to get into trouble during adolescence. Adult women also have lower labour market earnings than men.
2.4
Sample selection, missing observations and
imputa-tion
There are several groups of variables in our analysis that we think of as mea-sures of a single latent trait. These are age 7 scores, pubertal development measures, measures of motivation and self-discipline, measures of problem behavior, the two age 16 test scores, and earnings at the two different ages. Many individuals have missing values on some of the measures of these traits. Discarding the data on all of these individuals would result in loss of infor-mation.
We deal with the problem of missing values on trait measures by first drop-ping all the individuals who have missing values on all measures of any single trait. However, for about a third of the remaining individuals we have in-formation on at least one measure for each trait but missing values on some measures within traits. In the main sample, the information for this one third is about 90% complete on average.
In order to avoid loosing too much information, we impute the missing values from the other measures within each group by using the regularized itera-tive PCA imputation algorithm4 under the assumption that missingness on
individual subscores is random. Intuitively, this procedure is similar to fill-ing in missfill-ing values with the mean of the (appropriately scaled) available variables for the same individual. For example, an individual for whom the standardized score in age 16 mathematics is lacking will thus get it imputed by his or her standardized age 16 reading score.
For the age 7 scores, there are also teacher ratings of the children’s skills available, and we use ratings of oral ability, awareness of the world, reading skills, creativity, and quickness to learn to help impute age 7 test scores. On principle, we find imputation of missing subscores much preferable to completely dropping the affected individuals from the sample. We neverthe-less include in the appendix variations of our main regression tables where we exclude all individuals with imputed information. These turn out to be substantially similar to the main tables.
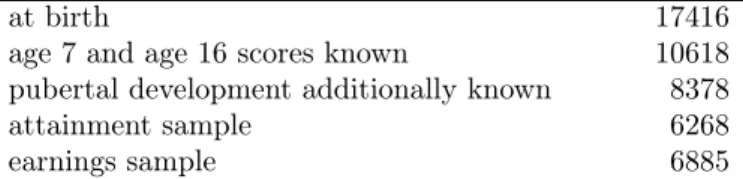
As can be seen from Table 3, the number of individuals observed in the NCDS at birth is 17416. Even after imputation, the number of individuals drops to less than half when we require key age 0, 7 and age 16 as well as pubertal development information to be available, though this is mostly due to missing observation on age 7 and age 16 test scores. We do not find strong
patterns in sample attrition at age 16, and treat it as random conditional on covariates. It should be noted that the NCDS has made a great effort to trace cohort members that could not be traced through their local schools, among others by using government registers as well as local and national media, thus likely reducing potential effects of for example school dropout on non-response. As we will show below, completely missing information on the pubertal development variables is uncommon enough that our main result is qualitatively robust even when such students are all assumed to have a pubertal development index of 0, or alternatively 1.
Table 3: Sample sizes
individuals
at birth 17416
age 7 and age 16 scores known 10618
pubertal development additionally known 8378
attainment sample 6268
earnings sample 6885
3
Results
Raw outcome penalties for late developing individuals may be confounded by factors that are simultaneously correlated with pubertal development and educational outcomes, such as for example health problems in early child-hood. NCDS data allow us to alleviate this problem by controlling for the various age 7 test scores, levels of father’s socio-economic status, levels of fa-ther’s and mofa-ther’s education, and geographic region, as well as interactions of all of these with the child’s gender. In this section, we present results from regressions where our age 16 test scores and final educational attainment as well as earnings in adulthood are regressed on the puberty development index.
To get a first glimpse at the potential relationships between pubertal develop-ment and our outcome and control variables, we report the raw correlations between these measures in Table 4. One noteworthy aspect of Table 4 is the
Table 4: Sample correlations between pubertal development, a linearized in-dex of father’s social status, the first principal component of age 7 test scores, measures of motivation and self-discipline as well as of problem behavior, the first principal component of age 16 test scores, years of education and mean log earnings.
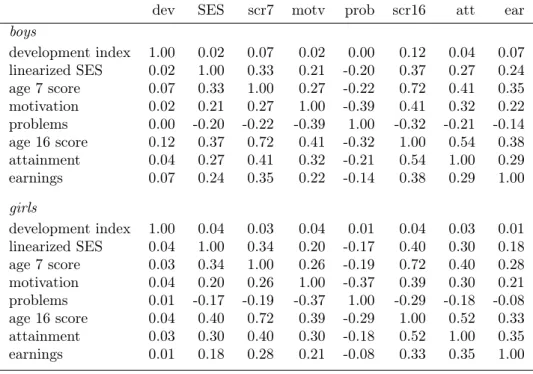
dev SES scr7 motv prob scr16 att ear
boys development index 1.00 0.02 0.07 0.02 0.00 0.12 0.04 0.07 linearized SES 0.02 1.00 0.33 0.21 -0.20 0.37 0.27 0.24 age 7 score 0.07 0.33 1.00 0.27 -0.22 0.72 0.41 0.35 motivation 0.02 0.21 0.27 1.00 -0.39 0.41 0.32 0.22 problems 0.00 -0.20 -0.22 -0.39 1.00 -0.32 -0.21 -0.14 age 16 score 0.12 0.37 0.72 0.41 -0.32 1.00 0.54 0.38 attainment 0.04 0.27 0.41 0.32 -0.21 0.54 1.00 0.29 earnings 0.07 0.24 0.35 0.22 -0.14 0.38 0.29 1.00 girls development index 1.00 0.04 0.03 0.04 0.01 0.04 0.03 0.01 linearized SES 0.04 1.00 0.34 0.20 -0.17 0.40 0.30 0.18 age 7 score 0.03 0.34 1.00 0.26 -0.19 0.72 0.40 0.28 motivation 0.04 0.20 0.26 1.00 -0.37 0.39 0.30 0.21 problems 0.01 -0.17 -0.19 -0.37 1.00 -0.29 -0.18 -0.08 age 16 score 0.04 0.40 0.72 0.39 -0.29 1.00 0.52 0.33 attainment 0.03 0.30 0.40 0.30 -0.18 0.52 1.00 0.35 earnings 0.01 0.18 0.28 0.21 -0.08 0.33 0.35 1.00
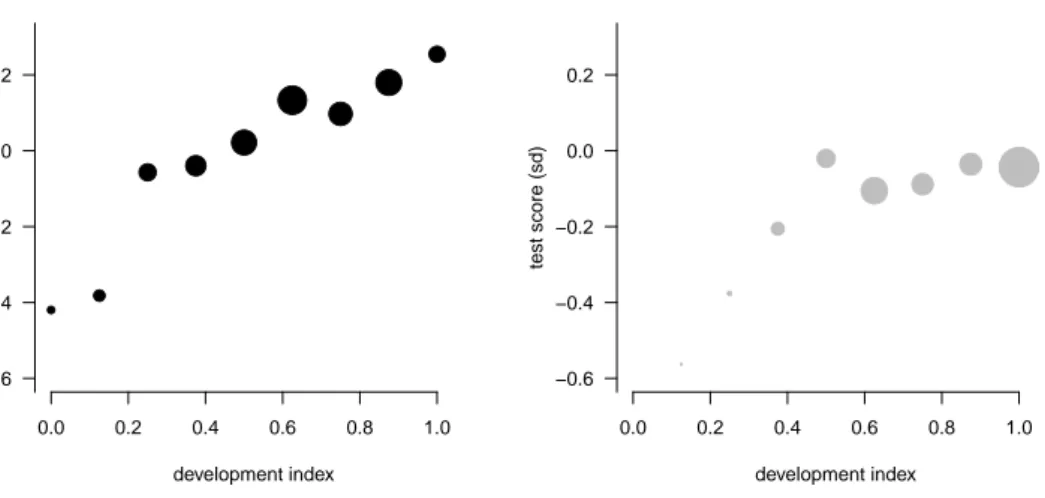
Figure 2: Raw pubertal development gradients in age 16 test scores for boys (black) and girls (grey).
● ● ● ● ●
●
● ● ● boys development index test score (sd) 0.0 0.2 0.4 0.6 0.8 1.0 −0.6 −0.4 −0.2 0.0 0.2 ● ● ● ● ● ● ● girls development index test score (sd) 0.0 0.2 0.4 0.6 0.8 1.0 −0.6 −0.4 −0.2 0.0 0.2The outcome is the age 16 test score expressed in sample standard deviations. Circle areas are proportional to the number of individuals in each bin. Black circles represent boys, grey circles girls.
signs. This is an indication that these variables all contain useful amounts of signal, and that, for example, the lack of correlation between pubertal de-velopment and problem behavior is unlikely to be due to measurement error dominating the variation in the latter two variables.
Figure 2 plots the relationship between pubertal development and age 16 test scores for both boys and girls. Circle areas are proportional to the number of individuals in each bin. As can be seen from the figure, the relationship between pubertal development and test scores is highly concave, at the very least for boys. Though the average slope is significantly smaller for girls than for boys, this is not necessarily the case because the relationship between pubertal development and test scores differs between genders. Rather the difference in slope occurs because more girls than boys are located on the flatter part of the curve at the upper end of the scale. In fact, we cannot statistically reject that the slope is equal across genders conditional on the level of pubertal development. In what follows, we will allow the relationship between pubertal development and our outcomes of interest to be quadratic, and estimate the relationship jointly for both boys and girls. The reader should keep in mind the lack of support for girls in the lower end of the scale, and that the group of very late developing individuals is thus almost the same as the group of very late developing boys.
3.1
Age 16 outcomes and pubertal development
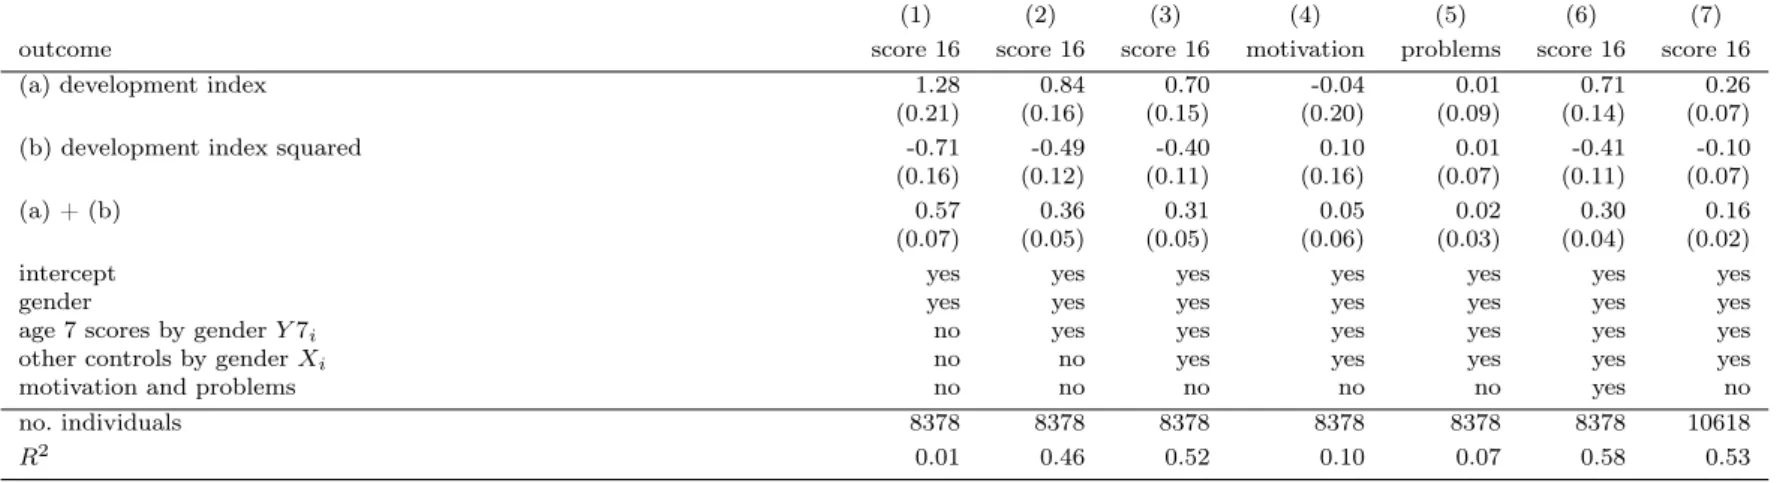
We next turn to regression models. In the first specification of Table 5, we regress age 16 scores on the pubertal development index and its square in-cluding only gender as a control. Because the point estimates and associated standard errors of the individual linear and quadratic development terms are not of primary interest in and of themselves, we sum these terms and cal-culate the standard error of the sum from the variance-covariance matrix. These are reported as (a)+(b) in the tables. Since the original development index varies from 0 to 1, a change in the sum of the linear and quadratic terms from 0 to 1 should be interpreted as representing the total conditional change in development between prepubescent and fully mature individuals. The estimate of the association between pubertal development and test scores conditional on gender only is 0.57 standard deviations for an increase in the development index from fully prepubescent (i.e. 0) to fully matured (1). In other words, conditional on gender only, the test score gap between fully developed individuals and individuals who are still at the onset of puberty is estimated to be more than half a standard deviation. Furthermore, this
Table 5: Regression estimates of the pubertal development gradient in age 16 outcomes.
(1) (2) (3) (4) (5) (6) (7) outcome score 16 score 16 score 16 motivation problems score 16 score 16 (a) development index 1.28 0.84 0.70 -0.04 0.01 0.71 0.26 (0.21) (0.16) (0.15) (0.20) (0.09) (0.14) (0.07) (b) development index squared -0.71 -0.49 -0.40 0.10 0.01 -0.41 -0.10 (0.16) (0.12) (0.11) (0.16) (0.07) (0.11) (0.07) (a) + (b) 0.57 0.36 0.31 0.05 0.02 0.30 0.16 (0.07) (0.05) (0.05) (0.06) (0.03) (0.04) (0.02)
intercept yes yes yes yes yes yes yes
gender yes yes yes yes yes yes yes
age 7 scores by genderY7i no yes yes yes yes yes yes
other controls by genderXi no no yes yes yes yes yes
motivation and problems no no no no no yes no no. individuals 8378 8378 8378 8378 8378 8378 10618
R2 0.01 0.46 0.52 0.10 0.07 0.58 0.53
number is reasonably precisely estimated at a standard error of 0.07.
In column (2) of Table 5 we add the scores from the four age 7 cognitive skill tests and their interactions with gender as controls to our regressions. This has the effect of reducing the estimated effect of development by two fifths to 0.36. When we also include controls for father’s social status, the educational attainment of both parents and child’s region of residence, again all interacted with gender, the estimated effect of pubertal development is further reduced to 0.31 standard deviations. This illustrates that the raw correlations between the timing of pubertal development and other outcomes sometimes reported in the existing literature are in part reflecting a selection into the timing of puberty rather than a more direct effect. At the same time, the age 16 score difference by pubertal development conditional on all of these variables is still precisely estimated and large.
As was discussed at the outset, one channel through which pubertal develop-ment is often perceived to affect educational outcomes is through its effects on behavior and non-cognitive outcomes. In columns (4) and (5) of Table 5 we explore this channel by regressing our age 16 measures of educational mo-tivation and problem behavior on pubertal development respectively. Both regressions include the same controls as the test score regression in column (3). Our estimates are close to zero for both estimates, and not significantly different from zero from either. These results confirm the pattern already ob-served in the raw correlations and do not give any support to the hypothesis that the timing of pubertal development would be associated with behavioral or motivational problems during adolescence.
Behavioral and motivational problems are also not the channel through which pubertal development affects educational outcomes. When we in column (6) change the specification of column (3) to also include motivation and prob-lem behavior as controls, the estimate is virtually unchanged at 0.30. Given that both our motivation and problem measures are reasonably strongly cor-related with test scores, it is unlikely that they would simply be too noisy to pick up an effect. We thus interpret our estimates in columns (4) through (6) as suggestive evidence for the observed test score gradient in pubertal development being due to a relationship with the timing of cognitive rather than of non-cognitive development. Furthermore, since motivation seems unaffected, this suggests a mechanism wholly separate from the gender gap in effort, motivation and self-discipline that have previously been shown to explain a substantial part of the gender gap in educational outcomes around age 16.
puber-tal development variables, we create a separate sample which also includes all individuals who are missing on our pubertal development index, but are otherwise present in the data up until age 16. In practice, these individuals perform rather averagely conditional on covariates. Setting these individuals’ pubertal development index to either 0 or 1 therefore attenuates our estimate, with an assumed pubertal development index of 0 having the largest attenu-ating effect. In column (7) we rerun specification (3) doing just this, but even then the pubertal development gradient is still estimated to be significantly positive. Given that the prevalence of such low development index values is extremely low in the rest of the sample, this suggests to us that missing values on our pubertal development index are not likely to have affected our estimates by a substantial amount.
3.2
Adult outcomes
We next turn to adult outcomes. In Table 6 we report the results of a speci-fication similar to the one in Table 5, but with adult educational attainment as the outcome variable, expressed in years of education. The association between the pubertal development index and final educational attainment is strong and positive. Very early developing individuals are estimated to complete almost half a year of education more than very late developing in-dividuals, even conditional on covariates such age 7 test scores. Hence, late developing individuals not only score lower on age 16 tests but also obtain fewer years of schooling than early maturers.
In columns (2)–(3) of Table 6 we explore to what extent the positive associa-tion between educaassocia-tional attainment and the timing of puberty is driven by the effect of late maturity on cognitive development reported above. Since age 16 test scores are not observed for all the 6,268 individuals in column (1) of Table 6, we first replicate the regression of column (1) with the sample of individuals for whom we can observe the age 16 test scores. For this smaller sample, a specification identical to the one in column (1) yields an estimate of 0.38 years of education. When we control for age 16 scores in column (3), the same estimate is effectively reduced to zero. Although these estimates have lower precision, they support the hypothesis that the timing of puberty af-fects long-term outcomes through its efaf-fects on cognitive development during
Table 6: Regression estimates of the pubertal development gradient in edu-cational attainment.
specification (1) (2) (3)
outcome attainment attainment attainment (a) development index 1.05 0.80 -0.05 (0.63) (0.69) (0.64) (b) development index squared -0.60 -0.42 0.06 (0.48) (0.52) (0.49)
(a) + (b) 0.45 0.38 0.01
(0.20) (0.22) (0.20)
gender yes yes yes
age 7 scores by genderY7i yes yes yes
other controls by genderXi yes yes yes
age 16 scores no no yes
no. individuals 6268 5406 5406
R2 0.20 0.20 0.31
Notes: the outcome is age 46 educational attainment measured in years of education.
women. When running the same regression with log earnings as the outcome in columns (1) and (4), we find a conditional difference of 0.16 years for men, which is significantly different from zero. For women, the estimated difference between early and late developers is only 0.04 years, and far from significant.
Again, restricting the analysis to those individuals for whom we can observe the age 16 test scores reduces the sample size, and we repeat the regressions of columns (1) and (4) for these smaller samples in columns (2) and (5). This yields similar results as the larger sample. In columns (3) and (6) we examine to what extent the effect of pubertal development on adult earnings is mediated through cognitive skills at age 16. The effect on log earnings is somewhat reduced for men when adding controls for age 16 test scores between specifications (2) and (3). However, these estimates are not precise enough to enable us conclude much about the difference. For women, the point estimate is not affected at all.
The results in tables 6 and 7 suggest that late pubertal development can have long-lasting consequences. Individuals who were more or less prepubescent at age 16 have clearly lower levels of educational attainment at adulthood than those who were almost mature by age 16 even after controlling for factors such as cognitive skills at age 7 and family background. For men, we also find negative effects on earnings. However, our results also suggest that these effects are mediated through the effect of pubertal development on cognitive skills during adolescence. Once we control for cognitive development at age 16, the effect of the timing of puberty on attainment is reduced to zero, while
Table 7: Regression estimates of the pubertal development gradient in earnings.
specification (1) (2) (3) (4) (5) (6)
outcome log earnings log earnings log earnings log earnings log earnings log earnings
sample men men men women women women
(a) development index 0.28 0.10 0.07 -0.08 0.05 0.05 (0.17) (0.18) (0.17) (0.49) (0.51) (0.50) (b) development index squared -0.12 0.01 0.00 0.09 -0.01 -0.01 (0.14) (0.15) (0.15) (0.33) (0.34) (0.34)
(a) + (b) 0.16 0.12 0.08 0.01 0.04 0.04
(0.04) (0.05) (0.05) (0.17) (0.17) (0.17)
gender yes yes yes yes yes yes
age 7 scores by genderY7i yes yes yes yes yes yes
other controls by genderXi yes yes yes yes yes yes
age 16 scores no no yes no no yes
no. individuals 3335 2847 2847 3550 3089 3089
R2 0.15 0.14 0.18 0.10 0.11 0.14
it may or may not reduce the effect on male earnings. We interpret this pattern of results as suggestive that the interaction of the education system and pubertal development can create lock-in effects, causing a potentially temporary delay in cognitive development to have permanent consequences.
3.3
Pubertal development and gender differences in
ed-ucational attainment
Gender differences in the timing of pubertal development are often cited as a one potential factor behind the much discussed gender differences in ed-ucational attainment. As our results indicate a clear negative relationship between late pubertal development and cognitive skill growth during adoles-cence, it is natural to ask to what extent gender differences in the timing of puberty can explain gender differences in educational attainment.
Unfortunately, the NCDS data are not ideal for the study of factors behind the type of gender differences in educational attainment that we observe today. In the British 1958 birth cohort, male educational attainment is still
higher than female attainment. Even though girls were more motivated and
disciplined than boys in this cohort, and displayed less problem behavior, some of the causes of the current female dominance in educational attainment were clearly either not present at the time when members of this cohort made their educational choices, or were at the time more than compensated for by other factors. We can however still examine to what extent differences in the timing of pubertal development contribute to the gender differences observed in our data.
In Figure 3 we plot mean regression-adjusted test scores at age 16 and regression-adjusted adult educational attainment for men and women at dif-ferent levels of age 16 pubertal development. Circle areas are proportional to the number of individuals in each bin. These figures show again how almost all of the late developers are men, and that late developers have lower test scores and lover levels of educational attainment.
However, Figure 3 also shows the the number of individuals in the lower tail of the pubertal development distribution is low. Indeed, most of the mean gender difference of 0.2in the development index occurs at the higher levels of the index, where the relationship between pubertal development and outcomes is flatter. When we simulate by how much the gender gap in age 16 test scores changes when we give boys the pubertal development distribution of girls, the mean of the boys’ distribution only improves by 0.03 standard
Figure 3: Regression-adjusted pubertal development gradients in age 16 test scores (left panel) and attainment (right panel) for men (black circles) and women (grey circles).
● ● ● ● ● ● ● ● ● ● ● ●
●
● ● ● development indexregression−adjusted test score (sd)
0.0 0.2 0.4 0.6 0.8 1.0 −0.4 −0.3 −0.2 −0.1 0.0 0.1 0.2 0.3 ● ● ● ● ● ● ● ● ● ● ●
●
● ● ● development index regression−adjusted y ears of education 0.0 0.2 0.4 0.6 0.8 1.0 −0.6 −0.4 −0.2 0.0 0.2 0.4Regression-adjusted test scores from specification (3) in Table 5 and regression-adjustment educational attainment at age 49 from specification (1) in Table 6. Circle areas are pro-portional to the number of individuals in each bin.
deviations. This suggests that pubertal development plays a minor role in explaining overall gender differences in educational attainment.
4
Conclusions
Gender difference in the timing of puberty is a well-established biological fact that has often been suggested as a one potential explanation for the female dominance in educational attainment in most developed countries. In this study, we use the NCDS to show that physically late developing children experience substantially smaller gains in cognitive test scores between ages 7 and 16 than children who mature earlier.
ed-16 test scores are controlled for, the estimated relationship between pubertal development and educational attainment is estimated to be zero, while the estimate of the relationship with earnings is reduced. This finding is sugges-tive of educational lock-in, where educational choices made at age 16 have lasting effects even if the cognitive disadvantage may otherwise well have been temporary.
Though our results suggest that the differential timing of pubertal devel-opment is a contributing cause of the gender gap in educational outcomes, the most substantially negative outcomes occur in the far left tail of the pubertal development distribution. The number of individuals at these ex-treme values of late puberty is low, and gender differences the timing of pubertal development are thus likely to be only a minor contributor to the observed gender differences in educational attainment. The fact that we find that non-cognitive skills at age 16 remain unaffected suggests a mechanism wholly separate from the well-documented gender gap in non-cognitive skills.
5
Acknowledgments
The authors were supported by the Strategic Research Council at the Academy of Finland (293445). We appreciate useful help and comments from Sharon Simonton, Jonas Vlachos, Roope Uusitalo, Petri Böckerman, Mika Korte-lainen, as well as from participants in various workshops and conferences.
References
Arnett, J. J. (1999). Adolescent storm and stress, reconsidered. American psychologist, 54, 317.
Blakemore, S.-J., Burnett, S., & Dahl, R. E. (2010). The role of puberty in the developing adolescent brain. Human brain mapping, 31, 926–933. Case, A., & Paxson, C. (2008). Stature and status: Height, ability, and labor
market outcomes. Journal of Political Economy,116.
Dreber, A., Von Essen, E., & Ranehill, E. (2011). Age at pubertal onset and educational outcomes. Available at SSRN 1934188, .
Dubas, J., Graber, J., & Petersen, A. (1991). The effects of pubertal develop-ment on achievedevelop-ment during adolescence. American Journal of Education, 99, 444–460.
Duckworth, A. L., & Seligman, M. E. (2006). Self-discipline gives girls the edge: Gender in self-discipline, grades, and achievement test scores. Jour-nal of educatioJour-nal psychology, 98, 198.
Flannery, D. J., Torquati, J. C., & Lindemeier, L. (1994). The method and meaning of emotional expression and experience during adolescence. Journal of adolescent Research, 9, 8–27.
Jacob, B. (2002). Where the boys aren’t: non-cognitive skills, returns to school and the gender gap in higher education. Economics of Education review,21, 589–598.
Josse, J., & Husson, F. (2012). Handling missing values in exploratory mul-tivariate data analysis methods. Journal de la Société Française de Statis-tique, 153, 79–99.
Koivusilta, L., & Rimpelä, A. (2004). Pubertal timing and educational ca-reers: a longitudinal study. Annals of human biology, 31, 446–465.
Newcombe, N., & Dubas, J. (1987). Individual differences in cognitive abil-ity: are they related to timing of puberty. In R. Lerner, & T. Foch (Eds.), Biological-psychological interactions in early adolescence: a life-span
per-Persico, N., Postlewaite, A., & Silverman, D. (2004). The effect of adolescent experience on labor market outcomes: The case of height. Journal of Political Economy, 112, 1019–1053.
Rasmussen, A. R., Wohlfahrt-Veje, C., de Renzy-Martin, K. T., Hagen, C. P., Tinggaard, J., Mouritsen, A., Mieritz, M. G., & Main, K. M. (2015). Validity of self-assessment of pubertal maturation. Pediatrics,135, 86–93. Silverman, I. W. (2003). Gender differences in delay of gratification: A
meta-analysis. Sex roles,49, 451–463.
Steinberg, L. (2008). A social neuroscience perspective on adolescent risk-taking. Developmental review, 28, 78–106.
Steinberg, L. (2014). Adolescence. McGraw-Hill.
Steinberg, L., & Morris, A. (2001). Adolescent development. Journal of Cognitive Education and Psychology, 2, 55–87.
Susman, E. J., & Dorn, L. D. (2009). Puberty: Its role in development. Handbook of adolescent psychology, .
Tanner, J. (1962). Growth at adolescence.. Springfield, Ill.
University of London. Institute of Education. Centre for Longitudinal Studies (2008). National Child Development Study: Local Authority Data, 1958-1974: Special Licence Access [computer file]. 2nd Edition. Colchester, Essex: UK Data Archive [distributor], August 2008. SN: 5744.
A
Principal components
Table 8: Motivation factor loadings
variable weight
I feel school is a waste of time 0.37
I am quiet in the classroom and get on with my work 0.30
I think homework is a bore 0.36
I find it difficult to keep my mind on my work 0.35
I never take work seriously 0.39
I don’t like school 0.41
I think there is no point in planning for the future 0.21
I’m always ready to help the teacher 0.20
teacher assessment: hardworking 0.34
B
Subscore imputation
We impute missing subscores using the regularized iterative PCA imputation algorithm (cf. Josse & Husson, 2012, section 3) under the assumption that missingness on individual subscores is random.
The algorithm initially sets the missing values at the sample mean of each subscore. After that, it iteratively estimates a principal component model on all individuals, and replaces the originally missing values with model es-timates. These last two steps are repeated until convergence. In Tables 9 and 10, we repeat our main specifications on a series of samples from which we have dropped individuals with any imputed information in the variables used. The resulting estimates are very similar to the ones originally obtained.
Table 9: Regression estimates of the pubertal development gradient in age 16 outcomes, unimputed information only.
(1) (2) (3) (4) (5) (6) (7) outcome score 16 score 16 score 16 motivation problems score 16 score 16 (a) development index 1.42 0.92 0.77 -0.11 -0.07 0.86 0.33 (0.22) (0.16) (0.15) (0.22) (0.11) (0.17) (0.09) (b) development index squared -0.81 -0.54 -0.44 0.12 0.07 -0.48 -0.11 (0.17) (0.12) (0.12) (0.17) (0.08) (0.13) (0.09) (a) + (b) 0.61 0.37 0.32 0.01 0.00 0.38 0.23 (0.07) (0.05) (0.05) (0.07) (0.03) (0.05) (0.03)
intercept yes yes yes yes yes yes yes
gender yes yes yes yes yes yes yes
age 7 scores by genderY7i no yes yes yes yes yes yes
other controls by genderXi no no yes yes yes yes yes
motivation and problems no no no no no yes no no. individuals 7712 7712 7712 7115 6109 5675 6558
R2 0.02 0.46 0.52 0.09 0.08 0.58 0.52
Notes: outcomes are the standardized age 16 test score, the standardized index of age 16 motivation, and an indication of age 16 problem behavior. The sample mean of the latter variable is 0.26. Standard errors have been added in parentheses.
Table 10: Regression estimates of the pubertal development gradient in ed-ucational attainment, unimputed information only.
specification (1) (2) (3)
outcome attainment attainment attainment (a) development index 1.10 0.83 -0.14 (0.65) (0.71) (0.67) (b) development index squared -0.66 -0.45 0.12 (0.49) (0.54) (0.50)
(a) + (b) 0.44 0.38 -0.03
(0.20) (0.22) (0.21)
gender yes yes yes
age 7 scores by genderY7i yes yes yes
other controls by genderXi yes yes yes
age 16 scores no no yes
no. individuals 5810 4988 4988
R2 0.20 0.20 0.31
Table 11: Regression estimates of the pubertal development gradient in earnings, unimputed information only.
specification (1) (2) (3) (4) (5) (6)
outcome log earnings log earnings log earnings log earnings log earnings log earnings
sample men men men women women women
(a) development index 0.36 0.24 0.18 0.02 0.03 0.10 (0.21) (0.22) (0.22) (0.69) (0.67) (0.65) (b) development index squared -0.18 -0.05 -0.03 -0.02 -0.02 -0.06 (0.18) (0.19) (0.18) (0.46) (0.45) (0.44)
(a) + (b) 0.18 0.19 0.15 0.00 0.01 0.04
(0.06) (0.06) (0.06) (0.24) (0.23) (0.22)
gender yes yes yes yes yes yes
age 7 scores by genderY7i yes yes yes yes yes yes
other controls by genderXi yes yes yes yes yes yes
age 16 scores no no yes no no yes
no. individuals 1742 1591 1591 1633 1639 1639
R2 0.17 0.17 0.19 0.11 0.11 0.17