University of Nebraska at Omaha
DigitalCommons@UNO
Publications since 2000
Center for Public Affairs Research
9-2008
2007 Nebraska Population Report
David J. Drozd
University of Nebraska at Omaha, [email protected]
Jerry Deichert
University of Nebraska at Omaha, [email protected]
Follow this and additional works at:
https://digitalcommons.unomaha.edu/cparpublications
Part of the
Public Affairs Commons
This Report is brought to you for free and open access by the Center for Public Affairs Research at DigitalCommons@UNO. It has been accepted for inclusion in Publications since 2000 by an authorized administrator of DigitalCommons@UNO. For more information, please contact
Recommended Citation
Drozd, David J. and Deichert, Jerry, "2007 Nebraska Population Report" (2008).Publications since 2000. 16. https://digitalcommons.unomaha.edu/cparpublications/16
2007 Nebraska Population Report
•
Historical State Population Counts and Trends
•
Historical State Components of Population Change
•
2000 – 2007 State, County, and City Population Estimates
•
2000 – 2007 State and County Components of Population Change
•
2000 and 2007 State and County Demographic Characteristics
•
2000 and 2007 State Population Pyramids
•
2000 – 2007 State and County Population Change by Race/Ethnicity
•
2000 – 2007 Population Change by City Size
Prepared By:
David Drozd, Jerry Deichert
The Center for Public Affairs Research
University of Nebraska at Omaha
6001 Dodge Street
Omaha, NE 68182
September 2008
Data in this report supersede prior Census Bureau population estimates presented in other
Nebraska population reports. This is especially important in 2007 as the Census Bureau
made adjustments to their estimates program methodology, which is presented here for
the first time. All estimates after Census 2000 have been revised to account for this
methodology change.
Questions or comments on this report should be directed to David Drozd at 402-554-2132
or
[email protected]
Note: The race totals for Census 2000 reported here may differ from other sources given the methodology of the estimates program, which forces the “some other race” category into the major race categories.
TABLE OF CONTENTS
Highlights...5
Release Schedule of Annual Population Estimates ...7
Terms and Definitions...8
PART 1: STATE DATA...9
Table 1: Annual Population Estimates and Change from Prior Year:
U.S., Nebraska 1900-2007 ...10
Figure 1: July 1 Annual U.S. and Nebraska Population: 1900 to 2007 ...12
Figure 2: Nebraska Population and Population Change: 1900 to 2007 ...13
Figure 3: Annual U.S. and Nebraska Percent Population Change: 1900 to 2007 .13
Table 2: Nebraska Population and Components of Change: 1930 to 2006 ...14
Figure 4: Nebraska Births, Deaths, and Natural Change: 1930 to 2006...16
Figure 5: Nebraska Components of Population Change: 1930 to 2006...16
Table 3: Annual Nebraska Population Estimates by Sex and Age:
April 1, 2000 to July 1, 2007 ...17
Figure 6: 2007 Nebraska Population by Sex and Five-Year Age Group:...20
Table 4: Nebraska Population by Race and Ethnicity: April 1, 2000 and
July 1, 2007...20
Figure 7: 2007 Nebraska Population by Sex and Five-Year Age Group:
White Alone, not Hispanic/Latino (Majority Population) ...21
Figure 8: 2007 Nebraska Population by Sex and Five-Year Age Group:
Non-White or Hispanic/Latino (Minority Population) ...21
Figure 9: 2007 Nebraska Population by Five-Year Age Group: Non-White or
Hispanic/Latino
(Minority Population) as a Percent of the State Total...22
Figure 10: 2000 Nebraska Population by Sex and Five-Year Age Group:
Total
Population...22
Figure 11: 2000 Nebraska Population by Sex and Five-Year Age Group:
White
Alone ...23
Figure 12: 2000 Nebraska Population by Sex and Five-Year Age Group:
Black or African American Alone ...23
Figure 13: 2000 Nebraska Population by Sex and Five-Year Age Group:
Asian
Alone ...24
Figure 14: 2000 Nebraska Population by Sex and Five-Year Age Group:
American Indian or Alaska Native Alone...24
Figure 15: 2000 Nebraska Population by Sex and Five-Year Age Group:
Hispanic
or
Latino/a...25
Figure 16: 2000 Nebraska Population by Sex and Five-Year Age Group:
White Alone not Hispanic or Latino/a (Majority Population) ...25
Figure 17: 2000 Nebraska Population by Sex and Five-Year Age Group:
Non-White or Hispanic or Latino/a (Minority Population) ...26
Figure 18: 2000 Nebraska Population by Five-Year Age Group: Non-White or
Hispanic or Latino/a (Minority Population) as a Percent of the State Total...26
PART 2: COUNTY DATA ...27
Map 1: Nebraska Counties Classified by Modified Urban Influence Code ...28
Table 5: Listing of Nebraska Counties Classified by Modified Urban
Influence
Code ...29
Table 6: Annual Estimates of the Population for Nebraska Counties:
April 1, 2000 to July 1, 2007 ...30
Table 7: Nebraska Population Estimates, Changes, and Rankings:
April 1, 2000 to July 1, 2007 ...33
Map 2: Population Change in Nebraska Counties: 1990-2000 and 2000-2007...36
Table 8: Population of Nebraska Metropolitan and Micropolitan Statistical
Areas: April 1, 2000 to July 1, 2007...37
Table 9: Nebraska Population Change Component Estimates:
April 1, 2000 to July 1, 2007 ...40
Map 3: Natural Change in Nebraska Counties: 1990-2000 and 2000-2007 ...43
Map 4: Net Migration in Nebraska Counties: 1990-2000 and 2000-2007 ...44
Table 10: County Population by Major Age Groups: July 1, 2007 ...45
Table 11: Annual Estimates of the White non-Hispanic (Majority)
Population for Nebraska Counties: April 1, 2000 to July 1, 2007...47
Table 12: Annual Estimates of the Non-White or Hispanic (Minority)
Population for Nebraska Counties: April 1, 2000 to July 1, 2007...50
Table 13: Annual Estimates of the Black Alone, Not Hispanic
Population for Nebraska Counties: April 1, 2000 to July 1, 2007...53
Table 14: Annual Estimates of the Hispanic or Latino
Population for Nebraska Counties: April 1, 2000 to July 1, 2007...56
PART 3: CITY AND TOWN DATA ...59
Table 15: Ranking of the Population of Nebraska Incorporated Cities:
July 1, 2007...60
Figure 19a: Number and Percentage of Nebraska Cities and Towns by
City Size Category: 2007 ...64
Figure 19b: Number of Persons and Percentage of Nebraska Population
Living in Cities by City Size Category: 2007...64
Table 16: Population of Nebraska Incorporated Places:
April 1, 2000 and July 1, 2007...65
Figure 20: Percent Population Change for All Cities in Various City Size
Categories: April 1, 2000 to July 1, 2007 ...71
Figure 21: Percent of Nebraska Cities within City Size Category Having
Population Growth: April 1, 2000 to July 1, 2007...71
Table 17: Population Added to Incorporated Cities Due to Annexation:
HIGHLIGHTS
This report shows annual estimates of the population for Nebraska and its counties and cities.
Demographic patterns and trends, including changes in the components of population change, are
illustrated. As the passage of time takes us further from Census 2000 and closer to the 2010
Census, it is important to see how official estimates show the specific changes that have been
occurring at both the state and local level. A summary of important aspects to note as one
peruses the tables and figures in this report follows below:
•
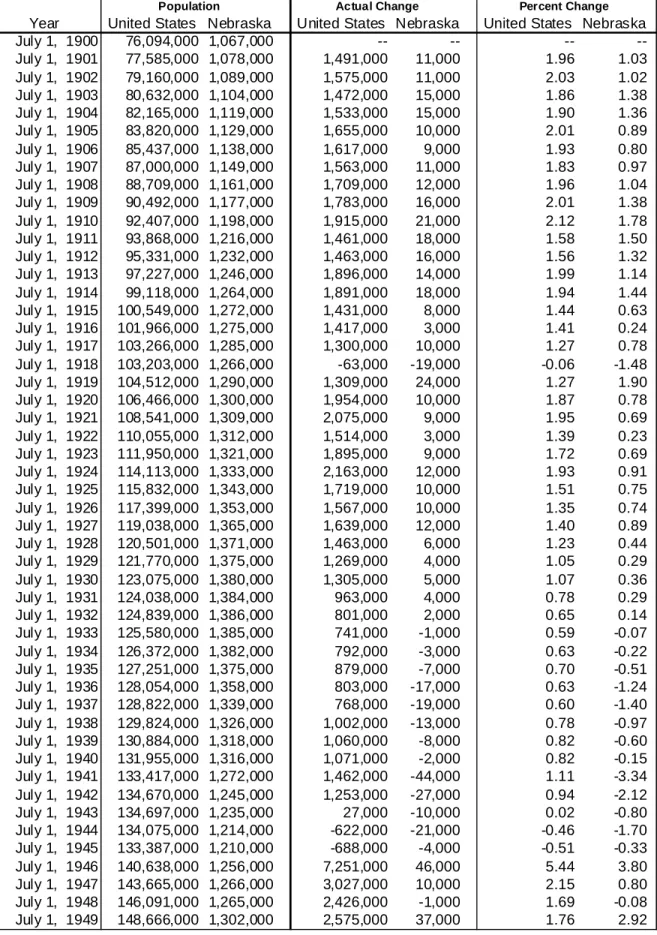
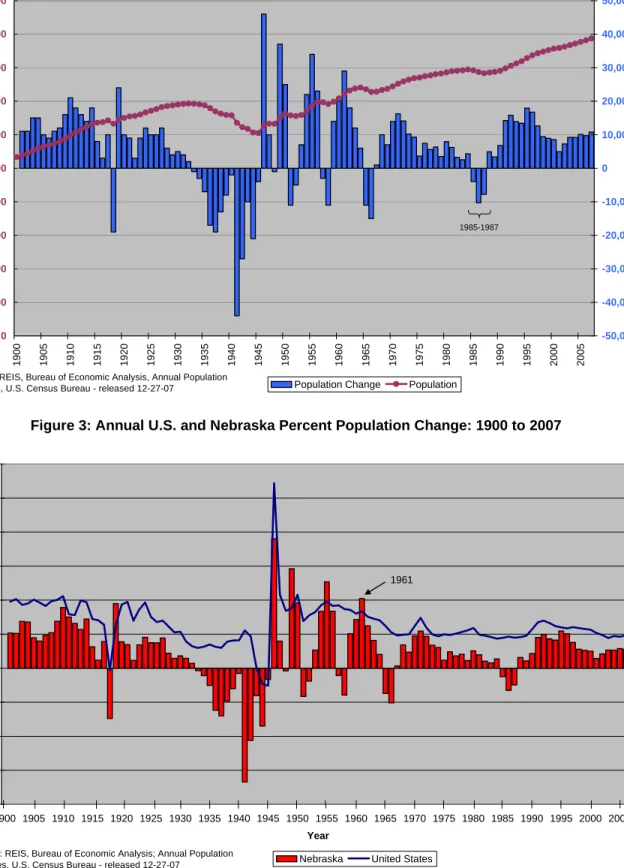
The state’s population has grown in 83 of the 107 years between 1900 and 2007. Most of the
years having population declines occurred during World Wars I and II or during or
immediately following the Great Depression (Table 1, Figure 1). The state’s population has
grown every year since 1987 (Figure 2).
•
The rate of population growth within Nebraska since 2000 has averaged about 0.5 percent
annually. This growth rate is similar to the mid 1970s to mid 1980s while annual growth
rates were around 1.0 percent during the 1990s (Table 1). The current rate of growth within
Nebraska is about half of the overall U.S. growth rate. The last time the annual growth rate in
Nebraska was higher than the overall U.S. average was 1961 (Figure 3). The 0.6 percent
growth rate between 2006 and 2007 was the largest Nebraska has experienced in 10 years,
since having 0.8 percent growth from 1996 to 1997 (Table 1).
•
Nebraska continues to gain population through natural increase—the annual number of births
being larger than the annual number of deaths. Net migration has tended to vary, with some
years having net inmigration, while net outmigration has occurred in other years. The level of
net migration is typically lower than that of natural change (Figure 5). Births and natural
change in 2006 were at their highest levels since 1982 (Table 2, Figure 4). The number of
births and level of natural change are projected to continue growing in the next several years
– see the Nebraska Births Report for details.
http://www.unomaha.edu/~cpar/documents/BirthReport.pdf
•
Sex and age pyramids show the majority population (non-Hispanic Whites) to be relatively
older than the minority population (Figures 7 and 8). The minority population is estimated to
represent more than 25 percent of the under 5 population and more than 15 percent of the
state’s total population in 2007 (Figure 9).
•
A methodology change in the Census Bureau’s estimates program generally increased
populations in urban parts of the state at the expense of more rural areas. Locations with
colleges or universities especially reflected upward revisions in the population estimates
versus data from prior years.
•
Populations in metropolitan counties have grown since 2000, while remaining about the same
in micropolitan counties (non-metropolitan counties with a city of 10,000 or more people)
and declining in the remaining non-metropolitan and non-micropolitan counties (Table 8; to
view the geographical distribution or a list of the counties in each of these categories, see
Map 1 and Table 5). Sarpy County had the largest growth rate at 19.7 percent between 2000
and 2007 while Blaine County had the most pronounced decline at 23.2 percent (Table 7).
•
The population has grown between 2000 and 2007 in 20 of Nebraska’s 93 counties. These
counties tend to be located in the eastern 1/3 of the state or along Interstate 80 (Map 2).
Twenty counties that experienced growth during the 1990s have had their populations decline
between 2000 and 2007.
•
Twelve of Nebraska’s 93 counties had fewer than 1,000 persons in 2007, 37 counties had less
than 5,000 persons, while the population in 68 counties was less than 10,000 persons.
•
While natural change has been positive at the state level every year since 1930, only about
half of Nebraska’s counties experienced more births than deaths between 2000 and 2007.
Natural increases tended to occur in the eastern 1/3 of the state and counties located along
Interstate 80 as well as some counties in the northwestern part of the state (Map 3).
•
Increases via net migration occurred between 2000 and 2007 in only 10 of Nebraska’s 93
counties. These counties tended to be located near Nebraska’s metropolitan centers of
Lincoln and Omaha. Net migration gains during the 1990s have not continued in 33 counties
as more residents have moved out than moved in between 2000 and 2007. The 2006
estimates now superseded had shown 17 counties with net inmigration and 27 who had
inmigration in the 1990s having outmigration since 2000.
•
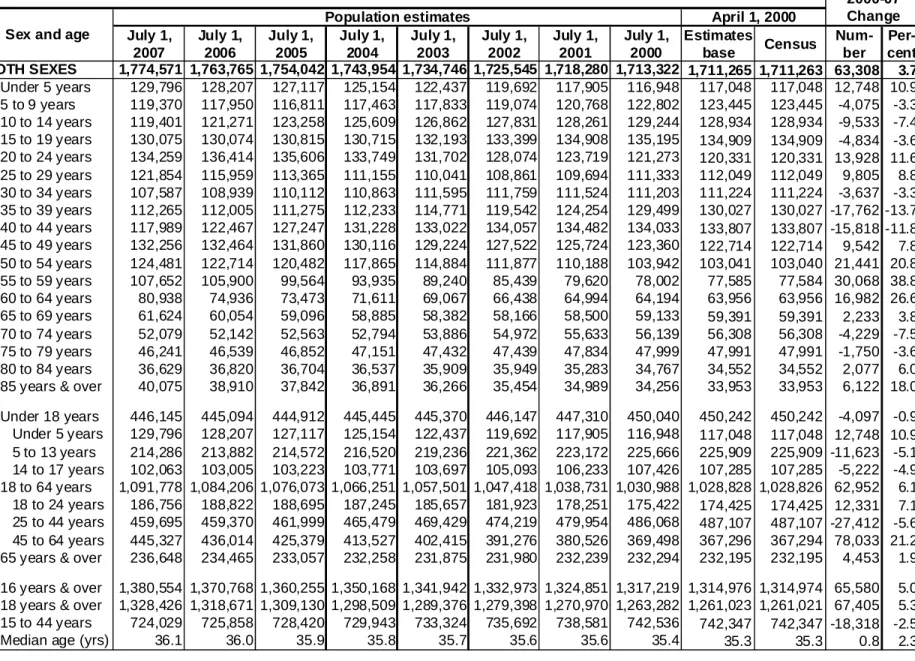
The percentage of county residents ages 65 and over increases as the county type becomes
increasingly rural. Those 65 and older comprise 10.4 percent of the population in
metropolitan counties, 15.3 percent in micropolitan counties, 18.1 percent in non-
metro/micro counties having a city with at least 2,500 residents, and 22.1 percent in
non-metro/micro counties without a city of 2,500 residents (Table 10). Nebraska’s population
continues to grow older, with the median age standing at 36.1 in 2007 compared to 35.3 in
2000 (Table 3).
•
The White non-Hispanic or majority population grew in only 10 of Nebraska’s 93 counties
between 2000 and 2007, while the minority population grew in all but two Nebraska counties
(Tables 11 and 12).
•
About 40 percent of Nebraska’s incorporated cities and towns had fewer than 250 persons in
2007 (Figure 19a). These cities comprised less than 2 percent of the state’s population living
in cities and towns (Figure 19b). The median size city in Nebraska had 320 persons,
represented by Brule, Hadar, Maxwell, and Phillips (Table 15).
•
By city size category, aggregate population change was similar among four city size
classifications under 1,000 residents at an approximate six percent decline. Those city size
categories over 1,000 residents had more variability, with those having 1,000 to 2,499
residents as well as 10,000 or more residents experiencing growth (Figure 20). The increase
in cities with 1,000 to 2,499 residents was solely due to dramatic growth in Gretna,
Nebraska’s fastest growing city – if Gretna is excluded from this analysis, the population in
this city size category declines by 3.9 percent.
•
Most cities with 10,000 or more residents experienced growth, while only a little more than
20 percent of cities having between 1,000 and 9,999 residents grew, with approximately 15
percent of those cities having fewer than 1,000 persons having growth between 2000 and
2007 (Figure 21).
RELEASE SCHEDULE OF ANNUAL POPULATION ESTIMATES
The following tables detail the schedule for data releases for annual population estimates
prepared by the Population Division of the United States Census Bureau. These estimates are
made for the nation, states, counties, and cities or towns. Estimates by sex, age, race, and
Hispanic origin are made for certain levels of geography. Released estimates generally measure
the population on July 1 of the previous year. The release dates below are approximate and the
exact month data are released may vary from year to year. New estimates released often have
adjustments to prior year’s estimates and supersede previous releases.
Data Description
Month Released
National and State population estimates
December (for July of that year)
National and State components of population change
December (for July of that year)
State estimates by sex and age
March (for July of previous year)
County
population
estimates
April (for July of previous year)
County components of population change
April (for July of previous year)
National estimates by sex, age, race, and Hispanic origin
May (for July of previous year)
City and Town population estimates
June (for July of previous year)
State estimates by sex, age, race, and Hispanic origin
July (for July of previous year)
County estimates by sex, age, race, and Hispanic origin August (for July of previous year)
Timeline Display of Annual Population Estimates Release Schedule
Data Released July 1 Aug Sep Oct Nov Dec Jan Feb Mar Apr May Jun Jul Aug
Population estimates N, S C P
Components of change N, S C
Population by sex and age S
Population by sex, age,
race, and Hispanic origin N S C
TERMS AND DEFINITIONS
We obtained the following terms and definitions from the Census Bureau estimates website
for reference. See
http://www.census.gov/popest/topics/terms/
for more information.
Estimated Components of Population Change
- occurrences used by the Census Bureau to
estimate changes in the population during a time period. These components consist of births,
deaths, net internal migration and net international migration.
Estimates Base
- the population count used as the starting point in the estimates process. It can
be equal to the last decennial Census count or incorporate changes to the reference area
(boundaries, annexation, etc.) since the last decennial Census.
Natural Increase
- births minus deaths. The rate of natural increase expresses natural increase
during a time period as a percentage of an area’s population at the midpoint of the time period.
Net Internal Migration
- the difference between internal in-migration to an area and internal
out-migration from the same area during a time period. Internal in- and out-migration consist of
moves where both the origin and the destination are with in the United States (excluding Puerto
Rico). The net internal migration rate expresses net internal migration during a time period as a
percentage of an area’s population at the midpoint of the time period.
Net International Migration
- International migration, in its simplest form, is defined as any
movement across U.S. (50 states and District of Columbia) borders. The U.S. Census Bureau
makes estimates of net international migration for the nation, states, and counties. We estimate
net international migration as: (1) net migration of the foreign born, (2) net movement from
Puerto Rico, (3) net movement of the U.S. Armed Forces, and (4) emigration of the native born.
The largest component, net migration of the foreign born, includes lawful permanent residents
(immigrants), temporary migrants (such as students), humanitarian migrants (such as refugees),
and people illegally present in the United States. Currently, we do not estimate these components
individually. The Census definition of foreign born is available on the foreign-born population
page. (
http://www.census.gov/population/www/socdemo/foreign.html
)
Net migration
- net internal migration plus net international migration. The net migration rate
expresses net migration during a time period as a percentage of an area’s population at the
midpoint of the time period.
Percent Population Change
- the difference between the population of an area at the beginning
and end of a time period, expressed as a percentage of the beginning population.
Population Estimate
- the calculated number of people living in an area as of July 1. The
estimated population is calculated from a components of change model that incorporates
information on natural change (births, deaths) and net migration (net internal migration, net
international migration) that has occurred in an area since a Census 2000 reference date.
Residual
- The residual results from the application of a national population control to state and
county population estimates. The residual is the difference in state and county population before
and after the application of the control. The residual is not a demographic component of
population change.
PART 1: STATE DATA
The U.S. Census Bureau releases annual estimates of each state’s population as of the year’s
midpoint, July 1. These figures usually are released in late December of each year, along with
major components of population change such as birth, deaths, and migration. Estimates for years
in the interim between decennial censuses are sometimes revised. A consistent source for
historical population figures, including revisions, is the Bureau of Economic Analysis
(
http://www.bea.gov/bea/regional/reis/
), from which we obtained July 1 population totals and
cross-referenced them against Census Bureau records. We took estimates for the post 2000
period directly from releases by the Census Bureau. (
http://www.census.gov/popest/states/
)
Additional
information,
including historical data on deaths and births, was taken from vital
statistics records of the Nebraska Department of Health and Human Services.
(
http://www.hhs.state.ne.us/ced/vs06Pre.htm
) The Census Bureau also releases state population
estimates as of July 1 by sex and age in March of the following year. We used these data to
create population pyramids that follow in this report. Pyramids using exact counts from Census
2000 also are presented for the total population and major race and ethnic groups. July 1
intercensal estimates by race and ethnicity are released by the Census Bureau in July of the
following year.
Table 1: Annual Population Estimates and Change from Prior Year: U.S., Nebraska 1900-2007
United States Nebraska United States Nebraska United States Nebraska
July 1, 1900 76,094,000 1,067,000 -- -- -- --July 1, 1901 77,585,000 1,078,000 1,491,000 11,000 1.96 1.03 July 1, 1902 79,160,000 1,089,000 1,575,000 11,000 2.03 1.02 July 1, 1903 80,632,000 1,104,000 1,472,000 15,000 1.86 1.38 July 1, 1904 82,165,000 1,119,000 1,533,000 15,000 1.90 1.36 July 1, 1905 83,820,000 1,129,000 1,655,000 10,000 2.01 0.89 July 1, 1906 85,437,000 1,138,000 1,617,000 9,000 1.93 0.80 July 1, 1907 87,000,000 1,149,000 1,563,000 11,000 1.83 0.97 July 1, 1908 88,709,000 1,161,000 1,709,000 12,000 1.96 1.04 July 1, 1909 90,492,000 1,177,000 1,783,000 16,000 2.01 1.38 July 1, 1910 92,407,000 1,198,000 1,915,000 21,000 2.12 1.78 July 1, 1911 93,868,000 1,216,000 1,461,000 18,000 1.58 1.50 July 1, 1912 95,331,000 1,232,000 1,463,000 16,000 1.56 1.32 July 1, 1913 97,227,000 1,246,000 1,896,000 14,000 1.99 1.14 July 1, 1914 99,118,000 1,264,000 1,891,000 18,000 1.94 1.44 July 1, 1915 100,549,000 1,272,000 1,431,000 8,000 1.44 0.63 July 1, 1916 101,966,000 1,275,000 1,417,000 3,000 1.41 0.24 July 1, 1917 103,266,000 1,285,000 1,300,000 10,000 1.27 0.78 July 1, 1918 103,203,000 1,266,000 -63,000 -19,000 -0.06 -1.48 July 1, 1919 104,512,000 1,290,000 1,309,000 24,000 1.27 1.90 July 1, 1920 106,466,000 1,300,000 1,954,000 10,000 1.87 0.78 July 1, 1921 108,541,000 1,309,000 2,075,000 9,000 1.95 0.69 July 1, 1922 110,055,000 1,312,000 1,514,000 3,000 1.39 0.23 July 1, 1923 111,950,000 1,321,000 1,895,000 9,000 1.72 0.69 July 1, 1924 114,113,000 1,333,000 2,163,000 12,000 1.93 0.91 July 1, 1925 115,832,000 1,343,000 1,719,000 10,000 1.51 0.75 July 1, 1926 117,399,000 1,353,000 1,567,000 10,000 1.35 0.74 July 1, 1927 119,038,000 1,365,000 1,639,000 12,000 1.40 0.89 July 1, 1928 120,501,000 1,371,000 1,463,000 6,000 1.23 0.44 July 1, 1929 121,770,000 1,375,000 1,269,000 4,000 1.05 0.29 July 1, 1930 123,075,000 1,380,000 1,305,000 5,000 1.07 0.36 July 1, 1931 124,038,000 1,384,000 963,000 4,000 0.78 0.29 July 1, 1932 124,839,000 1,386,000 801,000 2,000 0.65 0.14 July 1, 1933 125,580,000 1,385,000 741,000 -1,000 0.59 -0.07 July 1, 1934 126,372,000 1,382,000 792,000 -3,000 0.63 -0.22 July 1, 1935 127,251,000 1,375,000 879,000 -7,000 0.70 -0.51 July 1, 1936 128,054,000 1,358,000 803,000 -17,000 0.63 -1.24 July 1, 1937 128,822,000 1,339,000 768,000 -19,000 0.60 -1.40 July 1, 1938 129,824,000 1,326,000 1,002,000 -13,000 0.78 -0.97 July 1, 1939 130,884,000 1,318,000 1,060,000 -8,000 0.82 -0.60 July 1, 1940 131,955,000 1,316,000 1,071,000 -2,000 0.82 -0.15 July 1, 1941 133,417,000 1,272,000 1,462,000 -44,000 1.11 -3.34 July 1, 1942 134,670,000 1,245,000 1,253,000 -27,000 0.94 -2.12 July 1, 1943 134,697,000 1,235,000 27,000 -10,000 0.02 -0.80 July 1, 1944 134,075,000 1,214,000 -622,000 -21,000 -0.46 -1.70 July 1, 1945 133,387,000 1,210,000 -688,000 -4,000 -0.51 -0.33 July 1, 1946 140,638,000 1,256,000 7,251,000 46,000 5.44 3.80 July 1, 1947 143,665,000 1,266,000 3,027,000 10,000 2.15 0.80 July 1, 1948 146,091,000 1,265,000 2,426,000 -1,000 1.69 -0.08 July 1, 1949 148,666,000 1,302,000 2,575,000 37,000 1.76 2.92
Population Actual Change Percent Change
United States Nebraska United States Nebraska United States Nebraska July 1, 1950 151,871,000 1,327,000 3,205,000 25,000 2.16 1.92 July 1, 1951 153,970,000 1,316,000 2,099,000 -11,000 1.38 -0.83 July 1, 1952 156,369,000 1,311,000 2,399,000 -5,000 1.56 -0.38 July 1, 1953 158,946,000 1,318,000 2,577,000 7,000 1.65 0.53 July 1, 1954 161,881,000 1,340,000 2,935,000 22,000 1.85 1.67 July 1, 1955 165,058,000 1,374,000 3,177,000 34,000 1.96 2.54 July 1, 1956 168,078,000 1,397,000 3,020,000 23,000 1.83 1.67 July 1, 1957 171,178,000 1,394,000 3,100,000 -3,000 1.84 -0.21 July 1, 1958 174,153,000 1,383,000 2,975,000 -11,000 1.74 -0.79 July 1, 1959 177,136,000 1,397,000 2,983,000 14,000 1.71 1.01 July 1, 1960 179,972,000 1,417,000 2,836,000 20,000 1.60 1.43 July 1, 1961 182,976,000 1,446,000 3,004,000 29,000 1.67 2.05 July 1, 1962 185,739,000 1,464,000 2,763,000 18,000 1.51 1.24 July 1, 1963 188,434,000 1,476,000 2,695,000 12,000 1.45 0.82 July 1, 1964 191,085,000 1,482,000 2,651,000 6,000 1.41 0.41 July 1, 1965 193,457,000 1,471,000 2,372,000 -11,000 1.24 -0.74 July 1, 1966 195,499,000 1,456,000 2,042,000 -15,000 1.06 -1.02 July 1, 1967 197,375,000 1,457,000 1,876,000 1,000 0.96 0.07 July 1, 1968 199,312,000 1,467,000 1,937,000 10,000 0.98 0.69 July 1, 1969 201,298,000 1,474,000 1,986,000 7,000 1.00 0.48 July 1, 1970 203,798,722 1,487,963 2,500,722 13,963 1.24 0.95 July 1, 1971 206,817,509 1,504,208 3,018,787 16,245 1.48 1.09 July 1, 1972 209,274,882 1,518,293 2,457,373 14,085 1.19 0.94 July 1, 1973 211,349,205 1,528,517 2,074,323 10,224 0.99 0.67 July 1, 1974 213,333,635 1,537,809 1,984,430 9,292 0.94 0.61 July 1, 1975 215,456,585 1,541,440 2,122,950 3,631 1.00 0.24 July 1, 1976 217,553,859 1,548,901 2,097,274 7,461 0.97 0.48 July 1, 1977 219,760,875 1,554,466 2,207,016 5,565 1.01 0.36 July 1, 1978 222,098,244 1,560,826 2,337,369 6,360 1.06 0.41 July 1, 1979 224,568,579 1,564,356 2,470,335 3,530 1.11 0.23 July 1, 1980 227,224,719 1,572,296 2,656,140 7,940 1.18 0.51 July 1, 1981 229,465,744 1,578,517 2,241,025 6,221 0.99 0.40 July 1, 1982 231,664,432 1,581,776 2,198,688 3,259 0.96 0.21 July 1, 1983 233,792,014 1,584,293 2,127,582 2,517 0.92 0.16 July 1, 1984 235,824,907 1,588,638 2,032,893 4,345 0.87 0.27 July 1, 1985 237,923,734 1,584,661 2,098,827 -3,977 0.89 -0.25 July 1, 1986 240,132,831 1,574,328 2,209,097 -10,333 0.93 -0.65 July 1, 1987 242,288,936 1,566,544 2,156,105 -7,784 0.90 -0.49 July 1, 1988 244,499,004 1,571,477 2,210,068 4,933 0.91 0.31 July 1, 1989 246,819,222 1,574,858 2,320,218 3,381 0.95 0.22 July 1, 1990 249,622,814 1,581,660 2,803,592 6,802 1.14 0.43 July 1, 1991 252,980,941 1,595,919 3,358,127 14,259 1.35 0.90 July 1, 1992 256,514,224 1,611,687 3,533,283 15,768 1.40 0.99 July 1, 1993 259,918,588 1,625,590 3,404,364 13,903 1.33 0.86 July 1, 1994 263,125,821 1,639,041 3,207,233 13,451 1.23 0.83 July 1, 1995 266,278,393 1,656,992 3,152,572 17,951 1.20 1.10 July 1, 1996 269,394,284 1,673,740 3,115,891 16,748 1.17 1.01 July 1, 1997 272,646,925 1,686,418 3,252,641 12,678 1.21 0.76 July 1, 1998 275,854,104 1,695,816 3,207,179 9,398 1.18 0.56 July 1, 1999 279,040,168 1,704,764 3,186,064 8,948 1.15 0.53
Population Actual Change Percent Change
United States Nebraska United States Nebraska United States Nebraska July 1, 2000 282,194,308 1,713,322 3,154,140 8,558 1.13 0.50 July 1, 2001 285,112,030 1,718,280 2,917,722 4,958 1.03 0.29 July 1, 2002 287,888,021 1,725,545 2,775,991 7,265 0.97 0.42 July 1, 2003 290,447,644 1,734,746 2,559,623 9,201 0.89 0.53 July 1, 2004 293,191,511 1,743,954 2,743,867 9,208 0.94 0.53 July 1, 2005 295,895,897 1,754,042 2,704,386 10,088 0.92 0.58 July 1, 2006 298,754,819 1,763,765 2,858,922 9,723 0.97 0.55 July 1, 2007 301,621,157 1,774,571 2,866,338 10,806 0.96 0.61 Sources:
1900-1929Historical Annual Time Series of State Population Estimates 1900 to 1990: Total Population Internet Release February 1996; http://www.census.gov/popest/archives/1980s/80s_st_totals.html
1930-1999Regional Economic Information System, Bureau of Economic Analysis, U.S. Department of Commerce Data as of March 28, 2006: http://www.bea.gov/bea/regional/spi/default.cfm?satable=summary
2000-2007Table 1: Annual Estimates of the Population for the United States and States: April 1, 2000 to July 1, 2007 Population Division, U.S. Census Bureau; Released December 27, 2007
http://www.census.gov/popest/states/NST-ann-est.html
Population Actual Change Percent Change
Year
Figure 1: July 1 Annual U.S. and Nebraska Population: 1900 to 2007
50.0 100.0 150.0 200.0 250.0 300.0 350.0 1900 1905 1910 1915 1920 1925 1930 1935 1940 1945 1950 1955 1960 1965 1970 1975 1980 1985 1990 1995 2000 2005 1.0 1.2 1.4 1.6 1.8 2.0 2.2
United States Nebraska
United States (millions)
Nebraska (millions)
Sources: REIS, Bureau of Economic Analysis; Annual Population Estimates, U.S. Census Bureau - released 12-27-07
Figure 2: Nebraska Population and Population Change: 1900 to 2007 0 200,000 400,000 600,000 800,000 1,000,000 1,200,000 1,400,000 1,600,000 1,800,000 2,000,000 1900 1905 1910 1915 1920 1925 1930 1935 1940 1945 1950 1955 1960 1965 1970 1975 1980 1985 1990 1995 2000 2005 -50,000 -40,000 -30,000 -20,000 -10,000 0 10,000 20,000 30,000 40,000 50,000
Population Change Population
1985-1987
Population Population Change
Sources: REIS, Bureau of Economic Analysis, Annual Population Estimates, U.S. Census Bureau - released 12-27-07
Figure 3: Annual U.S. and Nebraska Percent Population Change: 1900 to 2007
-4.0 -3.0 -2.0 -1.0 0.0 1.0 2.0 3.0 4.0 5.0 6.0 1900 1905 1910 1915 1920 1925 1930 1935 1940 1945 1950 1955 1960 1965 1970 1975 1980 1985 1990 1995 2000 2005 Year Percent Ch an ge
Nebraska United States
Sources: REIS, Bureau of Economic Analysis; Annual Population Estimates, U.S. Census Bureau - released 12-27-07
Table 2: Nebraska Population and Components of Change: 1930 to 2006 Sources: Regional Economic Information System, Bureau of Economic Analysis
Vital Statistics, Nebraska Health and Human Services
Annual Estimates of the Population, U.S. Census Bureau, Released 12-27-07
Natural Actual Net
Year Births Deaths Increase Change Migration
1930 1,380,000 27,006 13,280 13,726 5,000 -8,726 1931 1,384,000 26,610 12,905 13,705 4,000 -9,716 1932 1,386,000 25,160 12,923 12,237 2,000 -10,971 1933 1,385,000 24,187 12,925 11,262 -1,000 -12,750 1934 1,382,000 25,087 13,372 11,715 -3,000 -14,489 1935 1,375,000 23,326 13,179 10,147 -7,000 -17,931 1936 1,358,000 23,799 13,756 10,043 -17,000 -27,095 1937 1,339,000 22,256 13,200 9,056 -19,000 -28,550 1938 1,326,000 22,402 11,960 10,442 -13,000 -22,749 1939 1,318,000 22,326 12,188 10,138 -8,000 -18,290 1940 1,316,000 22,153 12,593 9,560 -2,000 -11,849 1941 1,272,000 22,186 12,203 9,983 -44,000 -53,772 1942 1,245,000 23,950 12,293 11,657 -27,000 -37,820 1943 1,235,000 25,091 12,956 12,135 -10,000 -21,896 1944 1,214,000 24,694 12,560 12,134 -21,000 -33,135 1945 1,210,000 24,292 12,446 11,846 -4,000 -15,990 1946 1,256,000 27,753 12,365 15,388 46,000 32,383 1947 1,266,000 32,018 12,823 19,195 10,000 -7,292 1948 1,265,000 31,066 12,569 18,497 -1,000 -19,846 1949 1,302,000 31,482 12,607 18,875 37,000 18,314 1950 1,327,000 31,713 12,548 19,165 25,000 5,980 1951 1,316,000 33,595 12,880 20,715 -11,000 -30,940 1952 1,311,000 33,809 13,056 20,753 -5,000 -25,734 1953 1,318,000 32,633 13,298 19,335 7,000 -13,044 1954 1,340,000 33,617 12,741 20,876 22,000 1,895 1955 1,374,000 34,087 13,001 21,086 34,000 13,019 1956 1,397,000 33,855 13,161 20,694 23,000 2,110 1957 1,394,000 33,161 13,797 19,364 -3,000 -23,029 1958 1,383,000 32,935 13,680 19,255 -11,000 -30,310 1959 1,397,000 34,162 13,887 20,275 14,000 -5,765 1960 1,417,000 34,257 14,071 20,186 20,000 -231 1961 1,446,000 34,544 13,812 20,732 29,000 8,541 1962 1,464,000 33,886 14,305 19,581 18,000 -2,157 1963 1,476,000 32,624 14,657 17,967 12,000 -6,774 1964 1,482,000 30,727 14,758 15,969 6,000 -10,968 1965 1,471,000 27,829 14,799 13,030 -11,000 -25,500 1966 1,456,000 25,618 14,799 10,819 -15,000 -26,925 1967 1,457,000 24,259 14,465 9,794 1,000 -9,307 1968 1,467,000 24,236 15,017 9,219 10,000 494 1969 1,474,000 24,801 14,898 9,903 7,000 -2,561 Number of Persons Estimated July 1 Population
Natural Actual Net
Year Births Deaths Increase Change Migration
1970 1,487,963 25,877 15,016 10,861 13,963 3,581 1971 1,504,208 25,507 15,182 10,325 16,245 5,652 1972 1,518,293 23,473 15,540 7,933 14,085 4,956 1973 1,528,517 22,771 14,977 7,794 10,224 2,361 1974 1,537,809 23,695 15,016 8,679 9,292 1,056 1975 1,541,440 23,658 14,569 9,089 3,631 -5,253 1976 1,548,901 23,767 14,536 9,231 7,461 -1,699 1977 1,554,466 25,158 14,316 10,842 5,565 -4,472 1978 1,560,826 25,103 14,408 10,695 6,360 -4,409 1979 1,564,356 26,199 14,228 11,971 3,530 -7,803 1980 1,572,296 27,335 14,465 12,870 7,940 -4,481 1981 1,578,517 27,164 14,580 12,584 6,221 -6,506 1982 1,581,776 26,954 14,567 12,387 3,259 -9,227 1983 1,584,293 26,254 14,695 11,559 2,517 -9,456 1984 1,588,638 26,099 14,633 11,466 4,345 -7,168 1985 1,584,661 25,540 14,895 10,645 -3,977 -15,033 1986 1,574,328 24,425 14,662 9,763 -10,333 -20,537 1987 1,566,544 23,813 14,820 8,993 -7,784 -17,162 1988 1,571,477 23,904 14,858 9,046 4,933 -4,087 1989 1,574,858 24,205 14,776 9,429 3,381 -5,857 1990 1,581,660 24,362 14,751 9,611 6,802 -2,718 1991 1,595,919 23,947 14,647 9,300 14,259 4,804 1992 1,611,687 23,336 14,577 8,759 15,768 6,739 1993 1,625,590 23,196 14,967 8,229 13,903 5,409 1994 1,639,041 23,131 14,974 8,157 13,451 5,258 1995 1,656,992 23,221 15,216 8,005 17,951 9,870 1996 1,673,740 23,271 15,435 7,836 16,748 8,828 1997 1,686,418 23,313 15,271 8,042 12,678 4,739 1998 1,695,816 23,533 15,181 8,352 9,398 1,201 1999 1,704,764 23,900 15,580 8,320 8,948 612 2000 1,713,322 24,643 14,979 9,664 8,558 -434 2001 1,718,280 24,818 15,171 9,647 4,958 -4,698 2002 1,725,545 25,381 15,721 9,660 7,265 -2,389 2003 1,734,746 25,900 15,439 10,461 9,201 -860 2004 1,743,954 26,324 14,647 11,677 9,208 -1,861 2005 1,754,042 26,142 14,950 11,192 10,088 -1,347 2006 1,763,765 26,722 14,894 11,828 9,723 -1,787 Estimated July 1 Population Number of Persons
Figure 4: Nebraska Births, Deaths, and Natural Change: 1930 to 2006 0 5,000 10,000 15,000 20,000 25,000 30,000 35,000 40,000 1930 1935 1940 1945 1950 1955 1960 1965 1970 1975 1980 1985 1990 1995 2000 2005
Births Deaths Natural Change
Number
Source: Vital Statistics, Nebraska Health and Human Services
Figure 5: Nebraska Components of Population Change: 1930 to 2006
-60,000 -50,000 -40,000 -30,000 -20,000 -10,000 0 10,000 20,000 30,000 40,000 1930 1935 1940 1945 1950 1955 1960 1965 1970 1975 1980 1985 1990 1995 2000 2005
Net Migration Natural Change
1991-1999
Number
Sources: Vital Statistics, Nebraska Health and Human Services; Annual Population Estimates, U.S. Census Bureau - released 12-27-07
Table 3: Annual Nebraska Population Estimates by Sex and Age: April 1, 2000 to July 1, 2007 Source: Annual Estimates of the Population by Sex and Age, U.S. Census Bureau, Released May 1, 2008
July 1, 2007 July 1, 2006 July 1, 2005 July 1, 2004 July 1, 2003 July 1, 2002 July 1, 2001 July 1, 2000 Estimates base Census Num-ber Per-cent BOTH SEXES 1,774,571 1,763,765 1,754,042 1,743,954 1,734,746 1,725,545 1,718,280 1,713,322 1,711,265 1,711,263 63,308 3.7 .Under 5 years 129,796 128,207 127,117 125,154 122,437 119,692 117,905 116,948 117,048 117,048 12,748 10.9 .5 to 9 years 119,370 117,950 116,811 117,463 117,833 119,074 120,768 122,802 123,445 123,445 -4,075 -3.3 .10 to 14 years 119,401 121,271 123,258 125,609 126,862 127,831 128,261 129,244 128,934 128,934 -9,533 -7.4 .15 to 19 years 130,075 130,074 130,815 130,715 132,193 133,399 134,908 135,195 134,909 134,909 -4,834 -3.6 .20 to 24 years 134,259 136,414 135,606 133,749 131,702 128,074 123,719 121,273 120,331 120,331 13,928 11.6 .25 to 29 years 121,854 115,959 113,365 111,155 110,041 108,861 109,694 111,333 112,049 112,049 9,805 8.8 .30 to 34 years 107,587 108,939 110,112 110,863 111,595 111,759 111,524 111,203 111,224 111,224 -3,637 -3.3 .35 to 39 years 112,265 112,005 111,275 112,233 114,771 119,542 124,254 129,499 130,027 130,027 -17,762 -13.7 .40 to 44 years 117,989 122,467 127,247 131,228 133,022 134,057 134,482 134,033 133,807 133,807 -15,818 -11.8 .45 to 49 years 132,256 132,464 131,860 130,116 129,224 127,522 125,724 123,360 122,714 122,714 9,542 7.8 .50 to 54 years 124,481 122,714 120,482 117,865 114,884 111,877 110,188 103,942 103,041 103,040 21,441 20.8 .55 to 59 years 107,652 105,900 99,564 93,935 89,240 85,439 79,620 78,002 77,585 77,584 30,068 38.8 .60 to 64 years 80,938 74,936 73,473 71,611 69,067 66,438 64,994 64,194 63,956 63,956 16,982 26.6 .65 to 69 years 61,624 60,054 59,096 58,885 58,382 58,166 58,500 59,133 59,391 59,391 2,233 3.8 .70 to 74 years 52,079 52,142 52,563 52,794 53,886 54,972 55,633 56,139 56,308 56,308 -4,229 -7.5 .75 to 79 years 46,241 46,539 46,852 47,151 47,432 47,439 47,834 47,999 47,991 47,991 -1,750 -3.6 .80 to 84 years 36,629 36,820 36,704 36,537 35,909 35,949 35,283 34,767 34,552 34,552 2,077 6.0
.85 years & over 40,075 38,910 37,842 36,891 36,266 35,454 34,989 34,256 33,953 33,953 6,122 18.0
.Under 18 years 446,145 445,094 444,912 445,445 445,370 446,147 447,310 450,040 450,242 450,242 -4,097 -0.9 .Under 5 years 129,796 128,207 127,117 125,154 122,437 119,692 117,905 116,948 117,048 117,048 12,748 10.9 .5 to 13 years 214,286 213,882 214,572 216,520 219,236 221,362 223,172 225,666 225,909 225,909 -11,623 -5.1 .14 to 17 years 102,063 103,005 103,223 103,771 103,697 105,093 106,233 107,426 107,285 107,285 -5,222 -4.9 .18 to 64 years 1,091,778 1,084,206 1,076,073 1,066,251 1,057,501 1,047,418 1,038,731 1,030,988 1,028,828 1,028,826 62,952 6.1 .18 to 24 years 186,756 188,822 188,695 187,245 185,657 181,923 178,251 175,422 174,425 174,425 12,331 7.1 .25 to 44 years 459,695 459,370 461,999 465,479 469,429 474,219 479,954 486,068 487,107 487,107 -27,412 -5.6 .45 to 64 years 445,327 436,014 425,379 413,527 402,415 391,276 380,526 369,498 367,296 367,294 78,033 21.2
.65 years & over 236,648 234,465 233,057 232,258 231,875 231,980 232,239 232,294 232,195 232,195 4,453 1.9
.16 years & over 1,380,554 1,370,768 1,360,255 1,350,168 1,341,942 1,332,973 1,324,851 1,317,219 1,314,976 1,314,974 65,580 5.0
.18 years & over 1,328,426 1,318,671 1,309,130 1,298,509 1,289,376 1,279,398 1,270,970 1,263,282 1,261,023 1,261,021 67,405 5.3
.15 to 44 years 724,029 725,858 728,420 729,943 733,324 735,692 738,581 742,536 742,347 742,347 -18,318 -2.5
.Median age (yrs) 36.1 36.0 35.9 35.8 35.7 35.6 35.6 35.4 35.3 35.3 0.8 2.3
Sex and age
April 1, 2000 Population estimates
2000-07 Change
July 1, 2007 July 1, 2006 July 1, 2005 July 1, 2004 July 1, 2003 July 1, 2002 July 1, 2001 July 1, 2000 Estimates base Census Num-ber Per-cent MALE 879,391 873,863 868,563 862,787 857,439 852,154 848,107 844,615 843,352 843,351 36,040 4.3 .Under 5 years 66,312 65,584 65,053 64,048 62,575 61,051 60,108 59,622 59,681 59,681 6,631 11.1 .5 to 9 years 60,930 60,131 59,535 59,909 60,050 60,839 61,721 62,671 63,001 63,001 -2,071 -3.3 .10 to 14 years 61,035 61,987 62,953 64,263 65,121 65,486 65,824 66,328 66,180 66,180 -5,145 -7.8 .15 to 19 years 66,852 67,005 67,433 67,334 67,993 68,716 69,463 69,444 69,235 69,235 -2,383 -3.4 .20 to 24 years 68,638 69,948 69,143 68,548 67,115 65,442 62,969 61,821 61,301 61,301 7,337 12.0 .25 to 29 years 63,364 59,931 59,043 57,351 56,998 56,020 56,334 57,033 57,373 57,373 5,991 10.4 .30 to 34 years 55,104 55,801 56,360 56,685 56,776 56,865 56,889 56,677 56,673 56,673 -1,569 -2.8 .35 to 39 years 57,244 57,264 56,850 57,125 58,283 60,613 62,751 65,108 65,339 65,339 -8,095 -12.4 .40 to 44 years 59,558 61,576 63,612 65,373 66,433 66,904 67,363 67,395 67,281 67,281 -7,723 -11.5 .45 to 49 years 65,815 66,141 66,046 65,210 64,661 63,706 62,758 61,382 61,050 61,050 4,765 7.8 .50 to 54 years 62,017 61,064 59,762 58,557 57,155 55,789 55,051 52,009 51,557 51,556 10,461 20.3 .55 to 59 years 53,445 52,666 49,583 46,802 44,538 42,562 39,598 38,497 38,280 38,280 15,165 39.6 .60 to 64 years 39,840 36,815 35,831 34,900 33,416 32,052 31,261 30,894 30,771 30,771 9,069 29.5 .65 to 69 years 29,210 28,379 27,964 27,744 27,423 27,126 27,282 27,619 27,728 27,728 1,482 5.3 .70 to 74 years 23,617 23,554 23,799 23,817 24,182 24,854 25,134 25,292 25,337 25,337 -1,720 -6.8 .75 to 79 years 19,865 19,985 20,051 20,177 20,435 20,319 20,392 20,340 20,320 20,320 -455 -2.2 .80 to 84 years 14,391 14,382 14,315 14,046 13,612 13,529 13,181 12,791 12,683 12,683 1,708 13.5 .85 years and 12,154 11,650 11,230 10,898 10,673 10,281 10,028 9,692 9,562 9,562 2,592 27.1 .Under 18 years 227,992 227,669 227,543 227,909 227,751 228,148 228,814 230,263 230,386 230,386 -2,394 -1.0 .Under 5 years 66,312 65,584 65,053 64,048 62,575 61,051 60,108 59,622 59,681 59,681 6,631 11.1 .5 to 13 years 109,359 109,205 109,489 110,471 112,006 113,293 114,289 115,565 115,686 115,686 -6,327 -5.5 .14 to 17 years 52,321 52,880 53,001 53,390 53,170 53,804 54,417 55,076 55,019 55,019 -2,698 -4.9 .18 to 64 years 552,162 548,244 543,661 538,196 533,363 527,897 523,276 518,618 517,336 517,335 34,827 6.7 .18 to 24 years 95,775 96,986 96,574 96,193 95,103 93,386 91,271 89,623 89,012 89,012 6,763 7.6 .25 to 44 years 235,270 234,572 235,865 236,534 238,490 240,402 243,337 246,213 246,666 246,666 -11,396 -4.6 .45 to 64 years 221,117 216,686 211,222 205,469 199,770 194,109 188,668 182,782 181,658 181,657 39,460 21.7 .65 years and 99,237 97,950 97,359 96,682 96,325 96,109 96,017 95,734 95,630 95,630 3,607 3.8 .16 years and 678,130 673,105 667,283 661,330 656,574 651,434 646,939 642,061 640,685 640,684 37,446 5.8 .18 years and 651,399 646,194 641,020 634,878 629,688 624,006 619,293 614,352 612,966 612,965 38,434 6.3 .15 to 44 years 370,760 371,525 372,441 372,416 373,598 374,560 375,769 377,478 377,202 377,202 -6,442 -1.7
.Median age (yrs) 34.8 34.7 34.6 34.4 34.3 34.2 34.2 34.0 34.0 34.0 0.8 2.3
2000-07 Change Sex and age
April 1, 2000 Population estimates
July 1, 2007 July 1, 2006 July 1, 2005 July 1, 2004 July 1, 2003 July 1, 2002 July 1, 2001 July 1, 2000 Estimates base Census Num-ber Per-cent FEMALE 895,180 889,902 885,479 881,167 877,307 873,391 870,173 868,707 867,913 867,912 27,268 3.1 .Under 5 years 63,484 62,623 62,064 61,106 59,862 58,641 57,797 57,326 57,367 57,367 6,117 10.7 .5 to 9 years 58,440 57,819 57,276 57,554 57,783 58,235 59,047 60,131 60,444 60,444 -2,004 -3.3 .10 to 14 years 58,366 59,284 60,305 61,346 61,741 62,345 62,437 62,916 62,754 62,754 -4,388 -7.0 .15 to 19 years 63,223 63,069 63,382 63,381 64,200 64,683 65,445 65,751 65,674 65,674 -2,451 -3.7 .20 to 24 years 65,621 66,466 66,463 65,201 64,587 62,632 60,750 59,452 59,030 59,030 6,591 11.2 .25 to 29 years 58,490 56,028 54,322 53,804 53,043 52,841 53,360 54,300 54,676 54,676 3,814 7.0 .30 to 34 years 52,483 53,138 53,752 54,178 54,819 54,894 54,635 54,526 54,551 54,551 -2,068 -3.8 .35 to 39 years 55,021 54,741 54,425 55,108 56,488 58,929 61,503 64,391 64,688 64,688 -9,667 -14.9 .40 to 44 years 58,431 60,891 63,635 65,855 66,589 67,153 67,119 66,638 66,526 66,526 -8,095 -12.2 .45 to 49 years 66,441 66,323 65,814 64,906 64,563 63,816 62,966 61,978 61,664 61,664 4,777 7.7 .50 to 54 years 62,464 61,650 60,720 59,308 57,729 56,088 55,137 51,933 51,484 51,484 10,980 21.3 .55 to 59 years 54,207 53,234 49,981 47,133 44,702 42,877 40,022 39,505 39,305 39,304 14,903 37.9 .60 to 64 years 41,098 38,121 37,642 36,711 35,651 34,386 33,733 33,300 33,185 33,185 7,913 23.8 .65 to 69 years 32,414 31,675 31,132 31,141 30,959 31,040 31,218 31,514 31,663 31,663 751 2.4 .70 to 74 years 28,462 28,588 28,764 28,977 29,704 30,118 30,499 30,847 30,971 30,971 -2,509 -8.1 .75 to 79 years 26,376 26,554 26,801 26,974 26,997 27,120 27,442 27,659 27,671 27,671 -1,295 -4.7 .80 to 84 years 22,238 22,438 22,389 22,491 22,297 22,420 22,102 21,976 21,869 21,869 369 1.7 .85 years and 27,921 27,260 26,612 25,993 25,593 25,173 24,961 24,564 24,391 24,391 3,530 14.5 .Under 18 years 218,153 217,425 217,369 217,536 217,619 217,999 218,496 219,777 219,856 219,856 -1,703 -0.8 .Under 5 years 63,484 62,623 62,064 61,106 59,862 58,641 57,797 57,326 57,367 57,367 6,117 10.7 .5 to 13 years 104,927 104,677 105,083 106,049 107,230 108,069 108,883 110,101 110,223 110,223 -5,296 -4.8 .14 to 17 years 49,742 50,125 50,222 50,381 50,527 51,289 51,816 52,350 52,266 52,266 -2,524 -4.8 .18 to 64 years 539,616 535,962 532,412 528,055 524,138 519,521 515,455 512,370 511,492 511,491 28,125 5.5 .18 to 24 years 90,981 91,836 92,121 91,052 90,554 88,537 86,980 85,799 85,413 85,413 5,568 6.5 .25 to 44 years 224,425 224,798 226,134 228,945 230,939 233,817 236,617 239,855 240,441 240,441 -16,016 -6.7 .45 to 64 years 224,210 219,328 214,157 208,058 202,645 197,167 191,858 186,716 185,638 185,637 38,573 20.8 .65 years and 137,411 136,515 135,698 135,576 135,550 135,871 136,222 136,560 136,565 136,565 846 0.6 .16 years and 702,424 697,663 692,972 688,838 685,368 681,539 677,912 675,158 674,291 674,290 28,134 4.2 .18 years and 677,027 672,477 668,110 663,631 659,688 655,392 651,677 648,930 648,057 648,056 28,971 4.5 .15 to 44 years 353,269 354,333 355,979 357,527 359,726 361,132 362,812 365,058 365,145 365,145 -11,876 -3.3
.Median age (yrs) 37.5 37.4 37.3 37.2 37.1 37.1 36.9 36.6 36.6 36.6 0.9 2.4
2000-07 Change Sex and age
April 1, 2000 Population estimates
Figure 6: 2007 Nebraska Population by Sex and Five-Year Age Group 7.0 6.0 5.0 4.0 3.0 2.0 1.0 0.0 1.0 2.0 3.0 4.0 5.0 6.0 7.0 Under 5 5 to 9 10 to 14 15 to 19 20 to 24 25 to 29 30 to 34 35 to 39 40 to 44 45 to 49 50 to 54 55 to 59 60 to 64 65 to 69 70 to 74 75 to 79 80 to 84 85+
Percent of Total Population
Female Male
Age Group
Source: Annual Estimates Program, U.S. Census Bureau, released 5-1-08
Green lines depict the depression cohort; red checker shows the "baby boom"; pink represents the "baby boom echo".
Table 4: Nebraska Population by Race and Ethnicity: April 1, 2000 and July 1, 2007 Source: Population Estimates Program, U.S. Census Bureau, Released May 1, 2008
Race July 1, 2007 April 1, 2000 Change Percent Change July 1, 2007 April 1, 2000 Total Population 1,774,571 1,711,263 63,308 3.7 100.0 100.0 White alone 1,625,144 1,585,617 39,527 2.5 91.6 92.7 Black alone 78,581 70,043 8,538 12.2 4.4 4.1 American Indian or
Alaska Native alone 17,576 15,634 1,942 12.4 1.0 0.9
Asian alone 30,317 22,528 7,789 34.6 1.7 1.3
Hispanic 133,832 94,425 39,407 41.7 7.5 5.5
White alone, not
Hispanic (majority) 1,500,380 1,497,111 3,269 0.2 84.5 87.5
Minority Population 274,191 214,152 60,039 28.0 15.5 12.5
Population1 Percent of Population
1
The April 1, 2000 population by race and ethnicity presented here will differ from released Census 2000 figures as the original data from Census 2000 incorporate a "some other race" category. 2005 estimates data do not incorporate the "some other race" category and thus the Census 2000 figures are adjusted to make appropriate comparisons.
Figure 7: 2007 Nebraska Population by Sex and Five-Year Age Group: White Alone, not Hispanic/Latino (Majority Population)
7.0 6.0 5.0 4.0 3.0 2.0 1.0 0.0 1.0 2.0 3.0 4.0 5.0 6.0 7.0 Under 5 5 to 9 10 to 14 15 to 19 20 to 24 25 to 29 30 to 34 35 to 39 40 to 44 45 to 49 50 to 54 55 to 59 60 to 64 65 to 69 70 to 74 75 to 79 80 to 84 85+
Percent of Total Population
Female Male
Age Group
Source: Population Estimates Program, U.S. Census Bureau, released 5-1-08
Figure 8: 2007 Nebraska Population by Sex and Five-Year Age Group: Non-White or Hispanic/Latino (Minority Population)
7.0 6.0 5.0 4.0 3.0 2.0 1.0 0.0 1.0 2.0 3.0 4.0 5.0 6.0 7.0 Under 5 5 to 9 10 to 14 15 to 19 20 to 24 25 to 29 30 to 34 35 to 39 40 to 44 45 to 49 50 to 54 55 to 59 60 to 64 65 to 69 70 to 74 75 to 79 80 to 84 85+
Percent of Total Population
Female Male
Age Group
Figure 9: 2007 Nebraska Population by Five-Year Age Group:
Non-White or Hispanic/Latino (Minority Population) as a Percent of State Total
15.5 25.8 24.1 21.9 17.8 16.9 20.7 21.0 18.3 14.7 11.3 9.5 8.3 7.4 6.8 6.1 4.8 4.0 3.3 0.0 5.0 10.0 15.0 20.0 25.0 30.0 Total Under 5 5 to 9 10 to 14 15 to 19 20 to 24 25 to 29 30 to 34 35 to 39 40 to 44 45 to 49 50 to 54 55 to 59 60 to 64 65 to 69 70 to 74 75 to 79 80 to 84 85+
Percent of Total Population Age Group
Source: Population Estimates Program, U.S. Census Bureau, released 5-1-08
Figure 10: 2000 Nebraska Population by Sex and Five-Year Age Group: Total Population 7.0 6.0 5.0 4.0 3.0 2.0 1.0 0.0 1.0 2.0 3.0 4.0 5.0 6.0 7.0 Under 5 5 to 9 10 to 14 15 to 19 20 to 24 25 to 29 30 to 34 35 to 39 40 to 44 45 to 49 50 to 54 55 to 59 60 to 64 65 to 69 70 to 74 75 to 79 80 to 84 85+
Percent of Total Population
Female Male
Source: Summary File 1, Census 2000, U.S. Census Bureau, Released May 2001
Figure 11: 2000 Nebraska Population by Sex and Five-Year Age Group: White Alone 7.0 6.0 5.0 4.0 3.0 2.0 1.0 0.0 1.0 2.0 3.0 4.0 5.0 6.0 7.0 Under 5 5 to 9 10 to 14 15 to 19 20 to 24 25 to 29 30 to 34 35 to 39 40 to 44 45 to 49 50 to 54 55 to 59 60 to 64 65 to 69 70 to 74 75 to 79 80 to 84 85+
Percent of Total Population
Female Male
Source: Summary File 1, Census 2000, U.S. Census Bureau, Released May 2001
Figure 12: 2000 Nebraska Population by Sex and Five-Year Age Group: Black or African American Alone
7.0 6.0 5.0 4.0 3.0 2.0 1.0 0.0 1.0 2.0 3.0 4.0 5.0 6.0 7.0 Under 5 5 to 9 10 to 14 15 to 19 20 to 24 25 to 29 30 to 34 35 to 39 40 to 44 45 to 49 50 to 54 55 to 59 60 to 64 65 to 69 70 to 74 75 to 79 80 to 84 85+
Percent of Total Population
Female Male
Source: Summary File 1, Census 2000, U.S. Census Bureau, Released May 2001
Figure 13: 2000 Nebraska Population by Sex and Five-Year Age Group: Asian Alone 8.0 7.0 6.0 5.0 4.0 3.0 2.0 1.0 0.0 1.0 2.0 3.0 4.0 5.0 6.0 7.0 8.0 Under 5 5 to 9 10 to 14 15 to 19 20 to 24 25 to 29 30 to 34 35 to 39 40 to 44 45 to 49 50 to 54 55 to 59 60 to 64 65 to 69 70 to 74 75 to 79 80 to 84 85+
Percent of Total Population
Female Male
Source: Summary File 1, Census 2000, U.S. Census Bureau, Released May 2001
Figure 14: 2000 Nebraska Population by Sex and Five-Year Age Group: American Indian and Alaska Native Alone
7.0 6.0 5.0 4.0 3.0 2.0 1.0 0.0 1.0 2.0 3.0 4.0 5.0 6.0 7.0 Under 5 5 to 9 10 to 14 15 to 19 20 to 24 25 to 29 30 to 34 35 to 39 40 to 44 45 to 49 50 to 54 55 to 59 60 to 64 65 to 69 70 to 74 75 to 79 80 to 84 85+
Percent of Total Population
Female Male
Source: Summary File 1, Census 2000, U.S. Census Bureau, Released May 2001
Figure 15: 2000 Nebraska Population by Sex and Five-Year Age Group: Hispanic or Latino/a 8.0 7.0 6.0 5.0 4.0 3.0 2.0 1.0 0.0 1.0 2.0 3.0 4.0 5.0 6.0 7.0 8.0 Under 5 5 to 9 10 to 14 15 to 19 20 to 24 25 to 29 30 to 34 35 to 39 40 to 44 45 to 49 50 to 54 55 to 59 60 to 64 65 to 69 70 to 74 75 to 79 80 to 84 85+
Percent of Total Population
Female Male
Source: Summary File 1, Census 2000, U.S. Census Bureau, Released May 2001
Figure 16: 2000 Nebraska Population by Sex and Five-Year Age Group: White Alone not Hispanic or Latino/a (Majority Population)
7.0 6.0 5.0 4.0 3.0 2.0 1.0 0.0 1.0 2.0 3.0 4.0 5.0 6.0 7.0 Under 5 5 to 9 10 to 14 15 to 19 20 to 24 25 to 29 30 to 34 35 to 39 40 to 44 45 to 49 50 to 54 55 to 59 60 to 64 65 to 69 70 to 74 75 to 79 80 to 84 85+
Percent of Total Population
Female Male
Source: Summary File 1, Census 2000, U.S. Census Bureau, Released May 2001
Figure 17: 2000 Nebraska Population by Sex and Five-Year Age Group: Non-White or Hispanic or Latino/a (Minority Population)
7.0 6.0 5.0 4.0 3.0 2.0 1.0 0.0 1.0 2.0 3.0 4.0 5.0 6.0 7.0 Under 5 5 to 9 10 to 14 15 to 19 20 to 24 25 to 29 30 to 34 35 to 39 40 to 44 45 to 49 50 to 54 55 to 59 60 to 64 65 to 69 70 to 74 75 to 79 80 to 84 85+
Percent of Total Population
Female Male
Source: Summary File 1, Census 2000, U.S. Census Bureau, Released May 2001
Figure 18: 2000 Nebraska Population by Five-Year Age Group: Non-White or Hispanic or Latino/a (Minority Population) as a Percent of the State Total
12.7 22.0 15.9 15.1 17.3 18.4 16.2 10.2 8.6 7.9 6.9 6.5 5.4 3.5 2.7 2.6 19.3 4.4 12.1 0.0 5.0 10.0 15.0 20.0 25.0 Total Under 5 5 to 9 10 to 14 15 to 19 20 to 24 25 to 29 30 to 34 35 to 39 40 to 44 45 to 49 50 to 54 55 to 59 60 to 64 65 to 69 70 to 74 75 to 79 80 to 84 85+
Percent of Total State Population
Source: Summary File 1, Census 2000, U.S. Census Bureau, Released May 2001
PART 2: COUNTY DATA
The U.S. Census Bureau releases annual estimates of each county’s population as of the
year’s midpoint, July 1. These figures typically are released in April of the following year. The
Census Bureau provides change and percentage change statistics and additionally ranks the
counties according to these factors in their prepared tables. Estimates of major components of
population change such as birth, deaths, and net migration also are released in April. We
incorporated these figures with changes occurring between the past two decennial censuses in
1990 and 2000 to create several maps showing demographic trends at the county level in
Nebraska. We took estimates directly from Census Bureau releases.
(
http://www.census.gov/popest/counties/
)
The Census Bureau also releases county population estimates as of July 1 by sex, age, race,
and ethnicity in August of the following year. Since intercensal population estimates and
demographic characteristics are only approximations, this report provides only summary
information by major age and race groups.
In order to show demographic trends by county type, we modified a classification system for
defining counties by their size and proximity to metropolitan areas. The system merged
measurement concepts used by the Census Bureau, in particular its newly employed micropolitan
counties, and the Urban Influence Codes used by the USDA Economic Research Service. The
classification scheme is based on county characteristics. The Modified Urban Influence Codes
developed by the Center for Public Affairs Research at the University of Nebraska Omaha used
in this report include six classification categories, with code 1 representing the most urban
counties and code 6 corresponding to the more rural counties:
Code 1: Metropolitan core county (contains a city with more than 50,000 residents);
Code 2: Metropolitan outlying county;
Code 3: Micropolitan core county (contains a city with more than 10,000 residents);
Code 4: Micropolitan outlying county;
Code 5: County with the largest town having between 2,500 and 9,999 residents; and
Code 6: County with the largest town having fewer than 2,500 residents.
See Map 1 for the geographical distribution of the six codes and the associated Table 5 for an
alphabetized list of counties in each category. The classification scheme first determined whether
the county had metropolitan or micropolitan status and then analyzed the size of the largest town
in non-metropolitan and non-micropolitan counties. The tables that follow in this report
summarize information by some of the county codes shown above.
Of Nebraska’s 93 counties, 84 meet the definition of a non-metropolitan county; of these, 20
exist within a micropolitan area, either core or outlying; 21 non-metropolitan counties are
classified by their largest town having 2,500 to 9,999 people; and 43 counties are in the category
of not having a town with at least 2,500 residents.
Table 5: Listing of Nebraska Counties Classified by Modified Urban Influence Code Metropolitan Counties
Metropolitan core county (small metro--fewer than 1 million residents)
Douglas Lancaster
Metropolitan outlying county (small metro)
Cass Dixon Saunders Washington
Dakota Sarpy Seward
Non-metropolitan Counties
Micropolitan core county (contains a city of at least 10,000 residents)
Adams Dodge Lincoln Platte
Buffalo Gage Madison Scotts Bluff
Dawson Hall
Micropolitan outlying county
Banner Howard McPherson Pierce
Clay Kearney Merrick Stanton
Gosper Logan
County with largest town of 2,500-9,999 residents
Box Butte Custer Keith Red Willow
Butler Dawes Kimball Richardson
Cherry Hamilton Nemaha Saline
Cheyenne Holt Otoe Wayne
Colfax Jefferson Phelps York
Cuming
County with largest town having less than 2,500 residents
Antelope Fillmore Hooker Rock
Arthur Franklin Johnson Sheridan
Blaine Frontier Keya Paha Sherman
Boone Furnas Knox Sioux
Boyd Garden Loup Thayer
Brown Garfield Morrill Thomas
Burt Grant Nance Thurston
Cedar Greeley Nuckolls Valley
Chase Harlan Pawnee Webster
Deuel Hayes Perkins Wheeler
Table 6: Annual Estimates of the Population for Nebraska Counties: April 1, 2000 to July 1, 2007
Source: Annual Estimates of the Population by County, U S Census Bureau, Released March 20, 2008 (Note: Changes on Table 7) Geographic Area July 1,
2007 July 1, 2006 July 1, 2005 July 1, 2004 July 1, 2003 July 1, 2002 July 1, 2001 July 1, 2000 Estimates Base1, 2 Census 2000 Nebraska2 1,774,571 1,763,765 1,754,042 1,743,954 1,734,746 1,725,545 1,718,280 1,713,322 1,711,265 1,711,263 Adams 32,990 32,963 33,017 32,710 32,187 31,724 31,595 31,154 31,151 31,151 Antelope 6,757 6,826 6,940 7,022 7,139 7,211 7,235 7,441 7,452 7,452 Arthur 356 368 370 385 400 394 408 442 444 444 Banner 734 744 731 749 764 772 811 824 819 819 Blaine 448 472 474 500 532 542 560 582 583 583 Boone 5,527 5,575 5,690 5,768 5,853 6,032 6,134 6,213 6,259 6,259 Box Butte 11,001 10,991 11,135 11,277 11,502 11,771 11,836 12,112 12,158 12,158 Boyd 2,119 2,140 2,213 2,240 2,298 2,348 2,386 2,427 2,438 2,438 Brown 3,207 3,292 3,290 3,406 3,448 3,474 3,492 3,520 3,525 3,525 Buffalo 44,976 44,569 44,081 43,739 43,255 42,970 42,433 42,349 42,259 42,259 Burt 7,059 7,157 7,229 7,402 7,369 7,492 7,664 7,789 7,791 7,791 Butler1 8,377 8,418 8,518 8,670 8,755 8,855 8,913 8,858 8,861 8,767 Cass 25,577 25,491 25,394 25,264 25,028 24,716 24,528 24,393 24,334 24,334 Cedar 8,530 8,698 8,935 8,999 9,097 9,256 9,389 9,580 9,615 9,615 Chase 3,698 3,773 3,822 3,886 3,985 3,976 3,966 4,047 4,068 4,068 Cherry 5,718 5,807 5,926 5,975 5,964 6,010 6,036 6,147 6,148 6,148 Cheyenne 9,972 9,794 9,963 9,844 9,837 9,908 9,907 9,825 9,830 9,830 Clay 6,330 6,408 6,498 6,656 6,754 6,830 6,906 7,025 7,039 7,039 Colfax 9,974 10,005 10,192 10,428 10,412 10,464 10,432 10,449 10,441 10,441 Cuming 9,365 9,486 9,634 9,703 9,825 9,961 10,057 10,174 10,203 10,203 Custer 10,849 10,967 11,127 11,234 11,316 11,463 11,571 11,782 11,793 11,793 Dakota 20,312 20,156 20,054 20,292 20,386 20,301 20,285 20,278 20,253 20,253 Dawes 8,818 8,715 8,794 8,889 9,125 9,104 9,093 9,036 9,060 9,060 Dawson 24,744 24,706 24,379 24,356 24,342 24,263 24,401 24,388 24,365 24,365 Deuel 1,893 1,903 1,936 1,976 1,994 2,013 2,084 2,101 2,098 2,098 Dixon 6,243 6,172 6,153 6,078 6,131 6,186 6,250 6,315 6,339 6,339 Dodge 36,004 35,921 35,873 35,817 35,840 35,840 36,025 36,221 36,160 36,160 Douglas 497,416 492,610 487,545 481,780 476,440 471,908 468,121 464,699 463,585 463,585 Dundy 2,031 2,058 2,086 2,156 2,180 2,172 2,197 2,292 2,292 2,292 Fillmore 6,051 6,121 6,181 6,325 6,404 6,401 6,514 6,613 6,634 6,634 Franklin 3,158 3,300 3,366 3,369 3,409 3,463 3,459 3,548 3,574 3,574 Frontier 2,663 2,721 2,793 2,869 2,890 2,977 3,041 3,088 3,099 3,099
Geographic Area July 1, 2007 July 1, 2006 July 1, 2005 July 1, 2004 July 1, 2003 July 1, 2002 July 1, 2001 July 1, 2000 Estimates Base1, 2 Census 2000 Furnas 4,732 4,823 4,853 4,949 5,079 5,175 5,185 5,291 5,324 5,324 Gage 23,219 23,158 23,061 23,216 23,180 23,126 23,096 22,976 22,993 22,993 Garden 1,834 1,919 1,956 2,110 2,196 2,211 2,266 2,280 2,292 2,292 Garfield 1,722 1,758 1,788 1,810 1,826 1,869 1,872 1,891 1,902 1,902 Gosper 1,971 1,957 2,008 2,029 2,070 2,057 2,074 2,142 2,143 2,143 Grant 613 638 648 660 684 720 747 747 747 747 Greeley 2,326 2,399 2,426 2,517 2,564 2,627 2,663 2,705 2,714 2,714 Hall 55,642 55,030 54,413 54,310 53,939 53,641 53,427 53,502 53,534 53,534 Hamilton 9,298 9,261 9,348 9,383 9,394 9,359 9,328 9,380 9,403 9,403 Harlan 3,392 3,404 3,459 3,555 3,654 3,640 3,718 3,771 3,786 3,786 Hayes 980 992 1,043 1,058 1,087 1,095 1,086 1,070 1,068 1,068 Hitchcock 2,844 2,886 2,900 3,010 3,014 3,035 3,086 3,103 3,111 3,111 Holt 10,312 10,414 10,631 10,700 10,912 11,125 11,303 11,488 11,551 11,551 Hooker 736 748 742 749 739 735 753 782 783 783 Howard 6,612 6,542 6,535 6,554 6,580 6,481 6,486 6,544 6,567 6,567 Jefferson 7,516 7,704 7,795 7,932 8,019 8,164 8,248 8,332 8,333 8,333 Johnson 4,476 4,598 4,605 4,760 4,495 4,331 4,361 4,481 4,488 4,488 Kearney 6,602 6,568 6,659 6,745 6,775 6,769 6,830 6,887 6,882 6,882 Keith 8,024 8,045 8,130 8,216 8,348 8,650 8,724 8,861 8,875 8,875 Keya Paha 850 871 892 932 955 951 962 980 983 983 Kimball 3,602 3,716 3,783 3,808 3,873 3,986 4,026 4,058 4,089 4,089 Knox 8,665 8,677 8,726 8,888 8,960 9,040 9,142 9,335 9,374 9,374 Lancaster 275,665 271,793 268,571 264,834 262,378 258,242 254,453 251,397 250,291 250,291 Lincoln 35,500 35,491 35,192 34,876 34,543 34,374 34,583 34,636 34,632 34,632 Logan 745 747 740 732 732 761 779 773 774 774 Loup 644 645 670 685 735 745 722 711 712 712 Madison 34,134 35,223 35,441 35,576 35,733 35,779 35,540 35,186 35,226 35,226 McPherson 502 482 495 509 520 536 528 531 533 533 Merrick 7,690 7,771 7,829 7,959 7,990 8,032 8,039 8,165 8,204 8,204 Morrill 5,047 5,012 5,043 5,095 5,168 5,210 5,345 5,437 5,440 5,440 Nance 3,572 3,625 3,663 3,652 3,734 3,872 3,992 4,038 4,038 4,038 Nemaha 7,039 7,128 7,059 7,018 7,085 7,243 7,394 7,567 7,576 7,576 Nuckolls 4,533 4,596 4,681 4,783 4,809 4,804 4,926 5,028 5,057 5,057 Otoe 15,647 15,545 15,385 15,347 15,340 15,421 15,475 15,430 15,396 15,396 Pawnee 2,686 2,712 2,804 2,841 2,856 2,983 3,001 3,083 3,087 3,087 Perkins 2,928 2,949 3,035 3,046 3,014 3,074 3,100 3,176 3,200 3,200
Geographic Area July 1, 2007 July 1, 2006 July 1, 2005 July 1, 2004 July 1, 2003 July 1, 2002 July 1, 2001 July 1, 2000 Estimates Base1, 2 Census 2000 Phelps 9,175 9,334 9,341 9,487 9,537 9,662 9,693 9,734 9,747 9,747 Pierce 7,284 7,376 7,472 7,453 7,597 7,623 7,736 7,839 7,857 7,857 Platte1 31,849 31,408 31,173 30,908 30,944 31,079 31,407 31,521 31,568 31,662 Polk 5,208 5,213 5,284 5,319 5,417 5,483 5,499 5,613 5,639 5,639 Red Willow2 10,748 10,876 11,036 11,125 11,207 11,308 11,400 11,449 11,450 11,448 Richardson 8,351 8,536 8,672 8,776 8,868 9,075 9,233 9,505 9,531 9,531 Rock 1,515 1,520 1,527 1,576 1,584 1,669 1,712 1,755 1,756 1,756 Saline 13,873 13,824 13,982 14,083 14,133 14,045 13,963 13,866 13,843 13,843 Sarpy 146,756 142,713 139,245 135,650 132,024 129,104 126,047 123,161 122,595 122,595 Saunders 20,184 20,103 20,228 20,065 19,967 19,841 19,921 19,853 19,830 19,830 Scotts Bluff 36,370 36,201 36,286 36,290 36,476 36,587 36,539 36,967 36,951 36,951 Seward 16,554 16,700 16,626 16,707 16,546 16,598 16,626 16,531 16,496 16,496 Sheridan 5,450 5,496 5,590 5,745 5,770 5,950 5,975 6,177 6,198 6,198 Sherman 3,013 3,039 3,093 3,138 3,133 3,169 3,259 3,297 3,318 3,318 Sioux 1,351 1,371 1,406 1,414 1,469 1,432 1,401 1,470 1,475 1,475 Stanton 6,395 6,467 6,452 6,490 6,487 6,492 6,399 6,425 6,455 6,455 Thayer 5,163 5,196 5,349 5,415 5,561 5,685 5,869 6,040 6,055 6,055 Thomas 600 608 608 622 655 669 704 731 729 729 Thurston 7,208 7,228 7,247 7,146 7,154 7,107 7,158 7,158 7,171 7,171 Valley 4,263 4,298 4,333 4,431 4,538 4,514 4,607 4,644 4,647 4,647 Washington 19,959 19,808 19,646 19,420 19,369 19,180 19,089 18,793 18,780 18,780 Wayne 9,317 9,546 9,465 9,456 9,560 9,570 9,718 9,807 9,851 9,851 Webster 3,609 3,628 3,698 3,787 3,833 3,892 3,983 4,053 4,061 4,061 Wheeler 809 801 805 790 798 824 850 883 886 886 York 14,370 14,321 14,130 14,053 14,278 14,327 14,503 14,574 14,598 14,598 Metropolitan 1,028,666 1,015,546 1,003,462 990,090 978,269 966,076 955,320 945,420 942,503 942,503 Non-Metropolitan 745,905 748,219 750,580 753,864 756,477 759,469 762,960 767,902 768,762 768,760 Micropolitan 400,293 399,732 398,335 397,674 396,708 395,736 395,634 396,055 396,112 396,206 Non-Metro/Micro 345,612 348,487 352,245 356,190 359,769 363,733 367,326 371,847 372,650 372,554 Town Over 2500 201,346 202,433 204,046 205,404 207,290 209,471 210,853 212,434 212,737 212,641 No Town Over 2500 144,266 146,054 148,199 150,786 152,479 154,262 156,473 159,413 159,913 159,913
1 A January 1, 2001 boundary change resulted in a population gain of 94 persons for Butler County while Platte County lost 94 persons. 2
Table 7: Nebraska Population Estimates, Changes, and Rankings: April 1, 2000 to July 1, 2007 Source: Cumulative Estimates of Population Change, U.S. Census Bureau, Released March 20, 2008
July 1, 2007
2000 Estimates
Base Number Percent
July 1, 2007
2000 Estimates
Base Number Percent
Nebraska 1,774,571 1,711,265 63,306 3.7 (X) (X) (X) (X) .Adams County 32,990 31,151 1,839 5.9 10 11 6 6 .Antelope County 6,757 7,452 -695 -9.3 44 43 77 59 .Arthur County 356 444 -88 -19.8 93 93 29 91 .Banner County 734 819 -85 -10.4 87 85 28 69 .Blaine County 448 583 -135 -23.2 92 91 37 93 .Boone County 5,527 6,259 -732 -11.7 52 51 81 78
.Box Butte County 11,001 12,158 -1,157 -9.5 22 22 91 62
.Boyd County 2,119 2,438 -319 -13.1 74 74 51 83 .Brown County 3,207 3,525 -318 -9.0 66 67 50 56 .Buffalo County 44,976 42,259 2,717 6.4 5 5 4 4 .Burt County 7,059 7,791 -732 -9.4 42 41 81 60 .Butler County1 8,377 8,861 -484 -5.5 35 37 66 34 .Cass County 25,577 24,334 1,243 5.1 12 13 7 7 .Cedar County 8,530 9,615 -1,085 -11.3 34 31 89 74 .Chase County 3,698 4,068 -370 -9.1 61 62 52 57 .Cherry County 5,718 6,148 -430 -7.0 51 53 59 40 .Cheyenne County 9,972 9,830 142 1.4 27 29 15 13 .Clay County 6,330 7,039 -709 -10.1 48 45 79 67 .Colfax County 9,974 10,441 -467 -4.5 26 26 65 32 .Cuming County 9,365 10,203 -838 -8.2 28 27 85 48 .Custer County 10,849 11,793 -944 -8.0 23 23 88 46 .Dakota County 20,312 20,253 59 0.3 15 15 16 19 .Dawes County 8,818 9,060 -242 -2.7 32 35 44 28 .Dawson County 24,744 24,365 379 1.6 13 12 10 12 .Deuel County 1,893 2,098 -205 -9.8 77 78 41 65 .Dixon County 6,243 6,339 -96 -1.5 49 50 31 25 .Dodge County 36,004 36,160 -156 -0.4 7 7 38 22 .Douglas County 497,416 463,585 33,831 7.3 1 1 1 3 .Dundy County 2,031 2,292 -261 -11.4 75 75 45 75 .Fillmore County 6,051 6,634 -583 -8.8 50 47 75 55 .Franklin County 3,158 3,574 -416 -11.6 67 66 58 77 .Geographic Area
Population Estimates Change, 2000 to 2007
State Ranking of Counties