Regulation, deregulation and managerial
behaviour: new evidence on expense
preference in banking
DANIEL M. GROPPER and SHARON L. OSWALD*
College of Business, 513 Lowder Business Building, Auburn University, Auburn, Alabama 36849-5240, USA and College of Business, 415 Lowder Business Building, Auburn University, Auburn, Alabama 36849, USA
Expense preference theory suggests that when discretionary behaviour is an option, firm managers may choose to maximize individual utility rather than firm profits. Expense preference behaviour is generally exhibited by a positive preference for increased expenditures on staff size, salaries and benefits, and other perquisites. A large amount of research has examined expense preference behaviour in the financial services industry, with mixed results. This paper builds on previous studies to develop atid test an empirical model of expetise preference behaviour before and after deregulation in the banking industry. The results suggest a decrease in expense preference behaviour in the latter time period.
L I N T R O D U C T I O N
Neoclassical microeconomic theory assumes that mana-gerial behaviour is guided by the motive of profit maxi-mization. Expense preference theory, as developed by Williamson (1963) and modified by Rees (1974), provides an alternative view regarding managerial behaviour. By view-ing managers as utility maximizers whose individual prefer-ences may not be entirely consistent with profit maximiza-tion, expense preference theory predicts that under certain circumstances, managers may hire more staff members, spend more on office furnishings and equipment, or spend more on other perquisites than is consistent with profit maximization behaviour. The circumstances conducive to such behaviour include the separation of ownership and control, costly monitoring of managerial behaviour, a lack of effective competition in input and output markets, or effective regulation in those same markets.
A large number of empirical studies of expense preference behaviour have been conducted on firms in the financial services industry. In his classic 1977 study of the banking industry, Edwards found empirical support for the expense preference theoretical framework, and argued that this theory better explained the general behaviour of managers in regulated firms than did a profit maximizing framework. In addition to Edwards, Hannan (1979), Hannan and Mavinga (1980) and Arnould (1985) found evidence of 0960-3107 © 1996 Chapman & Hall
expense preference behaviour among commercial banks, while Verbrugge and Jahera (1981) found the same for savings and loans. Others, including Mester (1989) and Blair and Placone (1988) found little or no evidence of expense preference behaviour among savings and loans, particularly with regard to testing whether ownership form (stock or mutual) led to differences in managerial behaviour.
We add to this literature by investigating the effect of deregulation on expense preference behaviour among com-mercial banks. Specifically, we provide estimates of several alternative indicators of expense preference behaviour be-fore and after the major period of deregulation in the early to mid-1980s, and find evidence to suggest a decrease in expense preference behaviour between the 1979-1980 and 1985-1986 time periods.
II. THEORETICAL FRAMEWORK AND PREVIOUS RESEARCH
Two approaches to expense preference behaviour have been advanced. First, it is hypothesized that managers view the maximization of'true' profits and the maximization of'true' utility as two separate decisions. Accordingly, managers choose to keep the firm's output and some of its inputs at the profit-maximizing level, but spend excessively on labour. Edwards (1977) deemed this behaviour as 'pure waste'
because the firm is operating inside, rather than on its production efficiency frontier. Second, it has been hy-pothesized that managers treat profit and utility decisions as one single decision to maximize utility. In this view the firm is functioning on its production efficiency frontier, but at the 'wrong' place (Rees, 1974, p. 298-302) with both output and the ratio of labour to other inputs larger than profit maximization levels. In both approaches, labour ex-penditures are expected to be greater than if expense prefer-ence tendencies did not exist.
Edwards (1977) contended that expense preference behav-iour is most prevalent in regulated industries that exhibit monopoly power. Several factors associated with the bank-ing industry at the time of his study made it an ideal industry to examine expense preference behaviour. First, there were imperfections in banking markets since some local markets were either monopolies or tightly-knit oligopolies (Edwards, 1964; Phillips, 1967; Jacobs, 1971); key interest rates were fixed by law; entry into the market was controlled (Peltzman, 1965; Edwards and Edwards, 1974); and there was a high degree of regulation. In addition.
D. M. Gropper and S. L. Oswald
separation of ownership and control was present among larger banks (Vernon, 1970 and 1971). Consequently, the market conditions were relatively conducive to a non-profit-maximizing operating strategy. Edwards found evid-ence that wage and salary expenditures in banking in-creased with monopoly power. Specifically, he found that prices (or interest rates) were higher in monopolistic bank-ing markets but reported profits were not correspondbank-ingly higher.
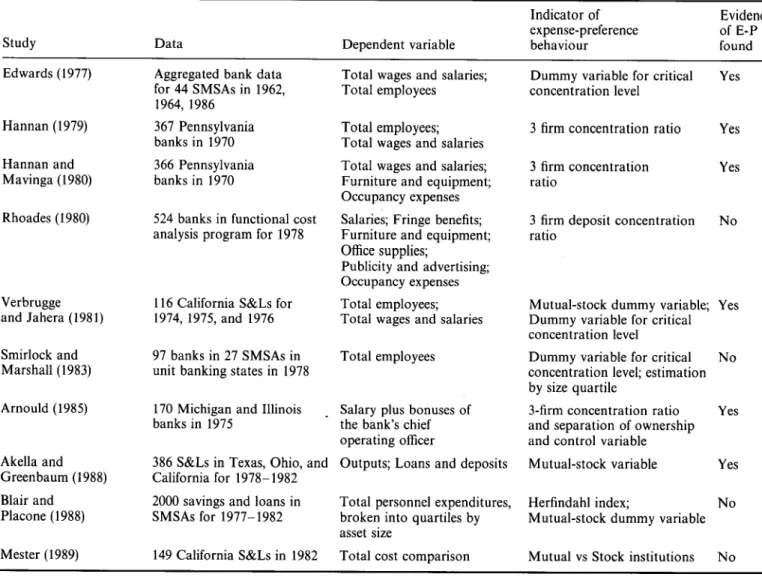
Numerous studies followed Edwards' work (see Table 1). These investigations generally have either examined the effect of ownership form (mutual or stock) on expense pref-erence behaviour in the savings and loan (S&L) industry, or the effect of market concentration on expense preference behaviour for banks or S&Ls. Verbrugge and Jahera (1981) found that California mutual savings and loans had signifi-cantly higher personnel expenditures than otherwise similar stock associations. Akella and Greenbaum (1988) also found that institutions with the more diffused ownership structure associated with mutuality exhibited greater ten-dencies for expense preference behaviour. Consistent with
Table 1. Summary of expense-preference literature in financial services industry
Study Edwards (1977) Hannan (1979) Hannan and Mavinga (1980) Rhoades (1980) Verbrugge and Jahera (1981) Stnirloek and Marshall (1983) Arnould (1985) Akella and Greenbaum (1988) Blair and Placone (1988) Mester (1989) Data
Aggregated bank data for 44 SMSAs in 1962, 1964, 1986 367 Pennsylvania banks in 1970 366 Pennsylvania banks in 1970
524 banks in functional cost analysis program for 1978
116 California S&Ls for 1974, 1975, and 1976 97 banks in 27 SMSAs in unit banking states in 1978 170 Michigan and Illinois banks in 1975
386 S&Ls in Texas, Ohio, and California for 1978-1982 2000 savings and loans in SMSAs for 1977-1982 149 California S&Ls in 1982
Dependent variable Total wages and salaries; Total employees
Total employees; Total wages and salaries Total wages and salaries; Furniture and equipment; Occupancy expenses Salaries; Fringe benefits; Furniture and equipment; Office supplies;
Publicity and advertising; Occupancy expenses Total employees; Total wages and salaries Total employees
Salary plus bonuses of the bank's chief operating officer
Outputs; Loans and deposits Total personnel expenditures, broken into quartiles by asset size
Total cost comparison
Indicator of expense-preference behaviour
Dummy variable for critical concentration level
3 firm concentration ratio 3 firm concentration ratio
3 firm deposit concentration ratio
Mutual-stock dummy variable; Dummy variable for critical concentration level
Dummy variable for critical concentration level; estimation by size quartile
3-firm concentration ratio and separation of ownership and control variable Mutual-stock variable Herfindahl index;
Mutual-stock dummy variable Mutual vs Stock institutions
Evidence of E-P found Yes Yes Yes No Yes No Yes Yes No No
expense preference theory, Hannan (1979) and Hannan and Mavinga (1980) found evidence that manager-controlled banks operating in less competitive markets spent more on inputs than did owner-controlled banks in similar environ-ments. Arnould (1985) also found that in banks which were characterized by a large degree of separation of ownership and control and which were located in less competitive markets, salaries and bonuses of the chief operating officer were significantly higher than those in closely held banks in more competitive markets, a result consistent with expense-preference behaviour.
Conflicting results were reported by Rhoades (1980) who found no support for several broad measures of expense preference behaviour. Smirlock and Marshall (1983) sug-gested that any deviations from profit maximization would be reflected in monitoring costs which increased with size. Therefore, controlling for flrm size, their flndings supported the notion that market structure, as measured by concentra-tion, does not affect expense preference behaviour in the commercial banking industry. Finally, Blair and Placone (1988) and Mester (1989) studied mutual and stock savings and loans and, likewise, found no support for the expense preference hypotheses.
To summarize, while much attention has pointed toward utility-maximizing rather than profit-maximizing behaviour in the financial services industry, the results of empirical studies have been, at best, mixed. Further, the impact of changes in the regulatory environment which occurred in the 1980s has not been investigated, even though it would be expected that these changes would have a significant bear-ing on expense preference behaviour by bank managers.
III. THE DEREGULATION OF THE BANKING INDUSTRY
The 1980s represented a period of enormous regulatory change in the American banking industry. Two of the most important pieces of legislation were the Depository Institu-tions Deregulation and Monetary Control Act of 1980 (DIDMCA) and the Garn-St Germain Depository Institu-tions Act of 1982. The principle goals of the DIDMCA included: (1) improving monetary control and equalizing its costs among depository institutions; (2) removing the bar-riers to competition for funds by depository institutions and
allowing small savers a market rate of return; (3) expanding the availability of financial services to the public (Federal Reserve Bank, 1987). Additionally, Regulation Q, which placed restrictions on interest rates payable on time deposi-ts, was phased out under a plan developed by the Depo-sitory Institutions Deregulation Committee.' Geographic restrictions, which previously limited both the number of competitors banks faced and the organizational structure banks used, eroded substantially, contributing to a more competitive environment.
The regulatory changes in the banking industry have served to eliminate many of the characteristics that caused Edwards (1977) to suggest that the banking industry was a prime target for expense preference behaviour. We con-tend, therefore, that differences may exist in bank manager's operating behaviour before and after the period of deregula-tion. Specifically, we expect to flnd expense preference behaviour less prevalent after deregulation than before. In this regard, and paralleling Edwards' study, the following are hypothesized. First, total personnel related expenses, includ-ing wages, frinclud-inge beneflts, travel, etc., are expected to decrease for the 1985-86 data relative to the earlier years. Second, the total number of employees should decrease for the study years following the primary phasing in of deregulation. Finally, other expense measures which may be subject to managerial discretion such as occupancy or furniture and equipment spending would be expected to decrease after deregulation.
IV. METHODOLOGY
Sample data and variable description
The nationwide sample used in this study consist of 1327 commercial banks for the years 1979-1980 and 904 com-mercial banks for the years 1985-1986. All data are ob-tained from the Functional Cost Analysis Program of the Federal Reserve System.
Using this data for analysis of expense preference behav-iour has some advantages and disadvantages. Chief among the disadvantages are that some information about the institution, including its identity, is masked for confidential-ity reasons. Consequently, we do not know the location of the institution, and are thus unable to calculate any measure of local market concentration.^ In addition, the
' For a good summary of the steps in the deposit deregulation process see Kaufman (1989). For a more complete discussion of the trends towards interstate banking, see Freider (1986).
^Debate over the importance of market structure and what, if any, information is actually provided by market concentration indices has continued over at least the last 20 years. For an overview see the discussions in Goldschmid et al (eds). Industrial Concentration: The New
Learning (1974), particularly the papers by Weiss and Demsetz, and Baumol et al., Contestable Markets and the Theory of Industry
Structure, rev. ed. (1988), particularly Chapter 1. Consistent with the 'Chicago School' notion that concentration measures bear no systematic relation to the degree of competition in markets, several recent studies have found that local market concentration has no significant impact on managerial expense preference behaviour. (Smirlock and Marshall, 1983; Blair and Placone, 1988). Other recent studies (Akella and Greenbaum, 1988) do not include any concentration variable in their regression models. Since the purpose of our investigation is to compare the same statistical model of expense preference behaviour before and after deregulation we do not view a market concentration variable as essential to the present study.
sample does not include the largest US banks, but instead is comprised of small to mid-sized banks. Total assets range from about $10 million up to $2 billion, with a mean of approximately $200 million. However, this size range does include the vast majority of US banks in operation during this time period.
On the positive side, the FCA data provide detailed information about bank operations and costs which is not available elsewhere. Travel, memberships and subscriptions, and other miscellaneous spending is included in our study, and is not readily available from other sources. The number of bank officers and employees is also found in this data source, where other sources only have total spending on wages and salaries rather than the number of empolyees.
Regression model specification
To conduct our statistical investigation regarding whether expense preference behaviour has changed with deregula-tion, we estimate several regression models similar to those used in earlier studies. As Blair and Placone (1988) point out, the theoretical formulation of the general expense pre-ference model suggests that the number of employees will be expanded beyond the optimal (profit-maximizing) level if expense preference behaviour is present. In some previous studies (Edwards, 1977; Hannan, 1979) both the number of employees and expenditures on employees were used as indicators of expense preference behaviour. Other studies (Hannan and Mavinga, 1980; Rhoades, 1980) used addi-tional measures which may reflect discretionary behaviour such as occupancy expenditures or spending on furniture and equipment.
Following the previous literature, six measures which may reflect expense preference behaviour by bank managers were used as dependent variables in our regressions. These measures include total bank personnel, non-officer em-ployees, total personnel-related expenditures, and miscella-neous expenditures, which includes occupancy expenses and spending on furniture and equipment, as well as travel and dues and memberships. To allow comparisons with pre-vious work, occupancy expenses and spending on furniture and equipment were also examined separately.
Again following the prior literature, our explanatory vari-ables include a variable for the local regulatory environment in which a bank operates. This variable (BST) is equal to one if the bank is located in a state which allows branching, and is zero otherwise. The effect of bank deregulation
{DE-REG) is proxied by the use of a dummy variable for the
years 1985-86. This variable is expected to be negative, indicating that deregulation reduced expense-preference be-haviour. The base period to which 1985-86 are compared is 1979-80. Bank size is measured by total assests (ASSETS), and bank product mix is measured by the demand de-posit/time deposit ratio {LDT) and the total loans/total deposit ratio (LLD). Each of these variables is expected to be
positive. The number of branch offices per bank (LBO) is also included as a measure of bank size. Previous studies have included an SMSA average or other regional wage measure in their regressions (Edwards, 1977). In our at-tempts to include a wage variable in our regressions, we were forced to compromise because of the available data. Since neither the state or specific location of individual banks was not revealed, only national data on wage rates could be used as an external market wage measure. But doing this means that there is no variation across sample banks in any given year; thus such a wage measure acts much like a year dummy variable. To capture interbank variation within any given year while including information from the annual wage data, the variable TWU was con-structed. TWU was calculated as the total wage expendi-tures which would have been made by the bank if they had paid their workers the US average wage. Thus TW^C/ equals the US average wage for each year for workers in the finance, insurance and real estate industry multiplied by the number of bank employees. While this is an imperfect measure, it is used since no better data is available. Before running any regressions, all variables expressed in dollar amounts were converted to constant 1982 dollars using the consumer price index. All variables except BST and
DEREG were expressed in natural logarithms.
V. RESULTS
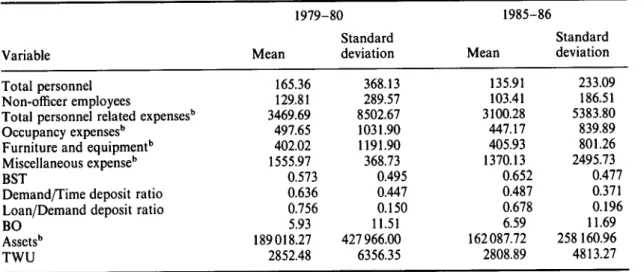
Descriptive statistics for the data set are presented in Table 2. These data exhibit some patterns consistent with the idea that expense preference behaviour has decreased with de-regulation, at least to some degree. There was a slight decline in the number of employees per officer over the 1979-1986 time period. In 1979-80, there were approxi-mately 3.65 employees per oflScer, compared to 3.18 em-ployees per officer in 1985-86. The number of emem-ployees per branch office also declined over this period, from 27.89 in 1979-80 to 20.62 in 1985-86. In addition, the real dollar volume of assets per employee rose by over 50% between 1979-1986. All of these changes are consistent with the idea that deregulation has reduced expense preference behav-iour, and perhaps put pressure on managers to utilize em-ployees more efficiently. To more fully investigate these operating changes and control for other inffuences, several . different regression models were estimated.
In regression models where the sample data vary widely between the largest and smallest observations, hetero-skedasticity is often a problem. In this situation, ordinary least squares provides inefficient estimation of the para-meters of the model, leading to problems in conducting tests of statistical significance. White (1980) provides a general test for heteroskedasticity, and a method for efficient estima-tion of the variance-covariance matrix in the presence of heteroskedasticity. Since the data which we use contains
Table 2. Descriptive statisticsfor regression variables Variable 1979-80 Mean Standard deviation 1985-86 Mean Standard deviation Total personnel Non-officer employees
Total personnel related expenses'" Occupancy expenses'"
Furniture and equipment'' Miscellaneous expense'' BST
Demand/Time deposit ratio Loan/Demand deposit ratio BO Assets'' TWU 165.36 129.81 3469.69 497.65 402.02 1555.97 0.573 0.636 0.756 5.93 189018.27 2852.48 368.13 289.57 8502.67 1031.90 1191.90 368.73 0.495 0.447 0.150 11.51 427966.00 6356.35 135.91 103.41 3100.28 447.17 405.93 1370.13 0.652 0.487 0.678 6.59 162087.72 2808.89 233.09 186.51 5383.80 839.89 801.26 2495.73 0.477 0.371 0.196 11.69 258 160.96 4813.27
"There were 1327 banks in the 1979-80 sample and 904 in the 1985-86 sample. ''All dollar denominated variables are expressed in thousands of 1982 dollars.
a great deal of dispersion from the smallest to the largest banks, we performed White tests for heteroskedasticity on all of our estimated models. Iti every case, the results in-dicated the presence of heteroskedasticity;^ we therefore used the White estimation technique in all of our regression models reported below.
Results from the estimation of Equations 1-9 are pre-sented in Table 3. In all regressions, the coefficient on
ASSETS has the expected positive sign and is strongly
significant. The measures for bank product mix {LDT and
LLD) are also positive and significant as expected. In each
case (except furniture and equipment) the coefficient on
LBO is positive and significant. The branch state dummy
variable is positive and significant in Equations 1 and 3, but it is not significant in Equations 2 and 4. This appears to be due to the inclusion of the number of branch offices in Equations 2 and 4, since these two variables pick up some of the same information.
Of primary interest here is the variance DEREG. The coefficient of this variable is negative and statistically signifi-cant at the 5% level or better in each case (except furniture and equipment). Thus, our regression results support the hypothesis that there has been a decline in expense prefer-ence behaviour over the time period of bank deregulation. These results are consistent with the inferences drawn from the simple comparisons of employees per officer and dollars of assets per employee obtained from Table 2.
While these results have been characterized in terms of their statistical significance, it may be useful to consider their practical significance. To illustrate the size of the changes after deregulation, we consider the estimated effects on the number of total personnel and the amount of total
personnel related expenses. The effect of DEREG is esti-mated to be a decrease of 2.6% to 3.2% in total personnel; evaluated at the mean of the pre-deregulation sample data this would imply a reduction of approximately 4.3 to 5.3 full time equivalent personnel. Considering total personnel-related expenditures, the estimates here indicate that, hold^ ing bank size and product mix constant, there was an expenditure saving of approximately $53000 to $62000 (in constant 1982 dollars). If the results for our sample are representative of the entire industry, this would indicate a total industry cost saving of approximately $700-800 million per year. While such an extrapolation is inherently inexact, these dollar figures indicate that the efficiency gains associated with deregulation and increased competition are sizeable.
VI. SUMMARY AND CONCLUSIONS
Expense preference behaviour has been extensively studied in the financial services industry. However, all of the pre-vious literature is based on data from the period prior to extensive deregulation of the industry. The present study adds to this literature by examining data obtained over the time period of substantial bank deregulation activity. Using several different measures, we find evidence that expense preference behaviour has decreased after the period of de-regulation in the banking industry. This result is consistent with theoretical expectations regarding industry and firm adaptations to the removal of regulations which restrict competition, and is consistent with recent studies which indicate that bank and savings and loan cost structures have
Table 3. Expense preference regression results Model (1) (2) (3) (4) (5) (6) (7) (8) (9) Dependent variable Total personnel Total personnel Non-officer employees Non-officer employees Total personnel-related expenditures Total personnel-related expenditures Occupancy expenses Furniture and Equipment Miscellaneous expenses Intercept - 12.4820 (111.27) -11.0468 (76.50) - 13.4839 (101.00) - 12.1232 (66.28) - 0.7605 (11.68) - 0.6683 (8.99) - 2.0759 (6.77) - 3.3270 (12.41) 1.2117 (8.83) DEREG - 0.0255 (2.27) -0.0315 (2.98) - 0.0629 (4.65) - 0.0686 (5.22) - 0.0177 (2.87) - 0.0167 (2.71) - 0.520 (2.35) 0.1692 (8.24) - 0.0277 (2.48) BST 0.2333 (20.26) 0.0164 (0.97) 0.2770 (19.78) 0.0716 (1.66) -0.0315 (4.94) - 0.0470 (4.84) -0.1000 (2.96) 0.0116 (0.34) - 0.0764 (4.65) LDT 0.2133 (21.33) 0.2083 (22.15) 0.2407 (20.05) 0.2359 (20.51) 0.0512 (9.12) 0.0527 (9.31) 0.0857 (4.00) 0.0541 (2.68) 0.0869 (70.59) LLD 0.730 (2.81) 0.0834 (3.51) 0.0623 (2.04) 0.721 (2.52) 0.0728 (5.24) 0.0743 (5.82) 0.1016 (2.25) . 0.0883 (2.23) 0.1430 (6.10) LBO — 0.1620 (16.63) — 0.1536 (13.15) — 0.0132 (2.23) 0.0876 (4.33) - 0.0298 (1.48) 0.0322 (3.21) ASSETS 0.9208 (151.99) 0.8400 (106.80) 0.9588 (134.12) 0.8821 (88.43) 0.2606 (22.33) 0.2623 (22.34) 0.1040 (2.34) 0.0791 (2.18) 0.2077 (10.54) LTWU — — — — 0.7330 (66.19) 0.7239 (55.21) 0.8836 (19.08) 0.9854 (20.44) 0.7774 (35.64) 0.9455 0.9516 0.9294 0.9343 0.9852 0.9853 0.8597 0.8659 0.9599
Absolute values of t-statistics in parentheses. All variables expressed in natural logarithms except DEREG and BST. All estimates corrected for heteroskedasticity using the White (1980) consistent covariance estimation procedure.
shifted over the period of financial industry deregulation (Gropper, 1991; LeCompte and Smith, 1990). Our findings are also consistent with Edwards' (1977) conclusion that the managers of regulated firms are likely to decrease expense preference behaviour when they are faced with greater com-petition. The estimates obtained here indicate that the cost savings for the entire industry may be in the range of hundreds of millions of dollars annually. These results sug-gest that one of the benefits of deregulation and increased competition has been to improve managerial efficiency in the banking industry, leading to more efficient use of re-sources in the provision of banking services.
ACKNOWLEDGEMENTS
The authors wish to extend particular thanks to Dave Kaserman, Bob Ekelund, and John Jackson for helpful comments.
REFERENCES
Akella, S. R. and Greenbaum, S. J. (1988) Savings and loan owner-ship structure and expense-preference. Journal of Banking and
Finance, 12, 419-37.
Arnould, R. J. (1985) Agency costs in banking firms: an analysis of expense preference behavior. Journal of Economics and
Busi-ness 37, 103-12.
Baumol, W. J., Panzar, J. C. and Willig, R. D. (1988) Contestable
Markets and the Theory of Industry Structure, rev. ed.,
Har-court Bruce Jovanovich, New York.
Blair, D. W. and Placone, D. L. (1988) Expense-preference behav-ior, agency costs, and firm organization. Journal of Economics
and Business, 40, 1-15.
Edwards, F. R. (1964) Concentration in banking and its effect on business loan rates. Review of Economics and Statistics, 46, 294-300.
Edwards, F. R. (1977) Managerial objectives in regulated indus-tries: expense preference behavior in banking. Journal of
Poli-tical Economy, 85, 147-62.
Edwards, F. R. and Edwards, L. (1974) Measuring the effectiveness of regulation: The case of the bank entry regulation. Journal of
Law and Economics, 17, 445-60.
Federal Reserve Bank of Chicago (1987) Leveling the Playing Field:
A Review of the DIDMCA of 1980 and the Garn-St Germain Act of 1982.
Freider, L. A. (1986) Interstate Banking. In Baer and Gregorash, eds. Toward Nationwide Banking, A Guide to the Issues, Fed-eral Reserve Bank of Chicago.
Goldschmid, H. J., Mann, H. M. and Weston, J. F., eds (1974)
Industrial Concentration: The New Learning, Little Brown,
Boston.
Gropper, D. M. (1991) An empirical investigation of changes in scale economies for the commercial banking firm, 1979-1986,
Journal of Money, Credit, and Banking, 23, 718-27.
Hannan, T. H. (1979) Expense-preference behavior in banking: A reexamination. Journal of Political Economy, October, 891-5.
Hannan, T. H. and Mavinga, F. (1980) Expense preference mana-gerial control: The case of the banking firm. The Bell Journal
Jacobs, D, (1971) Business Loan Costs and Bank Market Structure. Columbia University Press, New York,
Kaufman, G, S, (1989) The US Financial System: Money, Markets,
and Institutions 4th edn.. Prentice Hall, Englewood Cliffs, NJ,
LeCompte, R, and Smith, S, (1990) Changes in the cost of inter-mediation: The case of savings and loans. Journal of Finance, 45, 1337-46,
Mester, L, J, (1989) Testing for expense preference behavior: Mu-tual versus stock savings and loans. The Rand Journal of
Economics, 40, 483-95,
Peltzman, S, (1965) Entry in commercial banking. Journal of Law
and Economics, 8, 11-50,
Phillips, A, (1967) Evidence of concentration in bank markets and interest rates. Federal Reserve Bulletin, 53, 916-26,
Rees, R, (1974) A reconsideration ofthe expense preference theory of the firm, Econometrica, 41, 295-307,
Rhoades, S, A, (1980) Monopoly and expense preference behavior: An empirical investigation of a behavioralist hypothesis.
Southern Journal of Economics, October, 419-32,
Smirlock, M, and Marshall, W, (1983) Monopoly power and expense-preference behavior: theory and evidence to the con-trary. The Bell Journal of Economics, 14, 166-78,
Verbrugge, J, A, and Jahera, J, S, Jr, (1981) Expense preference behavior in the savings and loan industry. Journal of Money,
Credit and Banking, 13, 465-76,
Vernon, J, (1970) Ownership and control among large member banks. Journal of Finance, 25, 651-25,
Vernon, J, (1971) Separation of ownership and control and profit rates, the evidence from banking: Comment, Journal of
Finan-cial and Quantitative Analysis, 6, 615-25,
White, H, (1980) A heteroskedasticity-consistent covariance matrix estimator and a direct test for heteroskedasticy Econometrica, 48,817-38,
White, L, (1976) Price regulation and product quality rivalry in a profit maximizing model: The case of branch banking.
Journal of Money, Credit, and Banking, 8, 97-106,
Williamson, O, (1963) Managerial discretion and business behav-ior, American Economic Review, 53, 1032-57,