Code Complexity in Introductory Programming Courses
Petri Ihantola University of Helsinki Finland [email protected] Andrew PetersenUniversity of Toronto Mississauga Canada
Abstract
Instructors of introductory programming courses would benefit from having a metric for evaluating the sophistication of student code. Since introductory programming courses pack a wide spectrum of topics in a short timeframe, student code changes quickly, raising questions of whether existing software complexity metrics effectively reflect student growth as reflected in their code. We investigate code produced by over 800 students in two different Python-based CS1 courses to determine if frequently used code quality and complexity metrics (e.g., cyclomatic and Halstead complexities) or metrics based on length and syntactic complexity are more effective as a heuristic for gauging students’ progress through a course. We conclude that the traditional metrics do not correlate well with time passed in the course. In contrast, metrics based on syntactic complexity and solution size correlate strongly with time in the course, suggesting that they may be more appropriate for evaluating how student code evolves in a course context.
1.
Introduction
Introductory programming courses cover huge amounts of interconnected concepts, as illustrated by Tew and Guzdial in their content analysis of most widely adopted introductory programming (CS1) textbooks [1]. Prerequisites between the concepts guide course design and restrict the order in which various topics may be introduced [2, 3, 4, 5]. Sorva and Sepp¨al¨a argue that from a pedagogical view point, the concepts should be introduced first in isolation and later combined with other topics [4]. Many introductory programming courses follow this approach. However, this could go too far. Several groups have noted that typical assessments contain a large (15+) number of concepts [6, 7, 5], and Luxton-Reilly has raised the concern that our tendency to evaluate material in combination is unreasonable given the brief amount of time in a typical course [8].
As students learn to program, they become increasingly capable of solving different and more challenging problems. To some extent, complexity of the code correlates with skills: students demonstrate their ability to use various concepts together and build something nontrivial but meaningful. However, a simple problem can also be solved with complex code. Thus, complexity can indicate alackof skill.
Also, sometimes the difficulty of the tasks is related to problem solving, and sometimes it’s related to complexity of software constructs needed in the task. Often the algorithmic difficulty is combination of both of these aspects. The extent to which concepts are applied in combination raises the questions of how the complexity of student code increases over the term, and whether existing software complexity metrics can effectively measure the increase in complexity of student code – just like complexity measures such as Halstead’s difficulty [9] and McCabe’s cyclomatic complexity [10] have been used to predict the difficulties what professional programmers experience in reading and modifying code [11]. In this study, we answer the following research question: How do the selected code quality metrics correlate with time passed in the course? To explore this question, we evaluate code produced by over 800 students in two different Python-based CS1 courses using a variety of heuristics. We compare frequently used code quality and complexity metrics (e.g., cyclomatic complexity and Halstead difficulty) to ones currently used in computing education that are based on syntactic complexity.
The various complexity metrics and how they have been previously applied in computing education research is discussed in Section 2. Details of the data collection will be provided in Section 3. The relevant results, including the correlations, will be provided in Section 4. Finally, implications to computing education (research) and concluding remarks will be provided in Sections 5 and 6.
2.
Background
Failure rates in CS1 have been observed to exceed 30% [12], and this observation has driven efforts in the computing education community to identify the causes of the difficulty. One thread of research has explored the assessments we use. In this context, even the definition of difficulty is not straightforward. It can be estimated by using self-reported and automatically collected data (e.g., time needed to solve a task), but commonly used measures to may not correlate with each other [13]. In this study we focus on automatically extracted features from the code itself.
The first reviews of computing assessments focused on exams. They found that exam question difficulty varied significantly [14, 15, 16] and that most exam questions contained multiple concepts [17]. Furthermore, they argued that while academics can evaluate the difficulty of their exams, exam questions often included more conceptual elements than an instructor or researcher would independently identify [17, 18]. Taken together, these results suggest, as several groups have argued, that we may simply be asking too much of our students by the end of the course [6, 8], which then leads to the question, “Are we expecting too much too quickly throughout the course?”
2.1.
Evaluating Complexity in Computing
Courses
The “difficulty” and “concepts” attributes that various groups used to evaluate computing assessments were not precisely defined. Difficulty was frequently evaluated by manually categorizing items using a learning taxonomy. The SOLO taxonomy, which had been successfully used to evaluate student responses to questions [19, 20, 21], was not as reliable when used to evaluate assessments or prompts [14, 16], and another group had difficulty applying Bloom’s taxonomy for a similar task [17]. Furthermore, the idea of “concepts” varied significantly across groups. Most used definitions for concepts that corresponded with sections of computing courses, as they were derived from surveys of instructors [22, 23], rather than directly from code. Later efforts used data mining techniques to identify particularly difficult concepts (see [24] for an overview of educational data mining in computing education), with the most recent efforts using syntactic structures as a proxy for “concepts” [7, 5]. These efforts have confirmed that assessments used in computing courses typically include large numbers of syntactic elements.
However, we do not yet know how complexity increases within courses. We have some evidence that
there are particularly difficult points in CS courses [22, 25, 26], but we have little information about how quickly difficulty increases in courses. The work on learning curves, by Rivers et al [26], is most relevant, as it identifies topics where students appear to learn (their rate of error production decreases), but it does not seek to compare the relative difficulty of topics through a course.
2.2.
Code Complexity
Thus far, in computing education, evaluating code complexity has either involved expert evaluation or the use of convenient heuristics, such as the number of syntactic elements in a piece of code. This work considers metrics that have been used as proxies for code complexity in software engineering, to see whether they are more effective than the concept-based heuristics used in computing education. We selected the heuristics in our study based on their use in recent studies comparing metrics [27] or due to their use in computing education [7, 28]. We omitted metrics for object-oriented code, as the CS1 courses we studied introduced objects late in the term, as a last or second to last topic.
While metrics-driven software engineering has fallen out of favour, the metrics we are studying remain in common usage as they are a convenient quantitative method for measuring code [29]. They have also been well studied. Lines of code (LOC) and the Halstead [30] and McCabe (cyclomatic) [10] metrics, which can be computed using syntactic elements in code, were examined in the 1970’s and early 1980’s [11, 31]. Whereas McCabe focuses on the control flow graph by measuring the number of linearly independent paths through a program, Halstead metrics (there are many of them) are based on length (number of operators and operands) of and vocabulary (number of distinct operators and operands) used in a program.
While not all of these metrics are applicable across languages or when used to predict quality [32], they have the virtue of being easy to calculate using just student code and may still have validity for evaluating student performance. Recent work in computing education has suggested that, if these metrics were used to evaluate individual student performance, length-based metrics of student code correlate positively with student performance and that the Halstead metrics correlate negatively [28]. A na¨ıve interpretation of the results is that students struggling with difficult code (in terms of Halstead) may write more brief (or incomplete) answers.
engineering to student work is that professional development is significantly different from the tasks performed by students. Work in both software engineering and computing education has compared students and professionals [33, 34, 35, 36, 37] and, in many cases, has found differences in performance and approach. This work applies a range of heuristics to student code to see if the heuristics exhibit desirable behaviours in a computing course context.
2.3.
Code and Conceptual Complexity
It isn’t immediately obvious that simple metrics for measuring code complexity, like lines of code or number of syntactic elements, are at all related to the cognitive complexity being encountered by the author or reader of the code. Classic work in computing education and in learning theory argues that learners accumulate schema, rather than building up their knowledge from a thorough understanding of each small element of the code [38, 39]. The application of this work in computing pedagogy, however, leads to courses that focus on pattern acquisition [2]. Errors, in this model, occur when a schema is applied in an unfamiliar context or modified in a way that reveals a flaw in the learner’s understanding of the elements that compose the schema [38, 40, 41]. After a break in the 90’s, the idea has seen increased interest, with new work using schema theory to identify complex tasks or particularly difficult elements of courses, much like the work in data mining [42, 43, 44].
This work does not seek to explore the cognitive tasks that novices perform as they learn to code. We believe that, regardless of the method used in instruction, that it is likely that code complexity may still be used as a proxy for increasing difficulty. We seek to identify heuristics that can be applied to code artifacts produced in courses and explore whether these heuristics behave “nicely” in terms of gauging progress through a course.
3.
Methodology and Data
3.1.
Data Collection
Our analysis is based on two datasets of student code obtained from different universities. Both courses are taught in Python and make extensive use of automated assessment: on a weekly basis, brief exercises are assigned in an online system, and students receive automated feedback immediately upon submission. The data was collected from two institutions so that we do not simply measure the influence of a single instructor or mode of instruction on code style.
The first dataset (A) is from a research intensive North American university and consists of submissions to an online programming exercise system as well as standalone assignment submissions. The course lasts 12 weeks, with students completing sets of short, online exercises every week in addition to larger, multi-week assignments submitted in weeks 5, 9, and 12. The course is taught without any expectation that students have prior experience but aims to prepare students to enter the computer science program, so topics introduced range from basic syntax (types, expressions, variables, conditionals, loops, and functions) to software tools and processes (including unittests, test-driven development, and stylistic issues) and small tastes of later computer science topics (sorting algorithms, complexity, and object oriented design). Data was collected in Fall 2017, with 912 students providing consent for their data to be analyzed. This resulted in 61524 exercise submissions from 88 problems and 2175 submissions across three assignments.
The second dataset (B) is from a research intensive North European university. The course lasts 15 weeks, and grading is based on weekly, automatically assessed programming tasks. There is no clear distinction between assignment and exercises as students receive immediate automated feedback from all the tasks they do. From a few tasks, students get additional feedback from the teaching assistants (e.g., about how the code is organized). Although the difference is small, we will refer to exercises with manual feedback as assignments to be consistent with the other data set. The course is taught without prerequisites and is provided for all first year students in the university. Topics covered in the course are similar to Course A except that test driven development is not discussed. Data was collected in Spring 2017, when 161 students working with 102 separate programming exercises producing 8997 submissions.
Both datasets contain submissions from multiple weeks and multiple exercises per week. For all tasks, only students’ last submissions are included. The number of exercises and assignments due to each week, and the average number of exercises submitted by each student is provided in Table 1. The fairly large number of exercises in week 3 of Course A is explained by an administrative requirement: students can add the course through the second week, so to avoid disadvantaging them, all of the work assigned in the first two weeks is actually due in the third week.
Table 1. Descriptive statistics of both datasets with the number of exercises each week, the average number of exercises solved by each student, and number of students submitting exercise each week
Week 1 2 3 4 5 6 7 8 9 10 11 12 13 14 15 Course A Available - - 28 16 10 2 6 7 2 3 7 7 - - -Submitted - - 24.1 14.2 8.7 2.0 5.1 5.8 1.9 2.9 6.7 5.4 - - -Students - - 902 832 797 624 768 736 605 639 648 647 - - -Course B Available 7 13 8 7 10 11 9 7 5 4 9 4 5 2 1 Submitted 6.5 11.6 7.2 5.4 8.2 8.0 6.7 5.6 3.1 2.4 5.6 1.7 2.9 1.4 1 Students 152 150 139 129 129 116 111 104 94 78 83 63 57 28 13
3.2.
Analysis
First, for all the final submissions, we calculated the following metrics: lines of code in the submitted files, concept count, number of operators, number of unique operators, number of operands, number of unique operands, Halstead metrics (content, length, difficulty, effort, time, error, delivered bugs), and McCabe’s cyclomatic complexity. The Radon software package was used to calculate all of the metrics except for concept count [45]. Concept counts were derived directly from an abstract syntax tree by assigning each token to one of the categories defined in Luxton-Reilly and Petersen’s work [7]. Metrics were calculated per-file (“per-module”) except for McCabe’s complexity. For example, when calculating concept count, every concept identified in the file was counted. When calculating McCabe’s complexity, the complexity of each function in the file as well as the complexity of the code at the top level was computed. We report on both the maximum McCabe complexity obtained and the sum of the McCabe complexities.
Next, we grouped this data by student and week and, for each group, emitted the maximum in each of the previously listed metrics. In other words, for each student, we calculated how complex the metrics get every week. It should be noted metrics are selected independently. For example, maximum source lines of code for a student in week 1 may be related to a different exercise than the highest cyclomatic complexity by the same student. As the primary goals of this study is to investigate how metrics correlate with the time passed in the course, we calculated Spearman’s rank correlations between all the metrics and week numbers. In Course A, assignments were designed to be very different from the exercises. For example, assignments were clearly larger than exercises (Figure 1). Thus, correlations were calculated for exercises only. In Course B, exercises and assignments were designed to be comparable so the correlations were calculated
for exercises and assignments together. The number of available distinct assignments in both course was relatively small so correlations were not calculated separately for them.
4.
Results
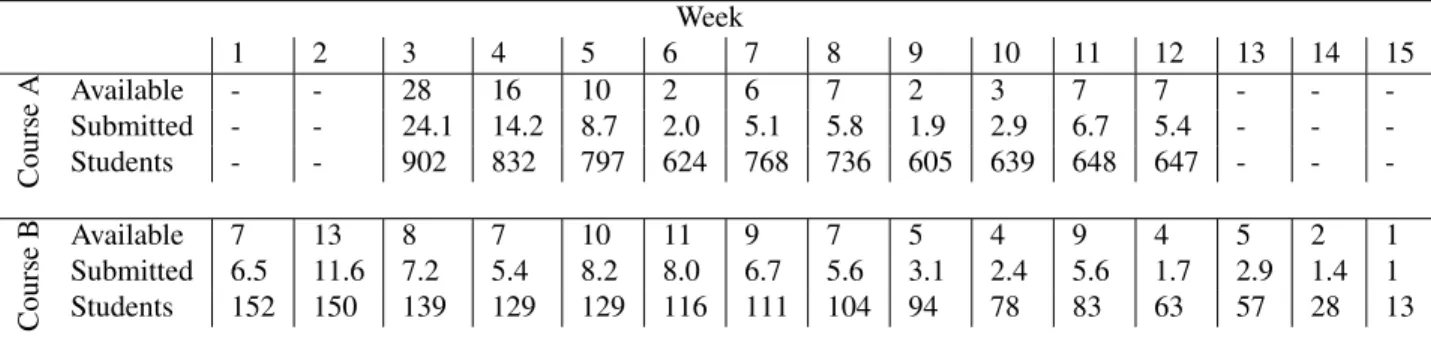
Static code metrics are often based on or highly correlated with lines of code. Therefore, we start our analysis by looking at the length of the solutions in different weeks. The distribution of the largest submission made by each student each week is provided in Figure 1. Exercises in Course A are smaller than in Course B, but the assignments are bigger, so they stand out from the exercises. Exercises and assignments are nearly interchangeable in Course B (as explained in Section 3.1).
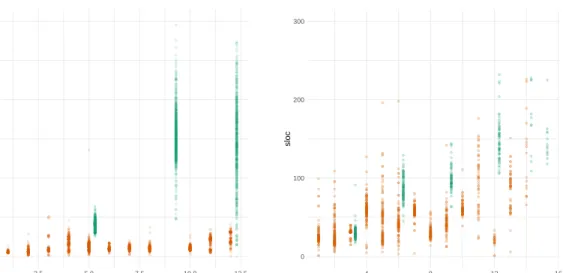
The fact that assignments are so different from the exercises in Course A provides an interesting opportunity to compare the metrics to each other. We created plots similar to Figure 1 for all the metrics. Assignments stand out from exercises in all dimensions except for concept count and the number of unique operators. In other dimensions, the assignments were at least an order of magnitude more “complex” than the exercises. As an example, the scatter plot of the number of concepts in submissions to assignments and exercises in Course A is provided in Figure 2. As a result, we only consider the exercises in Course A in our next step.
Table 2 records the Spearman rank correlations, corrected for multiple comparisons using the Holm method, between the complexity metrics and the amount of time passed in the course. While many correlations are significant, most are weak. Only the concept count and lines of code (loc) metrics are strongly correlated with the time passed in the course. Towards the end of the course, students produce bigger programs and utilize more concepts in their programs. However, the Halstead metrics and cyclomatic complexity do not correlate well with the time passed in the course. The moderate
0 100 200 300 2.5 5.0 7.5 10.0 12.5 week sloc 0 100 200 300 4 8 12 16 week sloc
Figure 1. Submissions sizes of largest submitted assignments each week measured in source lines of code (sloc). Course A is to the left, and Course B is to the right. Assignments are shifted slightly right in the visualization to avoid overlapping with the exercises in the same week. Assignments are in green, and exercises are in orange.
0 10 20 30 40 2.5 5.0 7.5 10.0 12.5 week concepts
Figure 2. Scatter plot of highest weekly concept count per student in Course A. Assignments are in
green, and exercises are in orange.
correlation seen when the cyclomatic complexities for each function are added together (“sum(mccabe)”) is explained by the increasing length of the solutions (i.e., there are more (cyclomatically) simple functions in the submission than earlier in the term).
5.
Discussion
This multi-institutional and multi-national study was set up to explore how various static complexity measures capture students growth in introductory programming courses, with the goal of identifying whether any simple metrics might reflect our expectations of students. Our hope was that metrics in use in software engineering would provide additional insight, but neither the Halstead metrics (or any of their constituent components) nor McCabe’s cyclomatic complexity were strongly correlated with time passed in the courses we studied. Instead, simple counts of syntactic elements (aggregated into “concepts”) and lines of code have a stronger relationship with student progress in a course.
5.1.
Halstead and McCabe Metrics
The Halstead metrics behaved slightly differently in courses A and B. In course A, correlations were significant, if weak. (In course A, the number of unique operators, which is a component of some Halstead metrics, reached a moderate correlation.) The correlations were not significant in Course B. Course A had many more students in it than course B, however, which might simply mean that course B’s population does not reflect the distribution as accurately.
Table 2. Spearman rank correlations between the metrics and time passed in the course (week in the course). Significance values are corrected (Holm) for multiple comparisons.
Course A Course B Course B
exercises exercises both
concepts 0.815∗∗ 0.673∗∗ 0.695∗∗ operators 0.184∗∗ -0.050 0.097∗∗ operands 0.202∗∗ -0.076 0.075∗ unique operators 0.433∗∗ 0.045 0.097∗∗ unique operands 0.250∗∗ 0.025 0.185∗∗ Halstead content 0.324∗∗ 0.043 0.196∗∗ Halstead length 0.207∗∗ -0.067 0.083∗ Halstad difficulty 0.161∗∗ -0.178∗∗ -0.177∗∗ Halstead volume 0.240∗∗ -0.044 0.109∗∗ Halstead effort 0.273∗∗ -0.069 0.052 Halstead time 0.273∗∗ -0.069 0.052
Halstead error estimate 0.273∗∗ -0.069 0.052
lines of code (loc) 0.798∗∗ 0.563∗∗ 0.632∗∗
blank loc 0.879∗∗ 0.594∗∗ 0.639∗∗
lines of code and comments -0.050∗∗ 0.413∗∗ 0.407∗∗
lines of code (sloc) 0.631∗∗ 0.511∗∗ 0.612∗∗
McCabe -0.506∗∗ -0.026 0.078
sum(McCabe) 0.425∗∗ 0.262∗∗ 0.423∗∗
∗p<0.05;∗∗p<0.01; metrics with correlations>0.6 italicized
Alternatively, some of the earlier tasks in Course B may be designed so that the a typical solution has high Halstead metrics – in which case there relation is no longer monotonic.
Similarly, we saw a significant, moderate correlation between McCabe’s complexity and time in the course for Course A but not Course B. The relationship in course A is negative, suggesting that students write simpler code, from a cyclomatic perspective, later in the course than they do earlier in the course. This probably reflects the course content, which emphasizes conditionals early in the semester, providing several complex examples per week. Examples with sequential and nested if statements are rare in the second half of the term, as other material is being emphasized. Only students struggling with the course will still be (rarely) writing complex conditionals, as Castellanos et al. found when they stated that “cyclomatic complexity is negatively correlated to learning strategies like the effort regulation, elaboration of ideas and critical thinking” [28]. From this point of view, it is good that the only clear correlation (with the time passed in the course in Course A) is negative.
Overall, our sense is that traditional software engineering code metrics are less effective at measuring growth throughout the course because typical tasks in courses are limited in size. Halstead metrics, in
particular, rely on a comparison between code size and the variety of operators used. Cyclomatic complexity focuses on control flow structures, and the exercises, being brief, typically focus on a small number of such structures in each exercise. In the educational context, it may be common for a brief exercise to be filled with complex constructs. These issues align with previous observations that “software complexity metrics, for example, rarely measure the ‘inherent complexity’ embedded in software systems, but they do a very good job of comparing the relative complexity of one portion of a system with another” [46].
5.2.
Concept Counts and Lines of Code
The number of concepts and several of the variants of lines of code were strongly correlated with the progress in both courses. We argue that compared to the other metrics, concept count is most directly related to how we currently teach courses. Exercises are often designed to showcase or to practice new material and assume familiarity with previously introduced ones. As a result, the number of syntactic elements in code (and hence, the number of concepts) increases each week.
Furthermore, building on previous concepts requires more space, so the increase in lines of codes is inevitable. The high correlation with blank lines of code
and stems from a similar source. We typically use blanks to separate blocks of code, both between functions and within them. As we ask students to write more functions or to incorporate sequences of logical blocks within functions, blank lines naturally increase.
We need to emphasize that while the number of concepts and the number of lines of code are related, it’s the number of concepts driving code size in courses and not the number of lines driving the number of concepts. As revealed in Figures 1 and 2, concept counts in Course A increase even as lines of code do not (see weeks 4-8), suggesting that attempts to restrict the size of exercises do not necessarily throttle the number of concepts that are required.
These results bring us back to our original context. We began this work because we were concerned by results that suggested that students were being assessed on too many items, simultaneously, at the end of their course. This data suggests that the number of concepts students engage with is the most accurate metric we have for gauging students progress through the course and, furthermore, that the number of concepts approaches the levels seen in exams (15+) by week 4 and appears to increase throughout the course [7, 5]. There are no particular points in the term where complexity, as measured by concept count, increases dramatically, though course structure (the use of larger assignments) can lead to points where students are expected to integrate even more ideas together than they are typically required to do.
This is a strong and concerning result, as it suggests that, if the number of concepts being assessed simultaneously is, in fact, a problem, then the means of assessment used throughout the term are as or even more problematic than the exams being used at the end of the term.
5.3.
Validity
There are at least three factors that should be considered when evaluating these findings, in addition to those raised earlier. First, the grading scheme in Course B allows skipping entire exercise weeks if a student has collected enough points from the earlier weeks. Indeed, when looking at the number of active students each week (Table 1) the number of students submitting code in Course ˜A decreases at the end of the term. This can create a selection bias as the remaining students may be either the strongest or the weakest (who have not collected enough points to earlier). Our anonymized data does not allow us to check. However, the amount of students in the Course B remains consistent throughout the course. Therefore,
we assume that the trends we see in both of the courses (see Table 2) are real, in a sense that they reflect what could be seen in other courses.
Second, we are only considering two courses taught in a single language with a relatively similar style. Both courses defer objects until late in the course and rely on weekly practice. Courses taught in other languages could reveal other trends, as could courses that rely solely on assignments.
Third, we made several decisions about how to organize the data for analysis that may impact the results. All of the exercises that are due are assigned to a particular week, but not all of the exercises serve the same purpose. Some may introduce a single concept in isolation, while others may be asking students to review material from previous weeks, to apply it in a more complex situation, or to combine multiple previously identified concepts. A more precise analysis might reveal additional, or different trends. However, this also suggests that any metrics need to be applied to a time window, rather than to individual code artifacts: local changes are natural when tasks vary, so to characterize performance accurately, metrics must be applied to all of the tasks a student is being asked to perform in a given time period.
6.
Conclusion
Our analysis of code produced by over 800 students in two different Python-based CS1 courses suggests that syntax-based concept counts and, to a lesser extent, lines of code are more effective and consistent measures of student progress through a course than more sophisticated measures popularized in software engineering. Syntax-based concept counts and lines of code are both strongly correlated with progress in the course for both courses observed. While some weaker results were observed for both Halstead and McCabe complexity metrics in one course, the results were not uniform across both courses, which makes the strong and consistent correlation observed for concept counts more notable. While validation in additional contexts is required, we believe this result provides positive evidence that syntactic concept counts may be useful as a heuristic for gauging progress through a course or identifying whether code may be too complex for students at a particular point in a course.
This result also extends existing work in computing education that has found that end of term assessments involve unexpectedly large numbers of concepts. The fact that concept counts rise rapidly – reaching a max of 15 concepts as early as week 4 – and then gradually increase through the course suggests that students are
being asked to integrate multiple syntactic structures from very early in the programming career. If the number of concepts being assessed is a problem, as has been hypothesized by Luxton-Reilly [8], or if mixing or modification of schema (or patterns) is the source of errors, as others have argued [38], then this result suggests that there may be a problem with how some introductory computing courses are formulated. Additional work will be required to determine if the number of syntactic concepts students are being asked to work with is too ambitious. However, if it is the case, then scaffolding may be required to help learners quickly achieve the proficiency required to deal with the levels of complexity we require.
References
[1] A. E. Tew and M. Guzdial, “Developing a validated
assessment of fundamental CS1 concepts,” in
Proceedings of the 41st ACM Technical Symposium on Computer Science Education, SIGCSE ’10, (New York, NY, USA), pp. 97–101, ACM, 2010.
[2] M. E. Caspersen and J. Bennedsen, “Instructional design of a programming course: A learning theoretic
approach,” in Proceedings of the Third International
Workshop on Computing Education Research, ICER ’07, (New York, NY, USA), pp. 111–122, ACM, 2007. [3] P. Niemel¨a, T. Partanen, M. Harsu, L. Lepp¨anen, and
P. Ihantola, “Computational thinking as an emergent
learning trajectory of mathematics,” in Proceedings
of the 17th Koli Calling International Conference on Computing Education Research, Koli Calling ’17, (New York, NY, USA), pp. 70–79, ACM, 2017.
[4] J. Sorva and O. Sepp¨al¨a, “Research-based design of
the first weeks of CS1,” in Proceedings of the 14th
Koli Calling International Conference on Computing Education Research, Koli Calling ’14, (New York, NY, USA), pp. 71–80, ACM, 2014.
[5] A. Luxton-Reilly, B. A. Becker, Y. Cao, R. McDermott, C. Mirolo, A. M¨uhling, A. Petersen, K. Sanders, Simon, and J. Whalley, “Developing assessments to determine mastery of programming fundamentals,” in Proceedings of the 2017 ACM Conference on Innovation and Technology in Computer Science Education, ITiCSE ’17, (New York, NY, USA), pp. 388–388, ACM, 2017. [6] D. Zingaro, A. Petersen, and M. Craig, “Stepping up
to integrative questions on CS1 exams,” inProceedings
of the 43rd ACM Technical Symposium on Computer Science Education, SIGCSE ’12, (New York, NY, USA), pp. 253–258, ACM, 2012.
[7] A. Luxton-Reilly and A. Petersen, “The Compound
Nature of Novice Programming Assessments,” in
Proceedings of the 19th Australasian Computing Education Conference, ACE ’17, pp. 26–35, 2017. [8] A. Luxton-Reilly, “Learning to program is easy,” in
Proceedings of the 2016 ACM Conference on Innovation and Technology in Computer Science Education, ITiCSE ’16, (New York, NY, USA), pp. 284–289, ACM, 2016. [9] M. H. Halstead, “Natural laws controlling algorithm
structure?,” ACM Sigplan Notices, vol. 7, no. 2,
pp. 19–26, 1972.
[10] T. J. McCabe, “A complexity measure,” IEEE
Transactions on software Engineering, no. 4, pp. 308–320, 1976.
[11] B. Curtis, S. B. Sheppard, P. Milliman, M. Borst, and T. Love, “Measuring the psychological complexity of software maintenance tasks with the halstead and mccabe
metrics,” IEEE Transactions on software engineering,
no. 2, pp. 96–104, 1979.
[12] J. Bennedsen and M. E. Caspersen, “Failure rates in
introductory programming,” SIGCSE Bull., vol. 39,
pp. 32–36, June 2007.
[13] J. Leinonen, L. Lepp¨anen, P. Ihantola, and A. Hellas,
“Comparison of time metrics in programming,”
in Proceedings of the 2017 ACM Conference
on International Computing Education Research, pp. 200–208, ACM, 2017.
[14] Simon, D. Chinn, M. de Raadt, A. Philpott, J. Sheard, M.-J. Laakso, D. D’Souza, J. Skene, A. Carbone, T. Clear, R. Lister, and G. Warburton, “Introductory
programming: Examining the exams,” inProceedings
of the Fourteenth Australasian Computing Education Conference - Volume 123, ACE ’12, (Darlinghurst, Australia, Australia), pp. 61–70, Australian Computer Society, Inc., 2012.
[15] J. Harland, D. D’Souza, and M. Hamilton, “A
comparative analysis of results on programming exams,” inProceedings of the Fifteenth Australasian Computing Education Conference - Volume 136, ACE ’13,
(Darlinghurst, Australia, Australia), pp. 117–126,
Australian Computer Society, Inc., 2013.
[16] J. Sheard, Simon, A. Carbone, D. Chinn, T. Clear, M. Corney, D. D’Souza, J. Fenwick, J. Harland, M.-J. Laakso, and D. Teague, “How difficult are exams?: A framework for assessing the complexity of introductory
programming exams,” in Proceedings of the Fifteenth
Australasian Computing Education Conference - Volume 136, ACE ’13, (Darlinghurst, Australia, Australia), pp. 145–154, Australian Computer Society, Inc., 2013. [17] A. Petersen, M. Craig, and D. Zingaro, “Reviewing
CS1 exam question content,” in Proceedings of the
42Nd ACM Technical Symposium on Computer Science Education, SIGCSE ’11, (New York, NY, USA), pp. 631–636, ACM, 2011.
[18] Simon, D. D’Souza, J. Sheard, J. Harland, A. Carbone, and M.-J. Laakso, “Can computing academics assess the difficulty of programming examination questions?,” in Proceedings of the 12th Koli Calling International Conference on Computing Education Research, Koli Calling ’12, (New York, NY, USA), pp. 160–163, ACM, 2012.
[19] R. Lister, B. Simon, E. Thompson, J. L. Whalley, and C. Prasad, “Not seeing the forest for the trees: Novice
programmers and the SOLO taxonomy,”SIGCSE Bull.,
vol. 38, pp. 118–122, June 2006.
[20] T. Clear, J. Whalley, R. Lister, A. Carbone, M. Hu, J. Sheard, B. Simon, and E. Thompson, “Reliably classifying novice programmer exam responses using
the SOLO taxonomy,”National Advisory Committee on
Computing Qualifications, 2008.
[21] J. Sheard, A. Carbone, R. Lister, B. Simon,
E. Thompson, and J. L. Whalley, “Going SOLO to
assess novice programmers,” SIGCSE Bull., vol. 40,
pp. 209–213, June 2008.
[22] N. B. Dale, “Most difficult topics in CS1: Results of
an online survey of educators,” SIGCSE Bull., vol. 38,
[23] C. Schulte and J. Bennedsen, “What do teachers
teach in introductory programming?,” in Proceedings
of the Second International Workshop on Computing Education Research, ICER ’06, (New York, NY, USA), pp. 17–28, ACM, 2006.
[24] P. Ihantola, A. Vihavainen, A. Ahadi, M. Butler, J. B¨orstler, S. H. Edwards, E. Isohanni, A. Korhonen, A. Petersen, K. Rivers, M. A. Rubio, J. Sheard,
B. Skupas, J. Spacco, C. Szabo, and D. Toll,
“Educational data mining and learning analytics in programming: Literature review and case studies,” in Proceedings of the 2015 ITiCSE on Working Group Reports, ITICSE-WGR ’15, (New York, NY, USA), pp. 41–63, ACM, 2015.
[25] Y. Cherenkova, D. Zingaro, and A. Petersen, “Identifying challenging CS1 concepts in a large problem dataset,” in Proceedings of the 45th ACM Technical Symposium on Computer Science Education, SIGCSE ’14, (New York, NY, USA), pp. 695–700, ACM, 2014.
[26] K. Rivers, E. Harpstead, and K. Koedinger, “Learning
curve analysis for programming: Which concepts
do students struggle with?,” in Proceedings of the
2016 ACM Conference on International Computing Education Research, ICER ’16, (New York, NY, USA), pp. 143–151, ACM, 2016.
[27] Y. Jiang, B. Cuki, T. Menzies, and N. Bartlow, “Comparing design and code metrics for software quality
prediction,” in Proceedings of the 4th international
workshop on Predictor models in software engineering, pp. 11–18, ACM, 2008.
[28] H. Castellanos, F. Restrepo-Calle, F. A. Gonz´alez, and J. J. R. Echeverry, “Understanding the relationships between self-regulated learning and students source code
in a computer programming course,” in Frontiers in
Education Conference (FIE), pp. 1–9, IEEE, 2017. [29] J. Voas and R. Kuhn, “What happened to software
metrics?,”Computer, vol. 50, no. 5, p. 88, 2017.
[30] M. H. Halstead et al., Elements of Software Science
(Operating and programming systems series). Elsevier Science Inc., New York, NY, 1977.
[31] C. T. Bailey and W. L. Dingee, “A software
study using halstead metrics,” in Proceedings of the
1981 ACM Workshop/Symposium on Measurement and Evaluation of Software Quality, (New York, NY, USA), pp. 189–197, ACM, 1981.
[32] C. Jones, “Software metrics: good, bad and missing,” Computer, vol. 27, no. 9, pp. 98–100, 1994.
[33] M. Weiser and J. Shertz, “Programming problem representation in novice and expert programmers,” International Journal of Man-Machine Studies, vol. 19, no. 4, pp. 391–398, 1983.
[34] S. Wiedenbeck, “Novice/expert differences in
programming skills,” International Journal of
Man-Machine Studies, vol. 23, no. 4, pp. 383–390, 1985.
[35] K. M. Lui and K. C. Chan, “Pair programming
productivity: Novice–novice vs. expert–expert,”
International Journal of Human-computer studies, vol. 64, no. 9, pp. 915–925, 2006.
[36] M. J. Jacobson, “Problem solving about complex systems: Differences between experts and novices,” in Proceedings of the 4th International Conference of the Learning Sciences, pp. 14–21, Erlbaum, 2013.
[37] I. Salman, A. T. Misirli, and N. Juristo, “Are students representatives of professionals in software engineering
experiments?,” inProceedings of the 37th International
Conference on Software Engineering - Volume 1, ICSE ’15, (Piscataway, NJ, USA), pp. 666–676, IEEE Press, 2015.
[38] J. C. Spohrer, E. Soloway, and E. Pope, “A goal/plan
analysis of buggy pascal programs,” Hum.-Comput.
Interact., vol. 1, pp. 163–207, June 1985.
[39] R. S. Rist, “Schema creation in programming,”Cognitive
Science, vol. 13, no. 3, pp. 389–414, 1989.
[40] O. Muller, D. Ginat, and B. Haberman, “Pattern-oriented instruction and its influence on problem decomposition
and solution construction,” in Proceedings of the
12th Annual SIGCSE Conference on Innovation and Technology in Computer Science Education, ITiCSE ’07, (New York, NY, USA), pp. 151–155, ACM, 2007.
[41] D. Ginat, E. Menashe, and A. Taya, “Novice
difficulties with interleaved pattern composition,” in Proceedings of the 6th International Conference on Informatics in Schools: Situation, Evolution, and Perspectives, ISSEP’13, (Berlin, Heidelberg), pp. 57–67, Springer-Verlag, 2013.
[42] I. Cetin, “Students’ understanding of loops and nested
loops in computer programming: An apos theory
perspective,”Canadian Journal of Science, Mathematics
and Technology Education, vol. 15, no. 2, pp. 155–170, 2015.
[43] O. Sepp¨al¨a, P. Ihantola, E. Isohanni, J. Sorva, and A. Vihavainen, “Do we know how difficult the rainfall
problem is?,” in Proceedings of the 15th Koli Calling
Conference on Computing Education Research, Koli Calling ’15, (New York, NY, USA), pp. 87–96, ACM, 2015.
[44] D. Zehetmeier, A. B¨ottcher, A. Br¨uggemann-Klein, and V. Thurner, “Development of a classification scheme for errors observed in the process of computer programming
education,” in 1st International Conference on Higher
Education Advances (HEAD’15), pp. 475–484, Editorial Universitat Polit`ecnica de Val`encia, 2015.
[45] M. Lacchia, “Radon.” https://pypi.org/
project/radon/, 2012–2018.
[46] D. Coleman, D. Ash, B. Lowther, and P. Oman, “Using metrics to evaluate software system maintainability,” Computer, vol. 27, no. 8, pp. 44–49, 1994.