University of Nebraska - Lincoln University of Nebraska - Lincoln
DigitalCommons@University of Nebraska - Lincoln
DigitalCommons@University of Nebraska - Lincoln
Faculty Publications, UNL Libraries Libraries at University of Nebraska-Lincoln 1-10-2020
Digital Libraries, Intelligent Data Analytics, and Augmented
Digital Libraries, Intelligent Data Analytics, and Augmented
Description: A Demonstration Project
Description: A Demonstration Project
Elizabeth LorangUniversity of Nebraska - Lincoln, [email protected] Leen-Kiat Soh
University of Nebraska - Lincoln, [email protected] Yi Liu
University of Nebraska-Lincoln, [email protected] Chulwoo Pack
University of Nebraska-Lincoln, [email protected]
Follow this and additional works at: https://digitalcommons.unl.edu/libraryscience
Part of the Artificial Intelligence and Robotics Commons, Digital Humanities Commons, Library and Information Science Commons, and the Museum Studies Commons
Lorang, Elizabeth; Soh, Leen-Kiat; Liu, Yi; and Pack, Chulwoo, "Digital Libraries, Intelligent Data Analytics, and Augmented Description: A Demonstration Project" (2020). Faculty Publications, UNL Libraries. 396. https://digitalcommons.unl.edu/libraryscience/396
This Article is brought to you for free and open access by the Libraries at University of Nebraska-Lincoln at DigitalCommons@University of Nebraska - Lincoln. It has been accepted for inclusion in Faculty Publications, UNL Libraries by an authorized administrator of DigitalCommons@University of Nebraska - Lincoln.
D
IGITAL
L
IBRARIES
,
I
NTELLIGENT
D
ATA
A
NALYTICS
,
AND
A
UGMENTED
D
ESCRIPTION
:
A
D
EMONSTRATION
P
ROJECT
FINAL REPORT
PREPARED BY ELIZABETH LORANG, LEEN-KIAT SOH, YI LIU, AND CHULWOO PACK
UNIVERSITY LIBRARIES & DEPARTMENT OF COMPUTER SCIENCE AND ENGINEERING
UNIVERSITY OF NEBRASKA–LINCOLN
S
UBMITTED TO THEL
IBRARY OFC
ONGRESSJ
ANUARY10,
2020
R
EV.
M
ARCH26,
2020
1R
EV.
J
UNE15,
2020
21 This revision included updated information about the code repository in section 4 (Code & Data), a new footnote
about Beyond Words on page 10, and two additional tables (Table 9 and Table 10), and it corrected several typos.
2 This revision removes two appendices, which featured work-in-progress reports completed throughout the project
and slides from presentations delivered to the Library of Congress over the course of the project, in order to manage the scope and size of this final report for distribution and ease of use. The Table of Contents has been updated accordingly. Work-in-progress reports and slides from presentations are now available as stand-alone documents and are available from the Library of Congress and via projectaida.org. This revision also adds a final sentence to the Introduction, directing readers to the Discussion and Recommendations sections, based on their interests. It also corrects section numbers in the body of the document for subsections in 7: Discussion.
S
UMMARY
From July 16-to November 8, 2019, the Aida digital libraries research team at the University of Nebraska-Lincoln collaborated with the Library of Congress on “Digital Libraries, Intelligent Data Analytics, and Augmented Description: A Demonstration Project.“ This demonstration project sought to (1) develop and investigate the viability and feasibility of textual and image-based data analytics approaches to support and facilitate discovery; (2) understand technical tools and requirements for the Library of Congress to improve access and discovery of its digital collections; and (3) enable the Library of Congress to plan for future possibilities. In pursuit of these goals, we focused our work around two areas: extracting and foregrounding visual content from Chronicling America (chroniclingamerica.loc.gov) and applying a series of image processing and machine learning methods to minimally processed manuscript collections featured in By the People (crowd.loc.gov). We undertook a series of explorations and investigated a range of issues and challenges related to machine learning and the Library’s collections.
This final report details the explorations, addresses social and technical challenges with regard to the explorations and that are critical context for the development of machine learning in the cultural heritage sector, and makes several recommendations to the Library of Congress as it plans for future possibilities. We propose two top-level recommendations. First, the Library should focus the weight of its machine learning efforts and energies on social and technical infrastructures for the development of machine learning in cultural heritage organizations, research libraries, and digital libraries. Second, we recommend that the Library invest in continued, ongoing, intentional explorations and investigations of particular machine learning applications to its collections. Both of these top-level recommendations map to the three goals of the Library’s 2019 digital strategy.
Within each top-level recommendation, we offer three more concrete, short- and medium-term recommendations. They include, under social and technical infrastructures: (1) Develop a statement of values or principles that will guide how the Library of Congress pursues the use, application, and development of machine learning for cultural heritage. (2) Create and scope a machine learning roadmap for the Library that looks both internally to the Library of Congress and its needs and goals and externally to the larger cultural heritage and other research communities. (3) Focus efforts on developing ground truth sets and benchmarking data and making these easily available. Nested under the recommendation to support ongoing explorations and investigations, we recommend that the Library: (4) Join the Library of Congress’s emergent efforts in machine learning with its existing expertise and leadership in crowdsourcing. Combine these areas as “informed crowdsourcing” as appropriate. (5) Sponsor challenges for teams to create additional metadata for digital collections in the Library of Congress. As part of these challenges, require teams to engage across a range of social and technical questions and problem areas. (6) Continue to create and support opportunities for researchers to partner in substantive ways with the Library of Congress on machine learning explorations. Each of these recommendations speak to the investigation and challenge areas identified by Thomas Padilla in Responsible Operations: Data Science, Machine Learning, and AI in Libraries.
This demonstration project—via its explorations, discussion, and recommendations—shows the potential of machine learning toward a variety of goals and use cases, and it argues that the technology itself will not be the hardest part of this work. The hardest part will be the myriad challenges to undertaking this work in ways that are socially and culturally responsible, while also upholding responsibility to make the Library of Congress’s materials available in timely and accessible ways. Fortunately, the Library of Congress is in a remarkable position to advance machine learning for cultural heritage organizations, through its size, the diversity of its collections, and its commitment to digital strategy.
T
ABLE OF
C
ONTENTS
Tables, Figures & Charts……… i
1 Introduction……… 1
2 Participants & Roles……… 1
3 Timeline……… 1
4 Code & Data……… 2
5 Demonstration Project Approach & Design……… 2
6 The Explorations……… 3
6.1 Exploration: Document Segmentation……… 5
6.2 Exploration: Graphic Element Classification and Text Extraction………. 9
6.3 Exploration: Document Type Classification…………. 14
6.4 Exploration: Digitization Type Differentiation……… 16
6.5 Exploration: Document Image Quality Assessment (DIQA) and Advanced DIQA……… 19
6.6 Exploration: Document Clustering……… 25
7 Discussion………. 27
7.1 Social……….. 27
7.2 Technical……….. 28
7.3 Social-Technical……….. 30
8 Recommendations……… 30
8.1 Social and Technical Infrastructures………. 31
8.1.1 Develop a statement of values or principles 32 8.1.2 Create and scope a machine learning roadmap………. 32
8.1.3 Focus efforts on developing ground truth……….. 33
8.2 Explorations and Investigations……… 34
8.2.1 Join efforts……… 35
8.2.2 Sponsor challenges………. 35
8.2.3 Continue to support research partnerships. 36 9 Conclusion……… 39
T
ABLES
,
F
IGURES
&
C
HARTS
TABLES
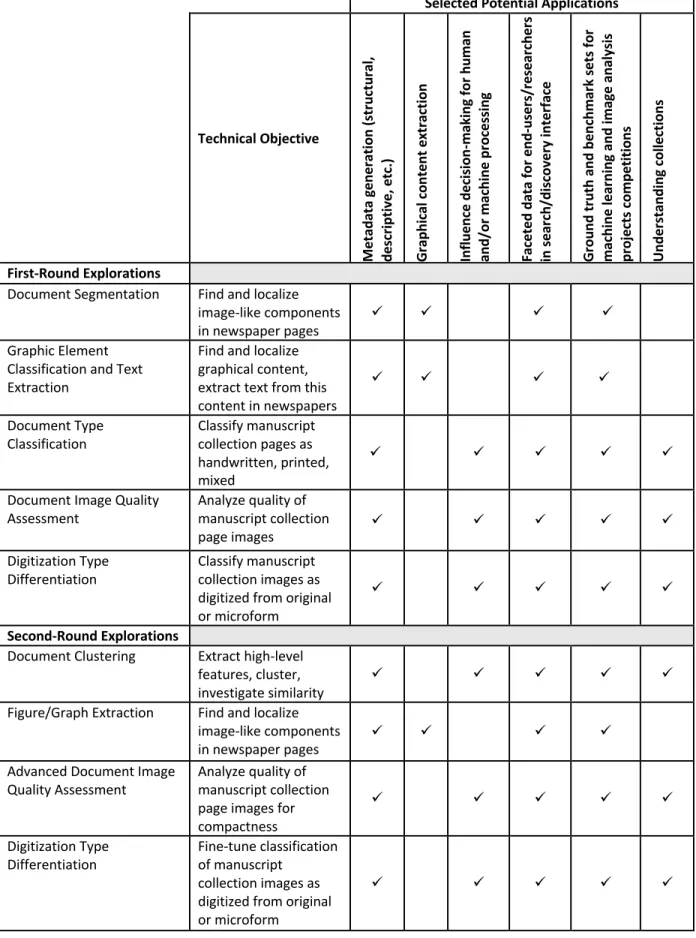
Table 1. The explorations pursued as part of the demonstration project and their selected potential
applications. ……… 4 Table 2. Results of page segmentation when training and
evaluating the dhSegment model on two sets of
historical newspapers. ……… 6 Table 3. Average performance of pre-training investigation
and fine-tuning approaches. ………. 12 Table 4. Precision, recall, and f1-score of VGG-16 as trained
on RVL_CDIP dataset. ………. 14 Table 5. Configuration of suffrage_1002 dataset.………... 15 Table 6. Precision, recall, and f1-scores of VGG-16 on
suffrage_1002 testing set. ……….. 15 Table 7. Breakdown of projects and actual classifications of
content as digitized from microform or digitized from an original item. ………. 17 Table 8. Comparison of accuracy of compactness of two
algorithms. ………. 24 Table 9. Infrastructure and application recommendations
mapped to elements of the Library of Congress's digital strategy. ………. 37 Table 10. Recommendations Mapped to areas of
investigation and challenge areas outlined in Padilla's Responsible Operations. ……… 38
FIGURES
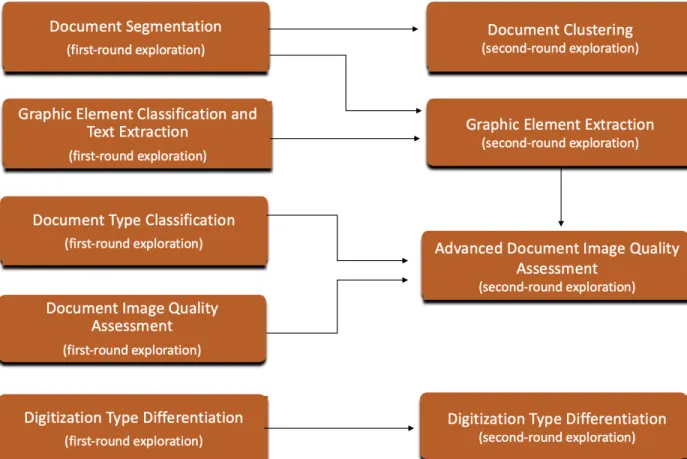
Figure 1. Visual representation of the explorations and
their relationships to one another. ……… 3 Figure 2. Segmentation result of ENP_500_v4 on a
Chronicling America image (sn92053240-19190805.jpg). . 6 Figure 3. Segmentation result of ENP_500_v4 on a
Chronicling America image
(sn84026820_00271765095_1917050501_0153.jpg). …… 7 Figure 4. Segmentation result of ENP_500_v4 on a
Chronicling America image
(sn82014086_00295866135_1917091301_0116.jpg). …… 8 Figure 5. Segmentation result of ENP_500_v4 on Chronicling
America image (sn86063952-19190805.jpg). ………. 9 Figure 6. The Beyond Words data, which we treated as
Figure 7. Each of the three columns with graphical content have much larger ...………. 13 Figure 8. In this case, the “Buy Liberty Bonds” advertisement
is not represented in the ground truth ...………. 13 Figure 9. Prediction failure cases. ………. 15 Figure 10. Facing pages of a document, digitized from the
original ...……… 17 Figure 11. A handwritten manuscript page image, digitized
from the original ...………. 18 Figure 12. A digital image of a coin, digitized from the
original item ...……… 18 Figure 13. A digital image of a photograph, digitized from
the original item ...……….. 19 Figure 14. An image with a low-contrast score from the Civil
War years. ………. 22 Figure 15. Images from three different clusters. ……… 26 Figure 16. Images from three different clusters following
intensity value normalization. ……… 27
CHARTS
Chart 1. Skewness measures of 35,900 images from
minimally processed Civil War collections. ……….. 20 Chart 2. Average contrast scores of materials within
decade-ranges. ………. 21 Chart 3. Average contrast scores of materials from the
decade 1860-1869 by year. ………. 21 Chart 4. Average range effect of the Civil War collection
over time. ………. 22 Chart 5. Average bleed-through/noise in materials from the
Civil War collection, by decade. ………. 23 Chart 6. The compactness of the Europeana Newspapers
1
I
NTRODUCTION
In response to notice ID 030ADV19Q0274, “The Library of Congress – Pre-processing Pilot,” the Aida digital libraries research team at the University of Nebraska-Lincoln (UNL) proposed “Digital Libraries, Intelligent Data Analytics, and Augmented Description: A Demonstration Project.” The proposal was awarded a research services contract from the Library of Congress. From July 16-to November 8, 2019, members of the Aida research team conducted a series of explorations and analyses to assist the Library of Congress in assessing possible applications of machine learning within the Library. Three broad goals framed this work: (1) develop and investigate the viability and feasibility of textual and image-based data analytics approaches to support and facilitate discovery; (2) understand technical tools and requirements for the Library of Congress to improve access and discovery of its digital collections; and (3) enable the Library of Congress to plan for future possibilities.
This report summarizes the design of the demonstration project and the activities of the Aida research team; presents key findings resulting from these activities; makes recommendations for possible paths forward; and provides documentation for the major activities, including code, data, and reports-in-progress completed during the project. This report serves two main purposes: to document the work completed and to extrapolate from that work to broader implications for machine learning endeavors at the Library of Congress. Readers most interested in the larger social and technical implications of this work may wish to skip to Section 7: Discussion and Section 8: Recommendations.
2
P
ARTICIPANTS
&
R
OLES
UNIVERSITY OF NEBRASKA-LINCOLN
§ Elizabeth Lorang, senior adviser
§ Leen-Kiat Soh, senior adviser
§ Yi Liu, research associate and developer
§ Chulwoo (Mike) Pack, research associate and developer
§ Ashlyn Stewart, research assistant
LIBRARY OF CONGRESS
ठMeghan Ferriter, Chief (Acting) LC Labs/Senior Innovation Specialist
§ Abbey Potter, Senior Innovation Specialist
§ Jaime Mears, Senior Innovation Specialist
§ Eileen Jakeway, Innovation Specialist
§ Tong Wang, Senior IT Specialist, OCIO
§ Lauren Algee, Senior Innovation Specialist
§ Victoria Van Hyning, Senior Innovation Specialist
3
T
IMELINE
JULY 16,2019
Project kick-off meeting held at the Library of Congress
‡ In addition to these key contributors, many others at the Library of Congress supported this demonstration project
in a variety of ways, including through their hospitality, encouragement, brainstorming, and interest in this project. We are grateful for and indebted to their efforts.
JULY 19-AUGUST 23,2019
First-round of iterative development, onsite at the Library of Congress
AUGUST 26-NOVEMBER 8,2019
Second round of iterative development, offsite at the University of Nebraska-Lincoln
NOVEMBER 6,2019
Delivery of preliminary results via virtual meeting
NOVEMBER 7–JANUARY 9
Development of open repository of code, data, and documentation; development of final report
JANUARY 10,2020
Delivery of final results via in-person meeting at Library of Congress
4
C
ODE
&
D
ATA
Code and descriptions of data are available via the Library of Congress’s GitHub organization page at the “Exploring ML with Project Aida” repository, https://github.com/LibraryOfCongress/Exploring-ML-with-Project-Aida. Following submission to the Library of Congress, code, data, and this report will also be available via projectaida.org.
5
D
EMONSTRATION
P
ROJECT
D
ESIGN
&
A
PPROACH
With the size of the Library of Congress’s digital collections and the many potential areas of impact, we might have pursued any number of questions in this demonstration project. Scoping our work, both with regard to the questions we pursued and the number and type of explorations, was critical. We anchored our work around two areas: (1) extracting and foregrounding visual content from Chronicling America (chroniclingamerica.loc.gov) through a variety of techniques and approaches and (2) applying a series of image processing and machine learning methods and techniques to minimally processed manuscript collections featured in By the People (crowd.loc.gov). We identified these areas of focus because they drew on collections already deemed significant by the Library of Congress and because they had a degree of ground-truthing work already completed. In addition, they offered the opportunity to explore the advantages and disadvantages and the strengths and weaknesses of
computational/machine learning approaches as compared to data and information generated by experts, casual users, and researchers. Working with these collections had the further benefit of significant opportunity to create new, rich, and varied metadata about them, so that the Library might explore the ways in which more robust metadata might allow for alternative points of entry into the materials and the opportunity for Library staff and researchers to pursue questions of varying nature.
Ultimately, we designed a series of explorations that allowed us to investigate a range of issues and challenges related to machine learning and the Library’s collections. The explorations were developed through an iterative process and in regular consultation with members of the Library of Congress staff, both to learn from their
expertise and to make sure the questions we were pursuing were of value and interest to the Library. Through that process, some explorations merged, others concluded more quickly than others, and areas of inquiry seeded in one exploration began to sprout in others as well. Individually, the explorations pursued particular technical and collections-oriented questions. We also used the explorations as points of entry into—and paths to reflection about—larger issues, questions, and challenges for machine learning and cultural heritage.
6
T
HE
E
XPLORATIONS
This section presents an overview and details of six explorations: Document Segmentation; Graphic Element Classification and Text Extraction; Document Type Classification; Digitization Type Differentiation; Document Image Quality Assessment and Advanced Document Image Quality Assessment; and Document Clustering. Figure 1 and Table 1 identify and show relationships among the explorations and summarize them. In our look at each exploration, we identify guiding questions; outline and describe our approaches, techniques, and methods; present high-level results and analysis; and offer ideas toward future development and/or potential applications.
TABLE 1. THE EXPLORATIONS PURSUED AS PART OF THE DEMONSTRATION PROJECT AND THEIR SELECTED POTENTIAL APPLICATIONS.
Selected Potential Applications
Technical Objective Me ta da ta g en er at io n (s tr uc tu ra l, de sc ript iv e, e tc .) Gr aphi ca l c ont ent e xt ra ct ion In flu en ce d ecis io n-ma ki ng fo r h uma n and/ or m ac hi ne pr oc es si ng Fa cet ed d at a fo r en d-us er s/ re se ar che rs in s ea rc h/ dis co ve ry in te rfa ce Gr ound tr uth a nd be nc hm ar k se ts for ma ch in e le ar ni ng a nd ima ge a na ly si s pr oj ec ts c om pe tit ions Un de rs ta nd in g co lle ct io ns First-Round Explorations
Document Segmentation Find and localize image-like components
in newspaper pages ü ü ü ü
Graphic Element Classification and Text Extraction
Find and localize graphical content, extract text from this content in newspapers
ü ü ü ü
Document Type
Classification Classify manuscript collection pages as handwritten, printed, mixed
ü ü ü ü ü
Document Image Quality
Assessment Analyze quality of manuscript collection
page images ü ü ü ü ü
Digitization Type Differentiation
Classify manuscript collection images as digitized from original or microform
ü ü ü ü ü
Second-Round Explorations
Document Clustering Extract high-level features, cluster, investigate similarity
ü ü ü ü ü
Figure/Graph Extraction Find and localize image-like components
in newspaper pages ü ü ü ü
Advanced Document Image
Quality Assessment Analyze quality of manuscript collection page images for compactness
ü ü ü ü ü
Digitization Type
Differentiation Fine-tune classification of manuscript collection images as digitized from original or microform
6.1
EXPLORATION: DOCUMENT SEGMENTATION
The goal of this exploration was to see if we could localize textual zones, figures, layout borders, and tables and then identify image-like components in historic newspaper pages. Currently, newspaper page images presented through Chronicling America are not zoned or segmented below the page level. In addition, content within a newspaper page is not identified or classified by genre, type, or other features. This exploration, then, was guided by the questions: how might we use image zoning and segmentation to generate additional information about newspaper pages in the Chronicling America corpus? Could image zoning and segmentation be used to pull out graphical content from Chronicling America newspapers? How might machine learning projects draw on ground truth or benchmark data already generated through crowdsourcing efforts?
This exploration applied the dhSegment tool for historical document image processing to historical newspapers.4
ResNet, a feature extractor in dhSegment, is capable of encoding an image down to a set of high-level visual features effectively and efficiently. We applied dhSegment to two sets of newspaper images, one set from the Library of Congress’s Beyond Words project (http://beyondwords.labs.loc.gov/#/), which is based on Chronicling America newspapers, and one from the Europeana Newspapers Project (https://www.primaresearch.org/datasets/ENP). In the Beyond Words project, members of the public drew rectangular zones around illustrations, photographs, comics, and cartoons in World War I-era newspapers, and users also transcribed captions for this content. In a subsequent stage of work, users could apply a typology to the graphical content, choosing among editorial cartoon, comics/cartoon, illustration, photograph, or map. Our expectation was that Beyond Words would provide ground truth data against which we might verify machine learning-based approaches to the same challenges (graphical content zoning).
We obtained a subset of 1,532 newspaper page images from Beyond Words and corresponding data for graphical-content zones. We used 1,226 images for training and 306 images for evaluation. In two different test scenarios (BW_1500_v1 and BW_1500_v2), when trained and evaluated on Beyond Words newspaper pages, we achieved best accuracy scores of 87% and 88%. Table 2 outlines results. Unfortunately, the relatively high accuracy scores are misleading upon further examination, since the model’s behavior of predicting most pixels to be background pixels is guaranteed to achieve high accuracy. The low values for the best mean intersection over union (mIoU) scores verify this problematic behavior in the model, as we observe only a 26% and 24% overlap between the target class and the model’s prediction.
For further exploration of the approach, we also trained and evaluated the model on a set of 481 pages from the Europeana Newspapers corpus. These newspaper page images are already zoned and segmented, with the segments classed as background, text, figure, separator or table. These classes are different from the classes in the Beyond Words dataset, which were all classes of graphical content or background. When we trained and evaluated the model on the Europeana Newspapers, we were verifying against the respective classes of the set.
In deploying on the Europeana Newspapers dataset in four scenarios (ENP_500_v1, ENP_500_v2, ENP_500_v3, ENP_500_v4), we achieved best accuracy scores of 88%, 89%, 91%, and 91%, and best mIoU scores of 64%, 64%, 69%, and 69%. In these scenarios, text regions are included in the ground-truth, and thus the model’s simple guessing that everything is background is penalized. The high accuracy scores are more trustworthy in these scenarios, as further corroborated by the higher scores for mIoU.
TABLE 2. RESULTS OF PAGE SEGMENTATION WHEN TRAINING AND EVALUATING THE DHSEGMENT MODEL ON TWO SETS OF HISTORICAL NEWSPAPERS, A ROUGHLY 1500-PAGE SET FROM BEYOND WORDS/CHRONICLING AMERICA AND AN APPROXIMATELY 500-PAGE SET FROM THE EUROPEANA NEWSPAPERS COLLECTION.
Model Train/Eval Size Classes Weighted Training Pre-processing (Normalization) Best Score Accuracy mIoU BW_1500_v1 1226/306 0: Background 1: Editorial cartoon 2: Comics/cartoon 3: Illustration 4: Photograph 5: Map No No 0.87 0.24 BW_1500_v2 Yes [10; 22; 20; 18; 8; 22] 0.88 0.26 ENP_500_v1 385/96 0: Background 1: Text 2: Figure 3: Separator 4: Table Yes [5; 10; 40; 10; 35] No 0.88 0.64 ENP_500_v2 Yes 0.89 0.64 ENP_500_v3 No No 0.91 0.69 ENP_500_v4 Yes 0.91 0.69
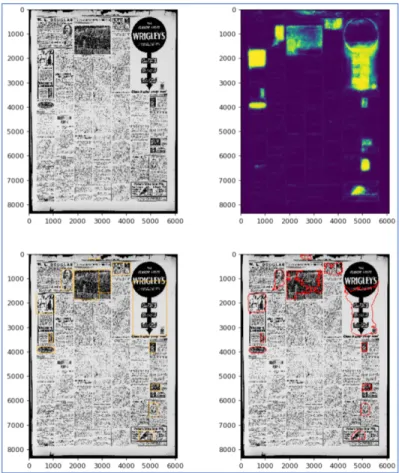
We did not conduct a broad deployment of the Europeana Newspapers model on Beyond Words/Chronicling America pages, because we did not have verifiable, commensurate ground truth across the sets. We did, however, conduct a limited test of the Europeana Newspapers-trained model (specifically ENP_500_v3) on Chronicling America page images, and the visual results are encouraging. See Figure 2, Figure 3, Figure 4, and Figure 5 for true-positive correlations, according to visual inspection, as well as for examples of false-true-positives and false-negatives, respectively.
FIGURE 2. SEGMENTATION RESULT OF ENP_500_V4 ON A CHRONICLING AMERICA IMAGE (SN92053240-19190805.JPG). CLOCKWISE FROM TOP- LEFT: (1) INPUT, (2) PROBABILITY MAP FOR FIGURE CLASS, (3) DETECTED FIGURES IN POLYGON, AND (4) DETECTED FIGURES IN BOUNDING-BOX. IN THE PROBABILITY MAP, PIXELS WITH A HIGHER PROBABILITY OF BELONGING TO THE FIGURE CLASS ARE SHOWN WITH A BRIGHTER COLOR.
FIGURE 3. SEGMENTATION RESULT OF ENP_500_V4 ON A CHRONICLING AMERICA IMAGE
(SN84026820_00271765095_1917050501_0153.JPG). CLOCKWISE FROM TOP-LEFT: (1) INPUT, (2) PROBABILITY MAP FOR FIGURE CLASS, (3) DETECTED FIGURES IN POLYGON, AND (4) DETECTED FIGURES IN BOUNDING-BOX. IN THE PROBABILITY MAP, PIXELS WITH A HIGHER PROBABILITY OF BELONGING TO THE FIGURE CLASS ARE SHOWN WITH A BRIGHTER COLOR.
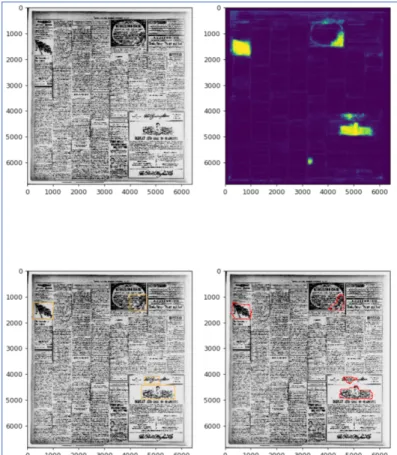
FIGURE 4. SEGMENTATION RESULT OF ENP_500_V4 ON A CHRONICLING AMERICA IMAGE
(SN82014086_00295866135_1917091301_0116.JPG). CLOCKWISE FROM TOP-LEFT: (1) INPUT, (2) PROBABILITY MAP FOR FIGURE CLASS, (3) DETECTED FIGURES IN POLYGON, AND (4) DETECTED FIGURES IN BOUNDING-BOX. IN THE PROBABILITY MAP, PIXELS WITH A HIGHER PROBABILITY OF BELONGING TO THE FIGURE CLASS ARE SHOWN WITH A BRIGHTER COLOR.
FIGURE 5. SEGMENTATION RESULT OF ENP_500_V4 ON CHRONICLING AMERICA IMAGE (SN86063952-19190805.JPG). CLOCKWISE FROM TOP- LEFT: (1) INPUT, (2) PROBABILITY MAP FOR FIGURE CLASS, (3) DETECTED FIGURES IN POLYGON, AND (4) DETECTED FIGURES IN BOUNDING-BOX. IN THE PROBABILITY MAP, PIXELS WITH A HIGHER PROBABILITY OF BELONGING TO THE FIGURE CLASS ARE SHOWN WITH A BRIGHTER COLOR.
6.2
EXPLORATION: GRAPHIC ELEMENT CLASSIFICATION AND TEXT EXTRACTION
This exploration was similar to the document segmentation exploration and became closer in goal and scope to that exploration over its iterations. Initially, the goal of this exploration was to find and localize figures, illustrations, and cartoons present in historical newspaper page images; classify the graphical content; and extract any text from the graphical content in order to generate a transcription of the textual content. By its second iteration, this exploration focused on fine-tuning the identification of graphical content in historic newspaper page images and the distinction of graphical content regions from textual content regions. The questions that guided this exploration throughout its development included: how might we use image zoning and segmentation, and text extraction from graphical regions, to generate additional information about newspaper pages in the Chronicling America corpus? Could image zoning and segmentation be used to pull out graphical content from Chronicling America newspapers? What benefits do different types or approaches to zoning and segmentation have for various information tasks? What strategies might be necessary to deal with rare content types in the training and evaluation of machine learning systems? This exploration proceeded in two phases. The first phase established a conceptual model and workflow for a two-stepped approach that would result in segmented and classified graphical regions from historic newspaper pages and the segmentation and recognition of textual content in the graphical regions. Conceptually, our approach was
based on dhSegment, but instead of combining U-Net5 and ResNet-506 as we did in the document segmentation
exploration, we used the ResNeXt7 classification model, a next-generation model from the ResNet that was
employed in dhSegment. Such network combination belongs to the family of fully convolutional neural networks (FCN). We call our FCN that uses ResNeXt “U-NeXt.” The goal was to see whether we could further enhance the results obtained with dhSegment by using this newer method. The model training was based on the pre-trained ResNeXt model for ImageNet. Finally, in the conceptual workflow, we planned to use EAST8 text detection to find
textual regions in the graphical images and use an optical character recognition process to recognize the textual strings within the graphical zones.
Our goal was to apply this conceptual model to newspaper page images from the Beyond Words project. In the above document segmentation exploration, the mIoU score was only 24%-26% on the Beyond Words dataset. We considered possible reasons that for the low mIoU scores. One possibility was that the feature extractor, ResNet, was not powerful enough to extract high-level features from the dataset for identification and classification. Notably, the ResNet model was reported by He et al. in 2015. However, in 2017, they reported a second-generation, ResNeXt, which beat the previous record on an ImageNet challenge.9 Another possibility was that the rareness of some types
of regions, such as maps, which comprise 1% of the regions, might skew the training process. As a result, we decided to test the ResNeXt model.
In addition, the data from Beyond Words were not sufficiently reliable for training purposes for this exploration.10
One challenge with the data is that it does not include graphical content in advertisements; our model does not distinguish between graphical content in advertisements and graphical content in other types of content zones— graphical content is graphical content, at the stage of graphical content recognition and segmenting. In addition, not all graphical content has necessarily been marked on a page in the Beyond Words dataset. Since machine learning models will try to find all graphical content within the input page, such missing graphical regions can confuse the model during the training process. Another challenge, which we explore more fully below, is that ground-truth regions are not necessarily tightly mapped to the actual shape of the graphical region.
In its second phase of development, then, this exploration become a refinement of the original document segmentation exploration. We deconstructed the conceptual model described above and focused only on implementing the U-NeXt fully convolutional neural network for the purposes of graphical content extraction and classification. Our goal in doing so was to see if we could further improve upon the results reported by the dhSegment authors and the results we achieved in our document segmentation exploration that implemented dhSegment.
In the second phase of this exploration, we first conducted a pre-training investigation, which involved training and testing on the Europeana Newspapers dataset, since it is more comprehensively labeled than the Beyond Words
5 Ronneberger, Fischer, and Brox, “U-Net.”
6 He et al., “Deep Residual Learning for Image Recognition.”
7 Xie et al., “Aggregated Residual Transformations for Deep Neural Networks.” Compared to ResNet, ResNeXt uses
grouped convolution (i.e. side-by-side convolution layers) in each residual block. The usage of grouped convolution was first mentioned in AlexNet. See Krizhevsky, Sutskever, and Hinton, “ImageNet Classification with Deep
Convolutional Neural Networks.”
8 Zhou et al., “EAST.”
9 Russakovsky et al., “ImageNet Large Scale Visual Recognition Challenge.”
10 For more on Beyond Words, see the Library of Congress Labs’ Experiments page,
https://labs.loc.gov/experiments/?st=gallery Note as well that Beyond Words was not implemented with the purpose of creating training data or being used as training data.
data for our purposes. This pre-training investigation reached 91.30% pixel-wise accuracy and 57.19% for mIoU, with a testing performance of 81.90% pixel-wise accuracy and 48.18% mIoU. Note that the investigation did not reach the score of dhSegment on the ENP dataset in the document segmentation exploration. However, considering the ENP dataset and the Beyond Word dataset only share partial features, so it is not necessary to train the investigation to its best state. In fact, the observed convergence indicated the parameters were getting trained to fit the task and the model was ready for fine-tuning.
Then, we conducted a series of fine-tuning investigations, which involved four different approaches:
1. The first approach trained and tested U-NeXT on the Beyond Words dataset without using the Europeana Newspapers-trained classifier. This approach was meant to serve as a baseline design. We observed convergence in both training and testing curves, but the testing curve showed instability with rapid high and low variation during the investigation. Statistics showed that the classifier failed to recognize classes of editorial cartoons, illustrations, and maps. These three classes were the three rarest classes in the ground truth set, and the misrecognition issue is likely caused by the rareness of corresponding classes.
2. The second approach used the Europeana Newspapers-trained classifier as the beginning classifier. We then trained and tested it on the Beyond Words dataset. We added this design because using a pre-trained classifier for a similar task could help the overall fine-tuning investigations address challenges with reliable ground truth when working only with the Beyond Words dataset. Though performance indicators appeared promising, upon further investigation, the classifier trained during the fine-tuning experiment attempted to classify many pixels as background pixels after training convergence. Therefore, while the performance statistics are better than the first fine-tuning experiment numerically, the actual performance is worse, since none of the object classes (specific types of graphical content) were recognized.
3. The third approach replaced a deconvolutional layer with a resizing layer in the deep learning model. For this approach, we trained and tested on the Beyond Words dataset. This approach is designed to address a problem with the deconvolutional layer11; the resizing layer is perceived as an improvement on the overall
technique. The pixel-wise testing accuracy is higher than in fine-tuning approach #1, but the mIoU is lower than in that fine-tuning approach. As with fine-tuning approach #2, we also found that pixel-wise accuracy and mIoU of the editorial cartoon, illustration, and map classes are zeros. However, the testing curve did not show the same instability as in fine-tuning approach #1. This result suggests that the resizing layer helped to address the challenge with the deconvolutional layer, so it is more stable than fine-tuning approach #1, though less accurate overall.
4. The fourth approach performed a two-class segmentation and classification, instead of six-class processes on the Beyond Words dataset for both training and testing. We reduced the number of classes to two because the training dataset is biased where there is a predominantly large number of background pixels compared to other classes of pixels.12 Pixels in non-background classes comprise only 11.79% of the entire
training dataset in total. By collapsing all the object pixels into one class, we can reduce the imbalance in the number of pixels in each class during training. The results indicate that training a classifier to learn information from rare classes is very hard. Combining five non-background classes into one class decreases the complexity of the task. The combined class segmentation outperformed the other fine-tuning experiments.
11 Odena, Dumoulin, and Olah, “Deconvolution and Checkerboard Artifacts.”
12 There are 88.21% pixels in background class, but for the rest of classes, only 0.71% in editorial cartoon class, 2.89%
Approaches two through four are variants of the first approach. See Table 3 for a summary of results for the pre-training investigation and the four fine-tuning investigations.
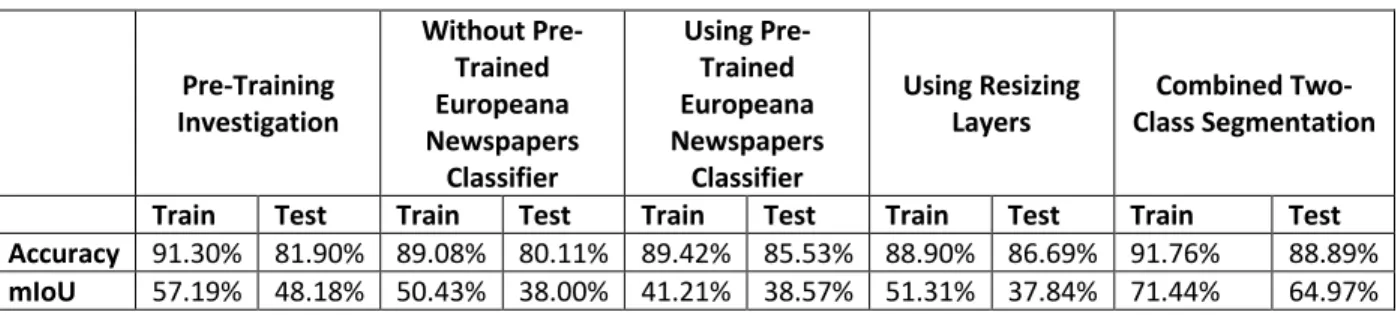
TABLE 3. AVERAGE PERFORMANCE OF PRE-TRAINING INVESTIGATION AND FINE-TUNING APPROACHES.
Pre-Training Investigation Without Pre-Trained Europeana Newspapers Classifier Using Pre-Trained Europeana Newspapers Classifier Using Resizing
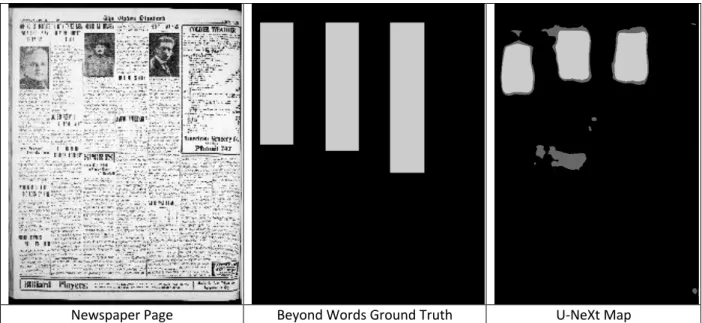
Layers Class Segmentation Combined Two-Train Test Train Test Train Test Train Test Train Test Accuracy 91.30% 81.90% 89.08% 80.11% 89.42% 85.53% 88.90% 86.69% 91.76% 88.89% mIoU 57.19% 48.18% 50.43% 38.00% 41.21% 38.57% 51.31% 37.84% 71.44% 64.97% From these investigations, we conclude that U-NeXt—especially the combined two-class segmentation—is promising for segmentation and zoning. At the same time, the fine-tuning approaches offered evidence that the Beyond Words dataset was not sufficient ground truth for our purposes. We found two issues. First, non-identified or incompletely identified graphical images in the Beyond Words dataset appear to be widespread to an extent that is problematic for training. For example, as shown in Figure 6, a large portion of a photograph in the document is missing from the ground truth but is captured by our U-NeXt classifier. Second, the rectangular regions do not necessarily match to the actual graphical content. For instance, as shown in Figure 7, the ground truth region includes a large portion of the textual content.
Newspaper Page Beyond Words Ground Truth U-NeXt Map
FIGURE 6. THE BEYOND WORDS DATA, WHICH WE TREATED AS GROUND TRUTH, IS MISSING MUCH OF THE GRAPHICAL CONTENT ON THE PAGE, WHILE THE U-NEXT MAP APPEARS MORE REPRESENTATIVE OF THE ORIGINAL PAGE.
Newspaper Page Beyond Words Ground Truth U-NeXt Map
FIGURE 7. EACH OF THE THREE COLUMNS WITH GRAPHICAL CONTENT HAVE MUCH LARGER BOUNDING BOXES IN THE GROUND TRUTH THAN WHAT CORRESPONDS TO THE ACTUAL GRAPHICAL CONTENT. THE U-NEXT MAP APPEARS MORE REPRESENTATIVE OF THE ORIGINAL.
These challenges with the Beyond Words dataset as ground truth for this exploration also lead us to believe that our classifier may be more accurate than the current statistical results would suggest. The U-NeXt model tries to fit the exact shape of the figure and graph region. Figure 8 shows, for example, that the model tried to fit the exact shape of the eagle on the right-hand side of the newspaper page. Since the ground truth included rectangular bounding boxes, we are not comparing like to like in our pixel-wise and mIoU comparisons.
Newspaper Page Beyond Words Ground Truth U-NeXt Map
FIGURE 8. IN THIS CASE, THE “BUY LIBERTY BONDS” ADVERTISEMENT IS NOT REPRESENTED IN THE GROUND TRUTH, LIKELY BECAUSE IT IS AN ADVERTISEMENT AND THEREFORE OUT OF SCOPE FOR THE BEYOND WORDS PROJECT. THE U-NEXT MAP, HOWEVER, RECOGNIZES THE GRAPHICAL CONTENT AND CLOSELY FITS TO IT.
6.3
EXPLORATION: DOCUMENT TYPE CLASSIFICATION
This exploration pursued whether we could effectively distinguish among handwritten, printed, and mixed (both handwritten and printed) documents within a collection of minimally processed manuscript materials at the Library of Congress. This exploration was guided by the questions: what features might be useful for influencing processing pipelines, for generating additional metadata, or for distinguishing among materials? How viable might large-scale indexing of documents be, for certain types of criteria? To what level of performance could we meta-tag document images? Would a deep learning model that had shown remarkable performance for natural scene images also show promising performance for document images? Or, to be more precise, would a feature extractor trained with millions of natural scene images also capably extract useful features for document images?
This exploration drew on current state-of-the-art methods in natural image and document classification. In particular, we extended the use of convolutional neural networks for classifying natural images to the task of classifying document images. Based on the findings of Harley et al. and Afzal et al., we used the VGG method with 16 categories (VGG-16) pre-trained on the Ryerson Vision Lab Complex Document Information Processing (RVL_CDIP) dataset.13 The RVL_CDIP dataset, which is publicly available, consists of 400,000 document images that
are divided into 16 evenly distributed classes. The dataset is provided in three different sets: training, validation, and test set. The training set contains 320,000 images of 16 different evenly distributed classes (i.e., about 20,000 images per class). Both validation and test sets together contain 40,000 images of 16 different evenly distributed classes (2,500 images per class).
We first set out to reproduce the results reported in the work of Harley et al. and assessed classification performances of VGG-16, pre-trained on ImageNet, and trained and tested with RVL_CDIP dataset. The advantage of doing so is that once we created a model trained on this large-scale document image dataset, we can reuse the rich features that this model has learned for many document analysis tasks, such as for our current ask of document type classification. The entire training process took only three epochs to converge with promising classification results. This indicates that features obtained from natural scene images (i.e., ImageNet) are general enough to be applied to documents. The resultant classification performance metrics—precision, recall, and f1-score—are shown in Table 4. On average, each metric shows around 87%, which aligns well with the result reported by Harley et al.
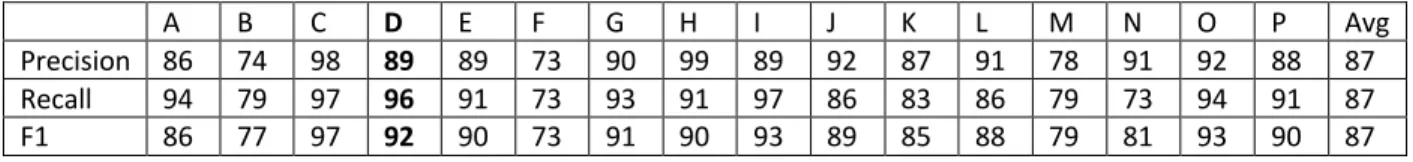
TABLE 4. PRECISION, RECALL, AND F1-SCORE OF VGG-16 AS TRAINED ON RVL_CDIP DATASET. THE ALPHABETIC LABELS CORRESPOND TO THE FOLLOWING LABELS: LETTER, FORM, EMAIL, HANDWRITTEN, ADVERTISEMENT, SCIENTIFIC REPORT, SCIENTIFIC PUBLICATION, SPECIFICATION, FILE FOLDER, NEWS ARTICLE, BUDGET, INVOICE, PRESENTATION, QUESTIONNAIRE, RESUME, AND MEMO. OUR CLASS OF INTEREST, HANDWRITTEN, IS BOLDED.
A B C D E F G H I J K L M N O P Avg
Precision 86 74 98 89 89 73 90 99 89 92 87 91 78 91 92 88 87
Recall 94 79 97 96 91 73 93 91 97 86 83 86 79 73 94 91 87
F1 86 77 97 92 90 73 91 90 93 89 85 88 79 81 93 90 87
Next, we generated our own model for the specific task of classifying documents in one of three types, handwritten, typed/typeset, or mixed (both handwritten and typed/typeset). For this task, we retrained the model obtained from
13 Harley, Ufkes, and Derpanis, “Evaluation of Deep Convolutional Nets for Document Image Classification and
Retrieval”; Afzal et al., “Cutting the Error by Half”; Simonyan and Zisserman, “Very Deep Convolutional Networks for Large-Scale Image Recognition.”
the above with a dataset derived from the Suffrage: Women Fight for the Vote campaign from By the People. The dataset for this exploration is hereafter referred to as suffrage_1002.
The suffrage_1002 dataset had 1,002 manually classified images and was balanced across handwritten, typed/typeset, and mixed. This ground truth set was created by members of the project team. The entire dataset was split into three sets—training, validation, and test—with a ratio of 8:1:1. In order to keep the class balanced during this split, we dropped three datapoints, one of each class. The final size of the dataset was therefore 999 images. See Table 5 for the breakdown by sets and class.
TABLE 5. CONFIGURATION OF SUFFRAGE_1002 DATASET.
Handwritten Typed/Typescript Mixed Total
Train 267 267 267 801
Validation 33 33 33 99
Test 33 33 33 99
Total 333 333 333 999
We use the same VGG-16 architecture as above, but the output tensor was adjusted to have a shape of 3, the number of classes specified in suffrage_1002. Overall, our model’s classification performance on the testing set shows about 90% for precision, recall, and f1-score, as shown in Table 6. We believe that these scores, which are a bit lower than those reported above in our attempts to reproduce Harley et al., are due to challenging characteristics of mixed type document images; for example, mixed materials may have negligible or statistically challenging amounts of handwriting in typeddocument and vice versa. See Figure 9 for examples.
TABLE 6. PRECISION, RECALL, AND F1-SCORES OF VGG-16 ON SUFFRAGE_1002 TESTING SET.
Handwritten Typed/Typescript Mixed Avg
Precision 89 91 90 90
Recall 97 94 79 90
F1 93 93 84 90
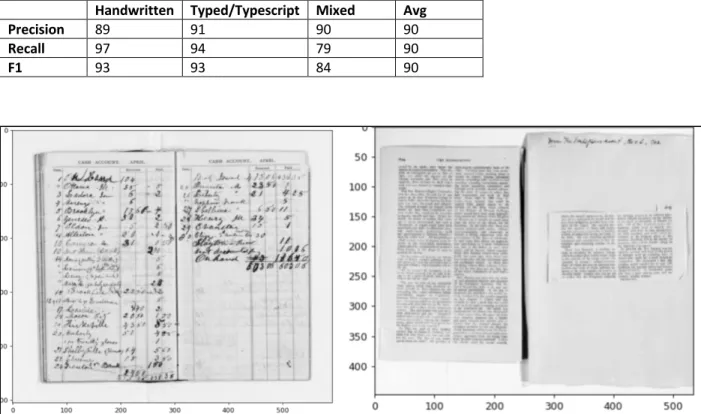
FIGURE 9. PREDICTION FAILURE CASES. IN THE LEFT EXAMPLE, THE MODEL CLASSIFIED THE DOCUMENT AS HANDWRITTEN RATHER THAN MIXED. NOTE THAT THE PRINTED REGIONS ARE VERY SMALL COMPARED TO THE HANDWRITTEN CONTENT IN THE IMAGE. IN THE RIGHT
EXAMPLE, THE MODEL CLASSIFIED THE DOCUMENT AS PRINTED RATHER THAN MIXED. HERE, THE HANDWRITTEN REGION IS VERY SMALL COMPARED TO THE PRINTED REGION IN THE IMAGE.
In the case of the examples in Figure 9, both images have technically been classified incorrectly, according to our current model and set of definitions. Both images depict documents that feature printed and handwritten content, and therefore both technically fit the definition of mixed. However, this example provides an opportunity to consider whether the actual mixed nature of these materials matters for processing purposes. If the Library of Congress were interested in this question for the benefit of helping to make decisions about how to handle particular types of materials—for example, that materials with significant handwritten content get passed to human experts, whether within the Library or outside of it—then materials with some, but limited print content are usefully grouped with handwritten materials. Likewise, if there was a strong mix of content types, that might also signal materials for human processing, whereas in the example of materials with minimal handwritten content, it may be fine to pass those materials off to more automated processes.
6.4
EXPLORATION: DIGITIZATION TYPE DIFFERENTIATION
The purpose of this exploration was to distinguish among digital images created through digitization from different source types. In particular, we sought to distinguish between items digitized from an original document item and those digitized from a microform reproduction of an original item. We expected that digitization source should be a relatively easy feature to distinguish and could have a variety of potential use cases for both internal processes and decision-making at the Library and for end users and researchers. A variety of questions sat behind this exploration. As with the document classification exploration, we wondered: what features might be useful for influencing processing pipelines, for generating additional metadata, or for distinguishing among materials? How viable might large-scale indexing of documents be, for certain types of criteria? To what level of performance could we meta-tag document images? We also wondered who might benefit from the ability to facet or search according to this particular criterion—digitization source—and how that might information might be made available.
This exploration proceeded in two phases. In both, we used ResNeXt, a deep learning method, to differentiate among images digitized from an original and those digitized from a microform reproduction. All images for this exploration came from the minimally processed manuscript collections included in the By the People Civil War campaign. We first retrieved 36,103 images from the minimally processed Civil War materials and manually inspected 10,508 images, or slightly less than 30% of the total images. We determined digitization source ground truth for each of these 10,508 images. We then sampled a subset of 1,200 images from the 10,508 in a balanced set (600 images of each type, digitized from original and digitized from microform). In a 10% test of 120 sample images, the classifier was 100% accurate in classifying images as digitized from an original item or from a microform. We had concern, however, that this 100% accuracy was likely too good to be true when deployed over a larger set of images. We therefore proposed to compare the ratio of items digitized from microform to items digitized from original items to more comprehensively evaluate our approach. Based on the ground truth classification of the 10,508 images, we would expect a 1:16 ratio of images digitized from microform to images digitized from original items across the Civil War dataset.
In the second phase of this exploration, we fine-tuned the classifier, classified 36,103 images retrieved from the Civil War manuscript collections, and compared the number and ratio of expected classification to real classifications. In fine-tuning the classifier, we achieved a training accuracy of 98.52%, and a validation accuracy of 100%. In order to determine an ideal point between underfitting and overfitting the classifier, we calculated the harmonic mean of training performance and validation performance, to avoid both underfitting and overfitting.
We then used the fine-tuned classifier to classify the 36,103 images. Based on the first phase of this exploration, we expected that the image set would include 2,256 document images digitized from microfilm and 33,847 digitized from their original source. In reality, the classifier identified 2,834 images as digitized from microform and 33,269 images as digitized from an original item. See Table 7. Therefore, while we expected a classification ratio of 1:16 (microform to original), the achieved classification ratio was 1:11.74. The classifier was more aggressive in identifying images as having been digitized from a microform reproduction than we would have anticipated based on our initial tests.
TABLE 7. BREAKDOWN OF PROJECTIONS AND ACTUAL CLASSIFICATIONS OF CONTENT AS DIGITIZED FROM MICROFORM OR DIGITIZED FROM AN ORIGINAL ITEM.
Total Images Microform Source Expected Classified Microform Source Expected Original Source Classified Original Source
36,103 2,256 2,834 33,847 33,269
Without identifying the ground truth of each of the 36,103 items, we cannot be sure if the 1:16 ratio is entirely accurate. However, we do know that the classifier was more aggressive in identifying items as digitized from microform reproductions than in classifying them as digitized from an original item. For example, each of the items in Figure 10, Figure 11, Figure 12, and Figure 13, while actually digitized from original items, were classified as being digitized from microform reproductions.
FIGURE 10. FACING PAGES OF A DOCUMENT, DIGITIZED FROM THE ORIGINAL, THAT THE CLASSIFIER CLASSIFIED AS HAVING BEEN DIGITIZED FROM MICROFORM. THERE IS MINIMAL CONTENT ON THE PAGES.
FIGURE 11. A HANDWRITTEN MANUSCRIPT PAGE IMAGE, DIGITIZED FROM THE ORIGINAL, AND CLASSIFIED BY OUR CLASSIFIER AS HAVING BEEN DIGITIZED FROM MICROFORM. THE CONTRAST OF THE IMAGE IS LOW.
FIGURE 12. A DIGITAL IMAGE OF A COIN, DIGITIZED FROM THE ORIGINAL ITEM, AND CLASSIFIED BY OUR CLASSIFIER AS HAVING BEEN DIGITIZED FROM A MICROFORM REPRODUCTION.
FIGURE 13. A DIGITAL IMAGE OF A PHOTOGRAPH, DIGITIZED FROM THE ORIGINAL ITEM, AND CLASSIFIED BY OUR CLASSIFIER HAS HAVING BEEN DIGITIZED FROM A MICROFORM SOURCE.
We believe these misclassifications were due to limitations of our training set, which did not include blank pages digitized from original items, photographs (that is, photographs of people that are included in the manuscript collections, for example), images with poor document contrast, or 3-d objects represented in the collections. In the future, two options could effectively improve the performance further. First, we can expand the training database to include more examples and types of materials. Second, we can apply a pre-processing step to normalize the document image quality for the collection before the prediction stage. Overall, however, results were promising and suggest that automated type differentiation is viable and computationally cheap.
6.5
EXPLORATION: DOCUMENT IMAGE QUALITY ASSESSMENT (DIQA) & ADVANCED DIQA
This exploration set out to analyze the quality of document images in minimally processed manuscript collections based on a variety of criteria with the goal of using information about image quality to inform future processes and toward making this information available for researchers looking for particular kinds of images (or images of particular quality). This exploration was guided by the questions: how might we distinguish among materials that most need human intervention, whether by Library of Congress staff or via crowdsourcing and the public, and those materials that might be well-suited to machine approaches? And when might materials be best suited to a combined approach? Could image quality assessments be useful in compiling ground truth and benchmarking sets in some capacity? Likewise, might such features be useful further downstream for users, to be able to facet for difficulty, for example? How might metadata about image quality of document images enrich understanding of individual items and of collections and corpora? To what extent can quality be computationally assessed, and might it help to better understand overall visual attributes of a dataset?
This exploration proceeded in two phases. In the first phase, we measured a set of image properties for each of 35,990 images retrieved from minimally processed manuscript collections included in the By the People Civil War
campaign. These image properties included skewness, contrast, range-effect, and bleed-through (background noise).14
6.5.1
D
OCUMENTI
MAGEQ
UALITYA
SSESSMENT(DIQA)
6.5.1.1 SKEWNESSThe skewness measure ranges from a score of -2 to 2, with any score other than 0 indicating skew is present. For example, a skew of -2 indicates significant counterclockwise skew, while a score of 2 indicates significant clockwise skew. Of the 35,990 images, nearly 50% of the images show no or negligible skew (a score of 0, or between 0 and |1|). Nearly 44% of the images (43.63%), are significantly skewed. See Chart 1.
CHART 1. SKEWNESS MEASURES OF 35,990 IMAGES FROM MINIMALLY PROCESSED CIVIL WAR COLLECTIONS. 43.63% OF IMAGES ARE SIGNIFICANTLY SKEWED (SCORE |2|).
6.5.1.2 CONTRAST
Based on earlier work, the Aida team has determined that a contrast score of 30 or above indicates a good quality contrast in a digital image of a historic document;15 the higher the contrast score, the better the visual quality. We
plotted contrast over time (original date of document page, based on existing metadata) and determined that the two decades of materials represented in the Civil War collection fell below the threshold for a good contrast score: 1860–1869 and 1930–1939. See Chart 2.
14 The document image quality assessment algorithms used in this exploration were developed as part of the Aida
team’s earlier efforts to assess qualities of newspaper page images from 1834 to 1922. See Lorang, Soh, Liu, Pack, and Rahimi, “Using Chronicling America’s Images to Explore Digitized Historic Newspapers & Imagine Alternative Futures.”
15 Lorang, Soh, Liu, Pack, and Rahimi, “Using Chronicling America’s Images to Explore Digitized Historic Newspapers
& Imagine Alternative Futures.”
43.63% 7.25% 2.48% 46.64% 0.00% 5.00% 10.00% 15.00% 20.00% 25.00% 30.00% 35.00% 40.00% 45.00% 50.00% |score|=2 1<=|score|<2 0<|score|<1 |score|=0
Skewness Measures
CHART 2. AVERAGE CONTRAST SCORES OF MATERIALS WITHIN DECADE-RANGES. FOR EXAMPLE, MATERIALS FROM THE PERIOD 1840-1849 HAVE AN AVERAGE CONTRAST SCORE OF 70.22, WHILE MATERIALS FROM THE PERIOD 1930-1939 HAVE AN AVERAGE CONTRAST SCORE OF 23.87.
While images from 1930 to 1939 result in lowest contrast score, the significant majority of images in the collection— roughly 90%—date to between 1860-1869. These dates also overlap with the actual years of the Civil War, making the images from that decade most critical for further analysis. When we look more closely at the contrast scores within this decade, 1861, 1862, 1863, and 1864 all show average contrast scores below 22. See Chart 3. These data suggest that materials from most of the actual Civil War years have the lowest contrast in the collection and also that their contrast is below the threshold for good visual contrast. The low contrast can make these materials challenging for computational processing and also for human readers.
CHART 3. AVERAGE CONTRAST SCORES OF MATERIALS FROM THE DECADE 1860-1869 BY YEAR. MATERIALS FROM 1861 HAVE AN AVERAGE CONTRAST SCORE OF 21.50, FOR EXAMPLE, WHILE MATERIALS FROM 1868 HAVE AN AVERAGE CONTRAST SCORE OF 48.22.
We suspect that the low score could be document images that are digitized from handwritten letters, shown in Figure 14. There are two persistent features among these letters that could lower the contrast score. First, the original paper is often yellowish in hue. Second, the ink or pencil is often light—again, whether due to original inscription or time, or a combination of elements.
70.22 49.48 25.71 42.03 51.90 54.59 70.88 23.87 58.12 38.12 0.00 10.00 20.00 30.00 40.00 50.00 60.00 70.00 80.00 1840-1849 1850-1859 1860-1869 1870-1879 1880-1889 1890-1899 1910-1919 1930-1939 1940-1949 1950-1959
Contrast
44.93 21.50 20.79 20.71 21.08 30.51 41.95 46.76 48.22 21.63 0.00 10.00 20.00 30.00 40.00 50.00 60.00 1860 1861 1862 1863 1864 1865 1866 1867 1868 18691860 - 1869
FIGURE 14. AN IMAGE WITH A LOW-CONTRAST SCORE FROM THE CIVIL WAR YEARS. FEATURES OF THIS IMAGES, SUCH AS THE COLOR OF THE PAPER AND THE LIGHT INK INSCRIPTION, MAY BE COMMON ACROSS THE MATERIALS, LEADING TO OVERALL LOW CONTRAST SCORES.
6.5.1.3 RANGE-EFFECT
The lower the range effect score, the better the quality of the image with regard to this feature. An ideal score is zero, and our team’s earlier work with historic newspapers suggests that a range-effect score lower than three is indicative of a good-quality image. The materials from the decade 1860-1869 have an average range-effect score of 2.99. With materials in this decade comprising 90% of the images in the set, we believe range effect is not a substantial challenge for images in the Civil War collections. There are some noticeable outliers, as show in Chart 4, though in the case of the images from the period 1930-1939, the average score was significantly affected by two images with very high range-effect scores.
CHART 4. AVERAGE RANGE EFFECT OF THE CIVIL WAR COLLECTION OVER TIME. OVERALL, RANGE EFFECT IS LOW, WITH A SPIKE IN 1930-1939, LIKELY ATTRIBUTABLE TO A COUPLE OF DOCUMENTS IN A SMALL SET OF MATERIALS FROM THAT DECADE.
4.83 5.70 2.99 4.19 4.99 5.99 7.79 27.33 2.18 6.69 0.00 10.00 20.00 30.00 1840-1849 1850-1859 1860-1869 1870-1879 1880-1889 1890-1899 1910-1919 1930-1939 1940-1949 1950-1959
Range-Effect
range-effect avg6.5.1.4 BLEED-THROUGH
Our analysis indicates that very few of the images studied suffer from significant bleed-through, which is a measure of noise in the overall image. While we do not have an objective measure for a good bleed-through score (meaning minimal bleed-through is present), an ideal score is zero. The majority of the 35,990 images return low bleed-through scores. See Chart 5. In this test, there are 76 images from the decade 1940-1949 that have high bleed-through scores and cause the average to spike in that decade.
CHART 5. AVERAGE BLEED-THROUGH/NOISE IN MATERIALS FROM THE CIVIL WAR COLLECTION, BY DECADE.
One caveat, however, is that in our processing, a document image is first converted into a grayscale image by the evaluation algorithm. Many of the pages in the collection are a yellow-hued paper that results in a dark background after the conversion. The presence of a dark background affects bleed-through evaluation and may result in a faulty evaluation.
6.5.2
A
DVANCEDDIQA
In the second iteration of DIQA, we combined elements of the original DIQA, document type differentiation, and document image segmentation explorations. Specifically, we measured a document image’s compactness. In this case, compactness represents the number of zones (i.e., text blocks, figure) in a document image and may be considered as an indicator of document complexity.
To proceed, we first assessed the compactness measures obtained by two segmentation algorithms on a dataset with known, reliable ground-truth. We then applied the compactness measure to minimally processed manuscript collections from the Civil War. Finally, we compared our measure of complexity with difficulty scores ascribed to materials through the Library of Congress’s By the People site, to see if we could determine a correlation between our measure of complexity and document difficulty scores.
The two document segmentation algorithms used were (1) non-machine-learning, Voronoi diagram-based algorithm; and (2) machine-learning-based algorithm, dhSegment, used in other explorations reported here. We tested the two segmentation algorithms on 430 document images collected from the Europeana Newspapers dataset and counted the number of regions segmented by each algorithm. Then, we compared the result with the number of actual regions stored in the ground truth. See Table 8 and Chart 6.
1.52 1.87 3.31 1.65 1.71 1.90 4.30 0.02 12.10 1.36 0.00 2.00 4.00 6.00 8.00 10.00 12.00 14.00 1840-1849 1850-1859 1860-1869 1870-1879 1880-1889 1890-1899 1910-1919 1930-1939 1940-1949 1950-1959
Bleed-Through
bleed-through avgTABLE 8. COMPARISON OF ACCURACY OF COMPACTNESS OF TWO ALGORITHMS. Voronoi-based Segmentation Deep learning-based Segmentation Mean Differences 75 77 STD Differences 97 154
CHART 6. THE COMPACTNESS OF THE EUROPEANA NEWSPAPERS DATASET.
Based on the mean and standard deviation of the difference between the number of zones detected by the algorithms and the ground truth, the compactness obtained by the non-machine-learning-based segmentation algorithm is slightly better than the machine-learning-based algorithm. In addition, when we looked at the number of zones and the compactness of the newspapers dataset, even though the number of zones detected by the two algorithms does not perfectly match with the number of actual zones, we observed a certain degree of similarity between compactness and the actual busyness of document images.
With this understanding, we then turned to several minimally processed manuscript collections from the Civil War, which are featured on By the People and are part of the Civil War campaign. Specifically, we used the Veroni-based approach to assess the compactness of four digitized document image collections, identified as “Civil War,” “Clara Barton,” “Letters to Lincoln,” and “Walt Whitman.” We analyzed within collections and by year/across time. Three collections—Civil War, Letters to Lincoln, and Walt Whitman—show similar compactness distributions. The Clara Barton collection shows a thicker tail, which indicates that images in this collection tend to have a busier layout. Likewise, the Clara Barton collection shows notable changes in compactness across time represented in the collection. Our results suggest that items in the Clara Barton collections from 1862 to 1869 have more complex and busier layouts than those from 1850 to 1861. In the other three collections, we did not find notable compactness differences by time period.
Finally, we wondered if we might find a correlation between our compactness score and the difficulty score applied to an image through the By the People platform. We wondered: did the compactness, or busy-ness, of an image, which can be understood as a marker of complexity, correspond to images with higher difficulty scores? Ultimately, we could not correlate our measure of compactness with the difficulty score from By the People.
The difficulty score itself may not match human perception of difficulty as complex, non-linear relationships exist among visual features. In general, image quality assessment includes both machine and human perceptions of quality of an image. For machine perception, quality assessment evaluates difficulties to predict or categorize an image for a machine. And for human perception, quality assessment evaluates difficulties in understanding and interpreting an image based on the visual appearance.
6.5.3
P
OTENTIALA
PPLICATIONSMuch of this this exploration did not apply machine learning and instead was purely an image processing and image analysis exploration. We pursued it as part of this machine learning project in order grapple with which types of investigations require machine learning and when might other computational approaches be helpful to doing more with digital collections. In addition, such an exploration can facilitate future machine learning applications and endeavors. In cultural heritage digital libraries, administrative and descriptive metadata are common, even if the descriptive metadata are often limited. Various of our other explorations throughout this demonstration project, such as approaches to segmentation and classification, are toward enriching descriptive metadata and also have implications for enhanced structural metadata. As researchers begin to process large quantities of document images to develop robust classifiers or to develop generalizable automated systems, there is an increasing need for metadata about the image quality of the digitized document images, such as average intensity of an image, contrast, range effects, layout structure, etc., such that researchers might query and retrieve specific subsets of document images based on these qualities for testing.
6.6
EXPLORATION: DOCUMENT CLUSTERING
This exploration extended from the initial documentation segmentation exploration and applied clustering to document images. Drawing on our other work with ResNet and dhSegment, we wondered whether document images clustered together share similar visual features recognizable to human observers. For example, would page images with graphical content cluster? Could we discern other clustering features? Could such clusters be useful in decision-making, for metadata generation, or other processes?
Two assumptions shaped this exploration. The first was that the deep visual representation of each datapoint contains enough feature information to be clustered. Second, in the clustered manifold, datapoints residing in the same neighborhoodwill share similar visualmetadata with one another.
This exploration proceeded in two parts. In both parts, we used dhSegment to extract high-level visual features and then clustered the features using t-SNE, a state-of-the-art clustering method.16 The dataset was a set of 96 page
images from the Europeana Newspapers collection. From each of the 96 page images, we extracted a set of feature maps—so-called latent space—learned by a deep model, the ResNet-50 + U-Net that we trained for the document segmentation exploration. In this approach, the size of the latent space is calculated by the formula image width/32 x image height/32 x 2049.
This exploration faced two challenges from the outset. First, the sizes of the input images varied, and they could not be reduced to the same proportions without distorting the images and thus their visual features. The size differences