R E S E A R C H
Open Access
Spending on vegetable and fruit consumption
could reduce all-cause mortality among older
adults
Yuan-Ting Lo
1, Yu-Hung Chang
2, Mark L Wahlqvist
3,4,5,6, Han-Bin Huang
1and Meei-Shyuan Lee
4,5*Abstract
Background:Few studies have evaluated the linkage between food cost and mortality among older adults. This study considers the hypothesis that greater food expenditure in general, and particularly on more nutritious plant and animal-derived foods, decreases mortality in older adults.
Methods:This study uses the 1999–2000 Elderly Nutrition and Health Survey in Taiwan and follows the cohort until 2008, collecting 24-hr dietary recall data for 1781 participants (874 men and 907 women) aged 65 y or older. Using monthly mean national food prices and 24-hr recall, this study presents an estimate of daily expenditures for vegetable, fruit, animal-derived, and grain food categories. Participants were linked to the national death registry. Results:Of the 1781 original participants, 625 died during the 10-y follow-up period. Among the 4 food categories, the fourth and fifth expenditure quintiles for vegetables and for fruits had the highest survival rates. After adjusting for co-variates, higher (Q4) vegetable and higher fruit (Q4) food expenditures referent to Q1 were significantly predictive of reduced mortality (HR = 0.55, 95% CI: 0.39-0.78 and HR = 0.64, 95% CI: 0.42–0.99, respectively) and the risk decreased by 12% and 10% for every NT$15 (US$0.50) increase in their daily expenditures. Animal-derived and grain food spending was not predictive of mortality.
Conclusion:Greater and more achievable vegetable and fruit affordability may improve food security and longevity for older adults.
Keywords:Food expenditure, Mortality, Elders, Vegetables
Introduction
The gains in public health achieved over the past few decades are currently threatened by the global economic and food crises, with young children, women, and older adults in the developing world likely to be dispropor-tionately affected [1]. Poorer households facing food in-security may be in fear or running out of food or money to buy food and face food scarcity because of economic decline. In many cases, they purchase cheaper foods than usual or simply go without food for a day or more for economic reasons [2]. Some older people are at risk of malnutrition because of food insufficiency, and have lower mean intakes of various nutrients and lower
intakes of vegetables and meat and lower dietary variety [3]. Wealthy households have higher expenditures on animal-source foods, vegetables, and fats and oils compared to moderately and severely food-insecure households [4]. Solutions to these dilemmas require further studies that merge health economics and
nutri-tion in the field of what might be called “nutritional
economics”[5].
Most dietary studies have shown that greater vege-table, legumes, and fruit intakes are linked to reduced risk of all-cause mortality in older populations [6-10]. Studies from Bangladesh show that when people spend more money on rice, child and maternal malnutrition increases [11]. This may be because of a corresponding reduction in the intake of other plant foods, such as fruit and vegetables and animal-derived food [11,12]. How-ever, no study has investigated the relationship between * Correspondence:[email protected]
4
School of Public Health, National Defense Medical Center, Taipei, Taiwan
5Monash Asia Institute, Monash University, Melbourne, Victoria, Australia
Full list of author information is available at the end of the article
expenditures on various food groups and older adult all-cause mortality in a relatively affluent society such as Taiwan. We hypothesize that the purchase of more ex-pensive, albeit nutritious foods, such as vegetables, fruits, and animal-derived foods might predict a lower risk of mortality. Conversely, the purchase of less expensive commodities such as rice might be linked to higher mor-tality in older adults. We tested this proposition by assessing the food expenditure profiles of a cohort of older Taiwanese adults followed for 10 y and linked to the National Death Registry.
Methods Study participants
The participants in this study were free-living, older adults aged 65 y or older and involved in the nationally representative Elderly Nutrition and Health Survey in Taiwan (NAHSIT) conducted between 1999 and 2000 [13,14]. A total of 1911 (955 men and 956 women) parti-cipants completed a 24-hr dietary recall by interview at home. Participants were excluded if they reported ex-tremely high or low total daily energy intakes (<500 or >3500 kcal/d in women, <800 or > 4200 kcal/d in men, n = 126), or if their diets comprised only liquid (mainly milk, n = 2). The remaining participants were linked to the National Death Registry up to December 31, 2008. Two participants were excluded because of incorrect death records, leaving 1781 participants eligible for the final analysis [6,15].
Daily food expenditure
This study uses 24-hr dietary recall data collected on the survey day to calculate participants’ intakes of specific foods [13]. The data included 3646 foods. For food price assignment, we combined, categorized, and encoded similar food items as 843 foods. Food items were cate-gorized according to the same or similar names, similar nutrient profile, comparable food physical properties, and similar ingredients irrespective of preparation. Each food was priced at the cost per 100 g, as purchased. The cost of each food was determined from the Taiwanese Council of Agriculture, databases from the Agriculture and Food Agency, Poultry and Livestock Products Current Trade, and the Fisheries Agency from January 1999 to December 2000 expressed in retail prices (New Taiwan Dollars, NTD) [16-18]. All foods were matched with the national average monthly retail price (NTD/ 100 g) based on participants’ interview dates. For foods not included in these sources, prices were obtained from a widely available national supermarket chain with con-sistent prices across Taiwan. In this case, regular 2009 prices listed were used without discount. The supermar-ket prices of these goods were then deflated according
to the Consumer Price Index for 1999–2000. For the
remaining foods without a known cost, proxy prices were used based on the lowest food prices for the same food classification, or the lowest food prices for products with similar ingredients. In total 215 of the 843 foods used this approach. Food costs did not include alcohol, drinking water, or condiments. The food expenditure of participants was generated from these food costs with the assumption that they ate at home. Previous research has presented a detailed description of food price calcu-lation [19]. Food expenditures were assigned to items in 1 of 4 categories: vegetables, consisting of vegetables, beans, soybeans, and soybean products; fruits, consisting of fruit and fresh fruit juices; animal-derived foods, con-sisting of chicken, duck, pork, beef, goat, fish, and shell-fish, eggs, and dairy; and grain foods, consisting of rice and rice products, wheat and flour products, starchy roots and stems, dry beans, and dry bean products. The daily food expenditure for each participant was derived for each of these 4 categories (Table 1).
Co-variates
A medical history was obtained through a face-to-face interview and physical examination. Non-dietary vari-ables were assessed using baseline NAHSIT question-naires. Daily physical activity was measured as the number of metabolic equivalents (METs) calculated from exercise and leisure time activities, based on activ-ity duration, frequency, and intensactiv-ity and number of flights of stair climbed [6]. Several co-variates were con-sidered, including: gender, age (y), ethnicity (Fukienese, Hakka, mainlander, indigenous), personal education (illiterate, primary and below, secondary education and above), living arrangement (living alone, living with spouse, personal income (<5000, 5000–19,999, ≥20,000 NTD/month), smoking (yes, no), alcohol drinking (yes, no), perceived health status (good, fair, poor), physical activity (<1.5, 1.5-3, >3 MET/day), chewing ability (satis-factory, unsatisfactory), body mass index (<18.5, 18.5-23.9, 24–26.9,≥27 kg/m2), and energy intakes (kcal/day). Type 2 diabetes mellitus (yes, no) was as self-reported. The dietary diversity score (DDS), a simple index for dietary quality, ranged from 0–6 [6].
Statistical analysis
category expenditure were compared to those of the lowest quintile. The 3 food category expenditures for vegetables, fruits and grains and total food expenditure were modeled simultaneously with the assumption that total food spending was fixed, and with animal-derived foods excluded given their significantly higher cost. This allowed the interpretability of the estimates of the other 3 categories of food in the model. In other words, with fixed total food expenditure, one category must be sub-stituted for another. In this case, changes in animal-derived foods expenditure would take preeminence, and the exclusion of the category enables evaluating the interplay between vegetables, fruits, and grains, and their
effects on mortality. In addition, this study considers food category expenditures as continuous variables to assess the survival consequences of each NT$15 per day, equivalent to US$0.50, increment in various categories, considering other food category expenditures and total food expenditure.
In the multivariable analyses, covariates included: gen-der, age (y), ethnicity (Fukienese, Hakka, mainlangen-der, indigenous), personal education (illiterate, primary and below, secondary education and above), living arrange-ment (lived alone, lived with spouse), personal income
(<5000, 5000–19,999, ≥20,000 NTD/month), smoking
(yes, no), alcohol drinking (yes, no), health status (good, Table 1 Survival status by quintile of daily food category expenditure (NTD)*
Deceased (n = 625) Survival (n = 1156) P†
Food category Median n % n %
Vegetables
Q1 5.02 165 48.0 191 52.0 0.009
Q2 11.0 126 36.2 230 63.9
Q3 17.1 122 35.2 234 64.8
Q4 24.6 101 29.7 255 70.3
Q5 38.6 111 31.5 246 68.5
Fruits
Q1 0.00 322 43.3 470 56.7 <0.001
Q2 5.46 97 38.3 150 61.7
Q3 13.2 68 30.3 179 69.7
Q4 23.5 66 27.8 181 72.2
Q5 44.0 72 28.3 176 71.7
Animals-derived Foods
Q1 7.71 122 37.5 234 62.5 0.264
Q2 20.6 131 38.1 225 61.9
Q3 33.6 114 29.0 242 71.0
Q4 50.6 134 36.6 222 63.4
Q5 80.2 124 38.1 233 61.9
Grains
Q1 3.77 142 40.5 214 59.5 0.523
Q2 6.26 126 34.4 230 65.6
Q3 8.63 121 32.0 235 68.1
Q4 11.4 123 36.3 233 63.7
Q5 20.5 113 35.6 244 64.4
Total food expenditure
Q1 33.8 135 40.1 221 60.0 0.255
Q2 56.2 141 41.2 215 58.8
Q3 72.6 127 33.8 229 66.2
Q4 94.1 111 32.9 245 67.1
Q5 132 111 32.8 246 67.2
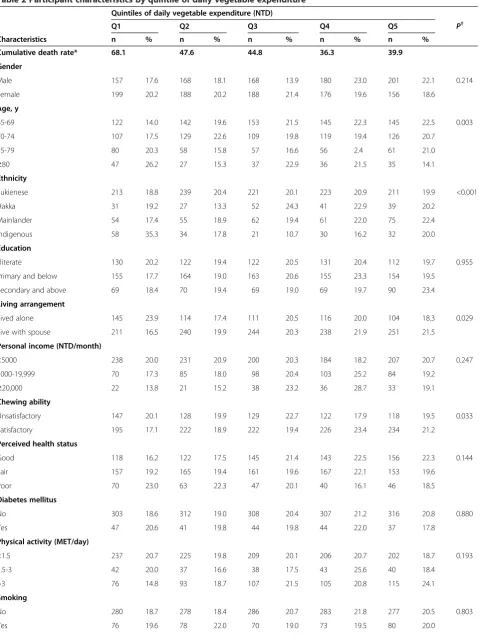
Table 2 Participant characteristics by quintile of daily vegetable expenditure
Quintiles of daily vegetable expenditure (NTD)
Q1 Q2 Q3 Q4 Q5 P†
Characteristics n % n % n % n % n %
Cumulative death rate* 68.1 47.6 44.8 36.3 39.9
Gender
Male 157 17.6 168 18.1 168 13.9 180 23.0 201 22.1 0.214
Female 199 20.2 188 20.2 188 21.4 176 19.6 156 18.6
Age, y
65-69 122 14.0 142 19.6 153 21.5 145 22.3 145 22.5 0.003
70-74 107 17.5 129 22.6 109 19.8 119 19.4 126 20.7
75-79 80 20.3 58 15.8 57 16.6 56 2.4 61 21.0
≥80 47 26.2 27 15.3 37 22.9 36 21.5 35 14.1
Ethnicity
Fukienese 213 18.8 239 20.4 221 20.1 223 20.9 211 19.9 <0.001
Hakka 31 19.2 27 13.3 52 24.3 41 22.9 39 20.2
Mainlander 54 17.4 55 18.9 62 19.4 61 22.0 75 22.4
Indigenous 58 35.3 34 17.8 21 10.7 30 16.2 32 20.0
Education
Illiterate 130 20.2 122 19.4 122 20.5 131 20.4 112 19.7 0.955
Primary and below 155 17.7 164 19.0 163 20.6 155 23.3 154 19.5
Secondary and above 69 18.4 70 19.4 69 19.0 69 19.7 90 23.4
Living arrangement
Lived alone 145 23.9 114 17.4 111 20.5 116 20.0 104 18.3 0.029
Live with spouse 211 16.5 240 19.9 244 20.3 238 21.9 251 21.5
Personal income (NTD/month)
<5000 238 20.0 231 20.9 200 20.3 184 18.2 207 20.7 0.247
5000-19,999 70 17.3 85 18.0 98 20.4 103 25.2 84 19.2
≥20,000 22 13.8 21 15.2 38 23.2 36 28.7 33 19.1
Chewing ability
Unsatisfactory 147 20.1 128 19.9 129 22.7 122 17.9 118 19.5 0.033
Satisfactory 195 17.1 222 18.9 222 19.4 226 23.4 234 21.2
Perceived health status
Good 118 16.2 122 17.5 145 21.4 143 22.5 156 22.3 0.144
Fair 157 19.2 165 19.4 161 19.6 167 22.1 153 19.6
Poor 70 23.0 63 22.3 47 20.1 40 16.1 46 18.5
Diabetes mellitus
No 303 18.6 312 19.0 308 20.4 307 21.2 316 20.8 0.880
Yes 47 20.6 41 19.8 44 19.8 44 22.0 37 17.8
Physical activity (MET/day)
<1.5 237 20.7 225 19.8 209 20.1 206 20.7 202 18.7 0.193
1.5-3 42 20.0 37 16.6 38 17.5 43 25.6 40 18.4
>3 76 14.8 93 18.7 107 21.5 105 20.8 115 24.1
Smoking
No 280 18.7 278 18.4 286 20.7 283 21.8 277 20.5 0.803
fair, poor), physical activity (<1.5, 1.5-3, >3 MET/day), chewing ability (satisfactory, unsatisfactory), body mass index (<18.5, 18.5-23.9, 24–26.9, ≥27 kg/m2), diabetes mellitus (yes, no), and energy (kcal) as well as DDS. Except for DDS, this constituted model 1.
All analyses were conducted using SAS statistical soft-ware (version 8.0, 1999, SAS Institute Inc, Cary, NC). SUDAAN (version 9.0, 2004, Triangle Park, NC) was used to account for the sampling design. A value ofp< 0.05 was considered significant.
Ethics
The protocol of this study: was approved by the ethics committees of both the Academia Sinica and the National Health Research Institutes in Taiwan. All participants provided signed informed consent.
Results
A total of 625 (35.9%) participants died during the 10-y follow-up. Table 1 shows the survival status in relation to each of the 4 food category expenditures. The
Table 3 Hazard ratio (95% confidence interval) of daily food group expenditures and all-cause mortality (n=1781)
Food category Quintile of daily food expenditure (NTD) Pfor trend
Per NTD 15 Per NTD 15†
Q1 Q2 Q3 Q4 Q5
Vegetable, range <8.20 8.21-13.9 14.0-20.6 20.7-29.7 >29.7
Crude Ref. 0.67 (0.51, 0.90) 0.64 (0.46, 0.90) 0.51 (0.38, 0.69) 0.56 (0.39, 0.79) <0.001 0.83 (0.73, 0.94) 0.80 (0.69, 0.93)
Model 1 Ref. 0.82 (0.61, 1.09) 0.78 (0.52, 1.17) 0.55 (0.39, 0.78) 0.74 (0.50, 1.08) 0.022 0.88 (0.77, 1.01) 0.84 (0.72, 0.99)
Model 2 Ref. 0.87 (0.65, 1.17) 0.83 (0.55, 1.25) 0.58 (0.41, 0.83) 0.79 (0.54, 1.15) 0.041 0.91 (0.80, 1.04) 0.87 (0.74, 1.01)
Fruit, range 0 0.10-9.37 9.38-17.1 17.2-29.5 >29.6
Crude Ref. 0.86 (0.65, 1.14) 0.63 (0.46, 0.86) 0.57 (0.43, 0.77) 0.60 (0.43, 0.82) <0.001 0.86 (0.79, 0.93) 0.84 (0.76, 0.93)
Model 1 Ref. 0.92 (0.73, 1.17) 0.62 (0.42, 0.92) 0.64 (0.42, 0.99) 0.69 (0.45, 1.05) 0.020 0.90 (0.81, 1.22) 0.88 (0.77, 1.00)
Model 2 Ref. 1.02 (0.81, 1.28) 0.76 (0.53, 1.09) 0.78 (0.49, 1.27) 0.80 (0.53, 1.22) 0.219 0.95 (0.87, 1.04) 0.92 (0.82, 1.04)
Grain, range <5.11 5.11-7.40 7.50-10.0 10.1-14.4 >14.4
Crude Ref. 0.81 (0.55, 1.18) 0.72 (0.51, 1.03) 0.86 (0.62, 1.12) 0.84 (0.56, 1.26) 0.485 0.97 (0.79, 1.18) 1.00 (0.82, 1.22)
Model 1 Ref. 0.76 (0.51, 1.12) 0.80 (0.54, 1.20) 0.83 (0.59, 1.18) 0.82 (0.52, 1.30) 0.275 1.00 (0.81, 1.22) 1.02 (0.83, 1.24)
Model 2 Ref. 0.78 (0.53, 1.15) 0.82 (0.56, 1.22) 0.87 (0.62, 1.22) 0.84 (0.54, 1.30) 0.317 1.00 (0.81, 1.22) 1.01 (0.82, 1.24)
Animal-derived, range <14.6 14.7-27.3 27.4-41.0 41.1-61.6 >61.7
Crude Ref. 1.02 (0.69, 1.52) 0.73 (0.49, 1.08) 0.97 (0.60, 1.42) 1.01 (0.69, 1.48) 0.956 1.03 (0.99, 1.07) 1.03 (0.99, 1.08)
Model 1* Ref. 0.94 (0.67, 1.33) 0.69 (0.44, 1.07) 0.73 (0.50, 1.06) 0.74 (0.44, 1.25) 0.043 0.95 (0.82, 1.09) 0.94 (0.81, 1.10)
Model 2* Ref. 1.02 (0.72, 1.44) 0.76 (0.47, 1.23) 0.82 (0.55, 1.24) 0.85 (0.48, 1.51) 0.246 0.97 (0.84, 1.12) 0.97 (0.83, 1.13)
Model 1: Adjusted simultaneously for total food, vegetable, fruit, and grain (but not animal-derived foods) expenditures, gender, age (y), ethnicity (Fukienese, Hakka, mainlander, indigenous), personal education (illiterate, primary and below, secondary education and above), living arrangement (lived alone, lived with spouse), personal income (<5000, 5000–19,999,≥20,000 NTD/month), smoking (yes, no), alcohol drinking (yes, no), health status (good, fair, poor), physical activity (<1.5, 1.5-3, >3 MET/day), chewing ability (satisfactory, unsatisfactory), body mass index (<18.5, 18.5-23.9, 24–26.9,≥27 kg/m2), diabetes mellitus (yes, no), and energy (kcal).
Model 2: Further adjusted for dietary diversity score.
*
These models for animal-derived foods have also been adjusted for the same variables as for Models 1 and 2, except for grains. †All subjects who died in the first year of follow-up were excluded.
Table 2 Participant characteristics by quintile of daily vegetable expenditure(Continued)
Alcohol drinking
No 297 19.9 285 19.2 280 20.0 281 20.9 285 20.1 0.207
Yes 57 14.0 71 19.1 76 22.2 74 23.5 71 21.2
Body mass index (kg/m2)‡ 23.3 0.30 24.1 0.27 23.6 0.26 23.5 0.27 23.6 0.25
<18.5 27 26.4 12 8.45 15 19.4 19 23.5 19 22.2 <0.001
18.5-23.9 121 19.7 125 17.0 121 21.3 125 20.6 126 21.4
24-26.9 79 16.4 69 17.7 85 19.1 78 22.8 85 24.0
≥27 37 14.1 49 21.3 52 22.9 46 20.0 59 21.7
*Per 1000 person-years.
†Differences across quintiles were tested by chi-square for categorical variables.
deceased in the highest 2 quintiles of vegetable
expendi-tures were proportionately lower (p = 0.009). However,
almost 50% of the older adults in the first quintile were deceased. The top 2 quintiles for fruit expenditures have significantly greater survivorship than the lower expend-iture quintiles (p < 0.001). The differences for animal-derived foods, for grains, and for total food expenditure are not significant.
The cumulative death rates were 68.1 and 39.9 per 1000 person-years in the first and the fifth quintiles of vegetable expenditures, respectively. The lowest rate was 36.3 in the fourth quintile (Table 2). Participants aged 80 y or older, indigenous, or who lived alone were more likely to have lower expenditures on vegetables, and gen-der, education, and income produced no significant differ-ences. Participants whose chewing ability was satisfactory were more likely to have higher vegetable expenditures; however, perceived health status and physical activity were not significantly associated. The findings for fruits were similar to those for vegetables (data not shown).
In the crude model, the HRs for all-cause mortality of the participants significantly decreased as the expenditures
of vegetables and fruits increased; however, no such relationship for grains and animal-derived foods was observed. This pattern remains after simultaneous adjustment for total food, vegetables, fruits, and grains expenditures, age, and gender (Table 3). With further adjustments for potential co-variates, the Q4 and Q5 for vegetable expenditure had HR values significantly lower than Q1 for all-cause mortality (Q4, HR = 0.55, 95% CI: 0.39-0.78; Q5, HR = 0.74, 95% CI: 0.50-1.08), and the dose–response relationship was significant. For fruits, Q3 and Q4 expenditures were associated with signifi-cantly lower mortality rates compared to Q1 (Q3, HR = 0.62, 95% CI: 0.92; Q4, HR = 0.64, 95% CI:
0.42-0.99), and the dose–response relationship remained
significant in the model 1. With further adjustment for DDS, the Q4 for vegetable expenditure remained signifi-cant whereas it did not for fruit. For grains and animal-derived foods, neither the HRs nor the linear trends were significant in the adjusted models.
When treating food expenditure as a continuous vari-able, every NT$15 increase in daily vegetable or fruit expenditure led to 12% or 10% reductions, respectively,
Table 4 Daily dietary nutrient intakes by vegetable expenditure*
Total population
Quintiles (range) of daily vegetable expenditure (NTD/day) P† Q1 (<8.20) Q2 (8.21-13.9) Q3 (14.0-20.6) Q4 (20.7-29.7) Q5 (>29.7)
Energy (kcal) 1626 1574 1667 1586 1677 1621 0.554
Protein (g) 65.2 58.3 62.5 66.0 68.2 70.3 0.001
Total fat (g) 44.1 46.3 44.1 43.4 43.9 43.0 0.737
SFA (g) 13.3 16.0 13.4 13.0 12.6 11.5 0.001
PUFA (g) 13.5 12.0 13.3 13.2 14.1 14.8 0.011
Cholesterol (mg) 207 209 214 222 206 184 0.080
Carbohydrate (g) 215 205 213 218 219 220 0.078
Dietary fiber (g) 18.8 13.7 14.8 16.8 20.9 27.3 <0.001
Fe (mg) 11.5 8.38 9.41 10.5 13.2 15.5 <0.001
Ca (mg) 624 544 556 576 633 798 <0.001
P (mg) 944 862 899 945 965 1039 0.007
Mg (mg) 225 179 196 215 235 294 <0.001
Na (mg) 4520 3499 3753 4245 5118 5831 <0.001
K (mg) 2270 1698 1899 2178 2416 3087 <0.001
Vitamin A (I.U.) 9354 5234 6605 8345 11353 14664 <0.001
Vitamin D (mg) 5.30 4.95 5.57 5.96 5.06 4.67 0.300
Vitamin E (mg) 7.46 5.89 6.46 7.19 8.30 9.23 <0.001
Vitamin B-1 (mg) 1.07 0.96 1.04 1.01 1.13 1.19 0.167
Vitamin B-2 (mg) 1.35 1.43 1.35 1.25 1.29 1.41 0.114
Niacin (mg) 13.4 12.0 12.7 13.4 14.4 14.5 0.050
Vitamin B-6 (mg) 1.11 1.02 1.01 1.05 1.20 1.26 0.006
Vitamin C (mg) 148 105 122 133 171 202 <0.001
*
All values are presented by mean.
in all-cause mortality, when holding total food and grains expenditures and potential co-variates constant (Table 3). After excluding participants who died in the first year of follow-up, every NT$15 increase in daily vegetable expenditure caused a 16% reduction in all-cause mortality (HR = 0.84, 95% CI: 0.72, 0.99). For fruit, every NT$15 increase in daily fruit expenditure was associated with a 12% reduction in all-cause mortality (HR = 0.88, 95% CI: 0.77, 1.00).
The daily dietary nutrient intakes for those whose vegetable expenditure in Q4 or Q5 were lower in satu-rated fat and higher in polyunsatusatu-rated fat, dietary fiber, Ca, Mg, K and vitamins A, E, B-6, and C (Table 4).
Discussion
This study shows that vegetable and fruit expenditures are associated with less risk of death in the elderly in Taiwan. Both of these expenditures are higher than that for grains, but less than that for animal-derived foods. Contrary to the original hypothesis, there was no identi-fiable association between animal or grain food costs and all-cause mortality.
Vegetables and fruits are important sources of many bioactive components, including polyphenols, carote-noids, folate, and vitamin C [21]. Whether these phyto-chemicals or micronutrients can explain the association between vegetable and fruit expenditures and all-cause mortality in older adults remains unclear. Research by the International Union of Nutritional Sciences Food Habits in Later life (IUNS-FHILL) study shows that inte-grated indices of the diet, akin to a Mediterranean diet score, can account for more of the link between diet and mortality than any other food item, except for legumes, or specific nutrients [9 ,10]. Lee et al. found support for this finding for food indices and mortality in Taiwan [6]. A study by the European Prospective Investigation into Cancer and Nutrition (EPIC) showed a small inverse as-sociation between the intake of total fruits and vegeta-bles and cancer risk [22]; a higher intake of fruits and vegetables is associated with a reduced risk of ischemic heart disease mortality in the same cohort [23].
Evidence from rural Indonesia shows that households that spend a greater proportion on plant foods have lower under-5 child mortality [24]. However, no study has focused on food expenditures in relation to older adult mortality. Our study shows that vegetable and fruit expenditures had a protective effect on all-cause mortal-ity in elders. After controlling for potential confounders, the Q4 of vegetables had a 45% lower all-cause mortality compared to those of the lowest quintile, and for fruit had a 36% lower all cause mortality. With adjustment for dietary quality (DDS), the significance of the HR for vegetables was unchanged, and that for fruits dimin-ished. This indicates a greater dependence on dietary
diversity or an integrated food pattern for fruit than for vegetable expenditure where the latter appears to have associations with mortality of its own. In some respects, a vegetable mortality link in Taiwan could have been relatively obscure. This is because the general population eats vegetables, and especially green leafy vegetables and soybeans (as myriad forms of tofu) extensively and regu-larly [6]. Thus, this might not have been a discriminating factor for survival difference. However, seasonality and natural disasters, especially typhoons, can alter vegetable supply dramatically and drive up prices quickly. This in turn makes vegetables unaffordable for the economically marginalized, including some older adults. In the event, vegetable costs in Taiwan are a survival discriminator for older adults. The finding of survival advantage with greater vegetable expenditure makes the prospects of food security for those with limited means and marginal vegetable supplies more achievable.
A possible reason the top quintile of vegetables has a higher HR than the fourth quintile may be the diminish-ing marginal health benefit of vegetable intakes with
their greater consumption, “crowding out” other food
commodities. Thus, the Q4 for vegetables may represent optimal food expenditure among Taiwanese older adults for the greatest health benefit (as judged by mortality). The mean for this Q4 for vegetables is 463 g/d for fruit is 377 g/d, which meets the World Health Organization’s recommendations for vegetable and fruit consumption [22]. However, once sufficiency is reached, those who consume more vegetables or fruit (or even other food commodities) might improve their health based on cri-teria other than mortality, such as disease and wellbeing. This study cannot rule out the possibility that partici-pants who acquired and consumed more than the food intake analysis identified incurred greater food expendi-tures. There is the additional question as to whether living longer through eating a more diverse diet costs more. Published findings demonstrate that, for the most part, a food-diverse diet costs more than a less diverse diet [19]. In this case, it costs more to live longer if lon-gevity is dependent on“buying food diversity.”This then begs the question of affordability as reported by Golan et al. [25]. The effect of greater expenditure on vegeta-bles and fruits to reduce mortality may be mediated by increasing dietary diversity. Thus, both food expendi-tures and dietary quality should be considered in calcu-lating mortality risk. From food and economic policy perspectives, providing people with nutritious and affordable food requires further consideration.
first year of follow-up. A NT$15 increase for each of these food expenditures should not to be an economic barrier for most older Taiwanese, but may well be for the socioeconomically marginalized. The lack of this increased spending on vegetables and fruits may repre-sent a reluctance, rather than an inability, to expend these amounts. This could be because of food prefer-ences or chewing difficulty, the latter of which appears to be the case in this cohort [15]. This study also adjusts for BMI and diabetes, which reflect energy and meta-bolic disorders likely to change eating habits, whether they contribute to or are caused by these conditions. However, these situations do not alter the place of vege-table and fruit expenditures in mortality risk.
Households in developing countries, which spend a greater proportion of food expenditure on grain food, tend to have more underweight children and higher under-5-year old child mortality [12,24]. Although this study of older adults in Taiwan shows no adverse effects of grain expenditure on mortality, there was no advan-tage either. This may be a reflection of the dominant use of polished rice, rather than whole grains, in an age-group where whole grains are likely to confer a health advantage [26]. Other factors also make the expenditure of grain in an older Asian’s diet a special matter. As a common staple food, grain (and especially rice) has cul-tural significance with its own food, health, and eco-nomic system relevance. In Taiwan, the self-sufficiency ratio for rice is almost 100%, and its price is relatively stable [27]. The need for satiation is not usually the problem. However, an older adult’s choice of vegetables or fruits is likely to remain a health consideration across a wide spectrum of economic development and personal circumstances.
This study has focused on food group expenditure ra-ther than food intake in relation to mortality in elders. This can provide information and insight into whether food expenditure and affordability are associated with survival. In addition, it draws attention to the most vul-nerable group.
There are some limitations to this study. First, food costs are based on a 1-d food consumption, which might have changed over time. Since individual diets vary from day to day, one 24-hr dietary recall might result in a less precise measurement of usual food intake. However, for any participant, the survey day was random which might lead to non-differential misclassification and might bias overall HR estimates toward the null value [28-30]. Even so, we still see a significant financial effect in relation to mortality. Therefore, with a more precise dietary method, the effect should be more evident. Moreover, Taiwanese older adults are generally relatively stable in their dietary pattern so that the dietary method used may not be a serious limitation [15].
The food prices in this study were derived from na-tional average monthly prices and did not consider re-gional price variations [31]. In some cases, there are retail food price differences among Taiwanese regions. With the exception of supermarket chain prices, food prices were based on raw food ingredients for domestic use, and did not include the cost margins for preparing food or eating out (which is common in Taiwan). In addition, the food sources may have been home grown or received from friends or relatives. These could result in overestimates or underestimates of actual food costs. Because Taiwan is a relatively affluent country, these findings may not be extrapolated to countries at differ-ent stages of economic developmdiffer-ent or with differdiffer-ent types of cultural food. Although the Taiwanese popula-tion is predominantly Chinese, there are also significant indigenous populations.
Although some of the barriers to purchasing nutritious food may be overcome, as previously shown in Taiwan [19], vegetables and fruits, which may confer a survival advantage, remain the more costly food categories. This presents a food equity and policy dilemma. This problem may be partly addressed by understanding how house-hold expenditures on various foods affect mortality rates.
Socio-demographic profiles of the population studied in relation to quintiles of vegetable and fruit expend-iture are associated with wide divergence for ethnicity (e.g., indigenous Taiwanese) and living arrangements, although not for education or income. The ethnic diver-gence is correlated with locality and region [6], with Indi-genes being more mountainous and east coastal. Since plant food sources may be more local or home-garden and less retail for Indigenes, our generalizations may be correspondingly limited [32]. At the same time, remote communities are less likely to participate in the main-stream food supply as studied by us. There are health risk and outcome variations across Taiwan which may also limit our deductions [33].
In conclusion, vegetable and fruit expenditures are associated with lower mortality among older Taiwanese adults, and may improve survival by contributing to dietary diversity. However, there are limits to the need for these food expenditure measures beyond the higher quintiles of intake. In the Taiwanese economy, the cost of the main grain staple and expenditure on animal pro-duce are not discriminant for mortality. Although the incremental costs are currently modest, an emphasis on national nutrition policy in Taiwan advocating affordable fruits and vegetables should improve food security and longevity among older adults.
Competing interests
Authors’contributions
All authors were involved in the study design and collectively wrote the paper; YTL analyzed the data; MLW and MSL coordinated the research; MSL had primary responsibility for the final content. All authors read and approved the final manuscript.
Acknowledgments
The authors are thankful for the financial support provided by the National Science Council (NSC100-2320-B-016-005) and the National Health Research Institutes. Both of the data sets for this study were collected for the research project“Elderly Nutrition and Health Survey in Taiwan 1997–2002 (NAHSIT Elderly)”and National Death Registration data sponsored by Department of Health, Executive Yuan in Taiwan. The NASHIT project was conducted by the Institute of Biomedical Sciences of Academia Sinica and the Research Center for Humanities and Social Sciences, Center for Survey Research, Academia Sinica, directed by Dr. Wen-Harn Pan and Dr. Su-Hao Tu. All authors read and approved the final manuscript.
Author details
1Graduate Institute of Life Sciences, National Defense Medical Center, Taipei,
Taiwan.2Division of Health Policy Translation, Institute of Population Health Sciences, National Health Research Institutes, Taipei, Taiwan.3Division of
Preventive Medicine and Health Services Research, Institute of Population Health Sciences, National Health Research Institutes, Taipei, Taiwan.4School
of Public Health, National Defense Medical Center, Taipei, Taiwan.5Monash Asia Institute, Monash University, Melbourne, Victoria, Australia.6Department
of Epidemiology and Preventive Medicine, Monash University, Melbourne, Victoria, Australia.
Received: 18 July 2012 Accepted: 12 December 2012 Published: 19 December 2012
References
1. Christian P:Impact of the economic crisis and increase in food prices on child mortality: exploring nutritional pathways.J Nutr2010,
140:177s–181s.
2. Sarlio-Lahteenkorva S, Lahelma E:Food insecurity is associated with past and present economic disadvantage and body mass index.J Nutr2001,
131:2880–2884.
3. Lee JS, Frongillo EA Jr:Nutritional and health consequences are associated with food insecurity among U.S. elderly persons.J Nutr2001,
131:1503–1509.
4. Melgar-Quinonez HR, Zubieta AC, MkNelly B, Ntziyaremye A, Gerardo MF, Dunford C:Household food insecurity and food expenditure in Bolivia, Burkina Faso. And the Philippines.J Nutr2006,136:1431s–1437s. 5. Lenoir-Wijnkoop I, Dapoigny M, Dubois D, van Ganse E, Gutierrez-Ibarluea I,
Hutton J,et al:Nutrition economics - characterising the economic and health impact of nutrition.Br J Nutr2011,105:157–166.
6. Lee MS, Huang YC, Su HH, Lee MZ, Wahlqvist ML:A simple food quality index predicts mortality in elderly Taiwanese.J Nutr Health Aging2011,
15:815–821.
7. Nothlings U, Schulze MB, Weikert C, van der Schouw YT, Bamia C, Benetou V,et al:Intake of vegetables, legumes, and fruit, and risk for all-cause, cardiovascular, and cancer mortality in a European diabetic population.J Nutr2008,138:775–781.
8. Gonzalez S, Huerta JM, Fernandez S, Patterson AM, Lasheras C:Differences in overall mortality in the elderly may be explained by diet.Gerontology 2008,54:232–237.
9. Darmadi-Blackberry I, Wahlqvist ML, Kouris-Blazos A, Steen B, Lukito W, Horie Y,et al:Legumes: the most important dietary predictor of survival in older people of different ethnicities.Asia Pac J Clin Nutr2004,
13:217–220.
10. Trichopoulou A, Kouris-Blazos A, Wahlqvist ML, Gnardellis C, Lagiou P, Polychronopoulous E,et al:Diet and overall survival in elderly people.
BMJ1995,311:1457.
11. Campbell AA, de Pee S, Sun K, Kraemer K, Thorne-Lyman A, Moench-Pfanner R,et al:Household rice expenditure and maternal and child nutritional status in Bangladesh.J Nutr2010,140:189s–194s. 12. Torlesse H, Kiess L, Bloem MW:Association of household rice expenditure
with child nutritional status indicates a role for macroeconomic food policy in combating malnutrition.J Nutr2003,133:1320–1325.
13. Wu SJ, Chang YH, Wei IL, Kao MD, Lin YC, Pan WH:Intake levels and major food sources of energy and nutrients in the Taiwanese elderly.Asia Pac J Clin Nutr2005,14:211–220.
14. Pan WH, Hung YT, Shaw NS, Lin W, Lee SD, Chiu CF,et al:Elderly Nutrition and Health Survey in Taiwan (1999–2000): research design,
methodology and content.Asia Pac J Clin Nutr2005,14:203–210. 15. Lee MS, Huang YC, Wahlqvist ML:Chewing ability in conjunction with
food intake and energy status in later life affects survival in Taiwanese with the metabolic syndrome.J Am Geriatr Soc2010,58:1072–1080. 16. Fish Price Query:Fisheries Agency, Agriculture and Food Agency, Council of
Agriculture, Executive Yuan, R.O.C. Taiwan. http://www.fa.gov.tw/chnn/ statistics_price/price/].
17. Yearly Report of Taiwan’s Agriculture:Agriculture and Food Agency, Council of Agriculture, Executive Yuan, R.O.C. Taiwan. http://www.coa.gov.tw/view. php?catid=207].
18. Poultry and Livestock Products Current Trade:Agriculture and Food Agency, Council of Agriculture, Executive Yuan, R.O.C. Taiwan. http://agrapp.coa.gov. tw/agrPR-net/index.htm.
19. Lo YT, Chang YH, Lee MS, Wahlqvist ML:Dietary diversity and food expenditure as indicators of food security in older Taiwanese.
Appetite2012,58:180–187.
20. Willett W:Implications of Total Energy Intake for Epidemiologic Analyses. Nutritional Epidemiology. 2nd edition. New York: Oxford University Press; 1998.
21. Lako J, Trenerry VC, Wahlqvist M, Wattanapenpaiboon N, Sotheeswaran S, Premier R:Phytochemical flavonols, carotenoids and the antioxidant properties of a wide selection of Fijian fruit, vegetables and other readily available foods.Food Chem2007,101:1727–1741.
22. Boffetta P, Couto E, Wichmann J, Ferrari P, Trichopoulous D, Bueno-de-Mesquita HB,et al:Fruit and vegetable intake and overall cancer risk in the European Prospective Investigation into Cancer and Nutrition (EPIC).J Natl Cancer Inst2010,2010(102):529–537. 23. Crowe FL, Roddam AW, Key TJ, Appleby PN, Overvad K, Jakobsen MU,et al:
Fruit and vegetable intake and mortality from ischaemic heart disease: results from the European Prospective Investigation into Cancer and Nutrition (EPIC)-Heart study.Eur Heart J2011,32:1–9.
24. Campbell AA, Thorne-Lyman A, Sun K, de Pee S, Kraemer K,
Moench-Pfanner R,et al:Greater household expenditures on fruits and vegetables but not animal source foods are associated with decreased risk of under-five child mortality among families in rural Indonesia.
J Nutr2008,138:2244–2249.
25. Golan E, Stewart H, Kuchler F, Dong D:Can Low-Income Americans Afford a Healthy Diet?Amber Waves2008,6:26–33.
26. Sahyoun NR, Jacques PF, Zhang XL, Juan W, McKeown NM:Whole-grain intake is inversely associated with the metabolic syndrome and mortality in older adults.Am J Clin Nutr2006,83:124–131.
27. Huang CT, Fu TY, Chang SS:Crops and food security–experiences and perspectives from Taiwan.Asia Pac J Clin Nutr2009,18:520–526. 28. Kant AK, Schatzkin A, Harris TB, Ziegler RG, Block G:Dietary diversity and
subsequent mortality in the First National Health and Nutrition Examination Survey Epidemiologic Follow-up Study.Am J Clin Nutr1993,
57:434–440.
29. Copeland K:Bias due to misclassification in the estimation of relative risk.
Am J Epidemiol1977,105:488–495.
30. Dosemeci M, Wacholder S, Lubin JH:Does nondifferential misclassification of exposure always bias a true effect toward the null value?Am J Epidemiol1990,132:746–748.
31. Clauson A, McCray D:Food price changes vary regionally.Food Review 1997,20:5–7.
32. Wen CP, Tsai SP, Shin YT, Chung WSI:Bridging the gap in life expectancy of the aborigines in Taiwan.Int J Epidemiol2004,33:320–327.
33. Wen CP, Tsai SP, Chung WS:A 10-year experience with universal health insurance in Taiwan: measuring changes in health and health disparity.
Ann Intern Med2008,148:258–267.
doi:10.1186/1475-2891-11-113
Cite this article as:Loet al.:Spending on vegetable and fruit consumption could reduce all-cause mortality among older adults.