A PWM CONTROLLED
SYNCHRONOUS LINK CONVERTER
SCHEME FOR POWER QUALITY
IMPROVEMENT AT NONLINEAR
LOAD
GARIMA GOSWAMI
Asst. Proffessor ,Electrical &Electronics Engg.Deptt , AEC, AGRA, MTU, NOIDA, U.P
PANKAJ KUMAR GOSWAMI
Asst. Proffessor ,Electronics & Communication Engg.Deptt , HCST, Mathura, MTU, NOIDA, U.P
Abstract :
The harmonics generated by nonlinear load when added with reactive load causes more problematic to supply system as it not only affects transformer at supply end, but also to other consumers connected to same supply. Because of these problems, the power quality is an issue and an object of great concern not only for consumers but also for distributors
.
This paper presents modeling and simulation of a Synchronous Link Converter (SLC) using PWM connected to a single-phase system having both reactive and non-linear load. The SLC acts as Active Power Filter for harmonics compensation and static Synchronous Compensator for variable compensation of load. The proposed model is designed and simulated using MATLAB/Simulink. The relevant results are presented for justifications.Keywords:
SLC; Active Filters; Harmonics Compensation; Power Quality; MATLAB/SIMULINK;1. Introduction
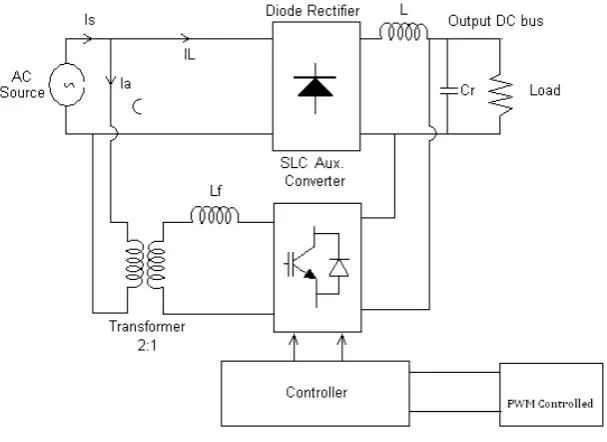
Fig. 1 Parallel converter scheme
2.1.Power quality Analysis with Linear load Application
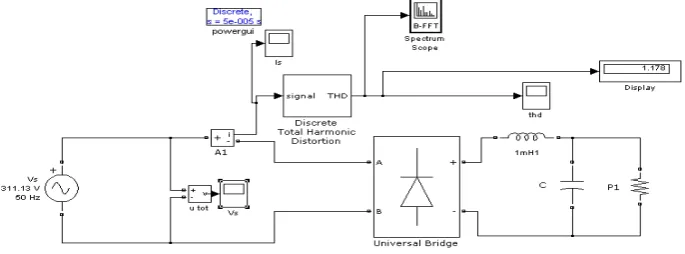
Fig. 2 linear load model
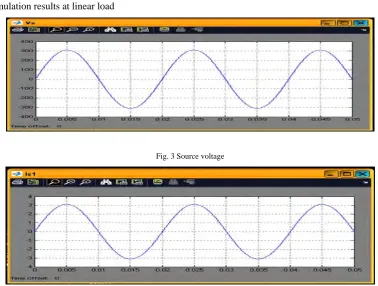
2.1.1 Simulation results at linear load
Fig. 3 Source voltage
Fig. 4 Load current
2.2.Power quality Analysis with Non Linear load Application
2.2.1 Simulation results at non linear load
Fig. 6 source voltage
Fig 7 Harmonic distortion in line current at non linear load
2.3.Power Quality Improvement on Nonlinear Load using SLC with PWM control
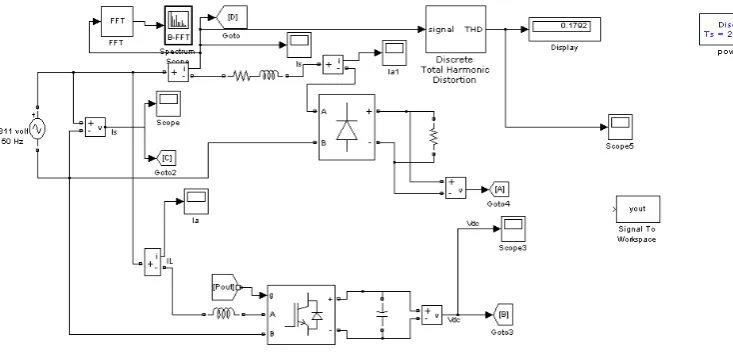
Fig. 8 Simulink Model of Proposed Harmonic Reduction scheme
2.3.1 Simuation Results of Proposed Scheme
Fig 9 source voltage at proposed model
Table 1: Comparative analysis of power quality improvement Applied voltage (peak value) (Vs) Source current (peak value) (Is)
Load THD
(%) R (ohm) L (mH) Non linear load With linear load
311.13v 3.2 A with out distortion
200 1 _____ Less
than 1 % With non
linear load
311.13v Appx 3.2 A with distortions
200 1 Thyristor Bridge converter 117% With non linear load using SLC
311.13v 3.2 A with very reduced THD
200 1 Thyristor Bridge converter In parallel with
SLC
17%
3. Conclusion:
References
[1] Roger C. Dugan/Mark F. Mc Granaghan “Electrical power system quality” by published by McGrawHill.
[2] Prof. Mack Grady “Understanding Power System Harmonics” by Dept. of Electrical & ComputerEngineering University of Texas at Austin. www.ece.utexas.edu/~grady
[3] L. Rossetto, G. Spiazzi, P.Tenti “Control Techniques for power factor correction converter”,world academy of science ,engineering and technology,2011
[4] Dr. R.K. Tripathi, Member, IEEE & Mr. Chandreshver Pratap Singh “Power Quality Control of Unregulated Non-linear Loads”, Power, Control and Embedded Systems (ICPCES), 2010 InternationalConference on Nov. 29 2010-Dec. 1 2010 , 1 - 6
[5] B. Singh, K. Al-Haddad, and A. Chandra, “A review of active filters for power quality improvement”, IEEE Trans. Ind. Electron. 46 (6),960–971 (1999).
[6] Bhim Singh, Brij N. Singh, Ambrish Chandra, Kamal Al-Haddad,Ashish Pandey, and Dwarka P. Kothari,“A Review of Single-Phase Improved Power Quality AC-DC Converters,” IEEE Trans. Ind. Electronics, vol. 50, No. 4, 2003,pp. 410-417
[7] Luis A. Morán Juan W. Dixon José R. Espinoza, Rogel R. Wallace, “Using Active power filters timprove power quality”,