Preterm Infants
WHAT’S KNOWN ON THIS SUBJECT: Renal function is fragile in very preterm infants. Doses of drugs with glomerular clearance should be adapted to GFR, yet there is no normogram of GFR for very preterm infants.
WHAT THIS STUDY ADDS: This study presents a normogram of GFR in very preterm infants that is easy to use in clinical practice and that should be useful for physicians who work in NICUs.
abstract
OBJECTIVE:In very preterm infants, there is a high risk for impaired kidney function; therefore, access to normal ranges of glomerular fil-tration rate (GFR) for age and definition of a reliable normal range of glomerular clearance is essential. Despite this, updated GFR reference values for use in clinical practice are not available. The objective of this study was to determine GFR reference values in very preterm infants aged 27 to 31 weeks’ gestation.
METHODS:This was a multicenter, prospective cohort study. Infants were recruited to the study before 48 hours of life. Glomerular clear-ance was measured at inclusion, then weekly for the first month. Ref-erence values were determined by measurement of 12-hour urine specimens and generation of a linear regression model with repeated measures after removal of risk factor components. Validation was checked with a bootstrap technique for infants who were not exposed to significant risk factors.
RESULTS:This study included 275 infants. Median GFR reference val-ues (mL/min per 1.73 m2) in infants aged 27 to 31 weeks’ gestation ranged from 7.9 to 30.3 on day 7, 10.7 to 33.1 on day 14, 12.5 to 34.9 on day 21, and 15.5 to 37.9 on day 28.
CONCLUSIONS:The GFR reference values, presented in this article as 3rd, 10th, 50th, 90th, and 97th percentiles, should be useful in NICUs for adaptation of drug doses to glomerular clearance and in defining in-fants who present with altered GFR and who need additional investiga-tion and close follow-up to adjust fluid intake and drug dosage.
Pediatrics2010;125:e1186–e1192
AUTHORS:Rachel Vieux, MD,a,bJean-Michel Hascoet, MD,a
Dana Merdariu, MD,aJeanne Fresson, MD,cand Francis
Guillemin, MD, PhDb
aNeonatal Department andcClinical Epidemiology and
Biostatistics Department, Nancy-University, Nancy, France; and
bINSERM EA 4003, CIC-EC, CHU de Nancy, Nancy-University, Nancy,
France
KEY WORDS
neonatal adaptation, very low birth weight, renal clearance, reference range, NICU
ABBREVIATIONS
GFR— glomerular filtration rate GA— gestational age
COX— cyclooxygenase
IUGR—intrauterine growth restriction
This trial has been registered at www.clinicaltrials.gov (identifier NCT00217191).
www.pediatrics.org/cgi/doi/10.1542/peds.2009-1426 doi:10.1542/peds.2009-1426
Accepted for publication Jan 5, 2010
Address correspondence to Rachel Vieux, MD, Department of Neonatology, Maternite Regionale Universitaire, 10 Rue Docteur Heydenreich, 54042, Nancy, France. E-mail:
PEDIATRICS (ISSN Numbers: Print, 0031-4005; Online, 1098-4275). Copyright © 2010 by the American Academy of Pediatrics
Physicians in NICUs care for preterm infants who have not reached the de-velopmental status required for nor-mal postnatal adaptation to extrauter-ine life. Hence, their demanding task is to deliver drugs and administer tech-nical life support to these infants, do-ing their best not to alter organic, hor-monal, and enzymatic development.
The status of infants can be monitored with biological data; consequently, knowing normal ranges is important. There is an increased concern for bio-logical data reflecting renal function in preterm infants. Published data on the effects of preterm birth in adulthood, low birth weight,1 and especially nephron deficit2–6have contributed to this interest in preterm infants’ renal function; however, it is difficult to eval-uate precisely renal glomerular clear-ance in preterm infants and to estab-lish levels of risk for acute kidney glomerular injury in this population, which is already at increased risk be-cause of prematurity. Hence, it is im-portant to establish reference values for glomerular clearance in preterm infants. These values could help to classify preterm infants into risk groups, enabling physicians to adapt drug doses to renal clearance, thereby lowering renal adverse effects.
Previous studies on renal function in preterm infants were either based on a low number of infants7or simply pre-sented glomerular filtration rate (GFR) values as the mean and SD or SEM.8,9 Thus, these data were not an immedi-ate help to pediatricians. The aims of this study were to determine updated GFR reference values in a large cohort of very preterm infants and to present the values on easy-to-use reference curves with percentiles.
METHODS
Study Population
This multicenter cohort study took place in 3 academic French NICUs. The
study was approved by the ethics com-mittee (Comite´ de Protection des Per-sonnes de Lorraine) and funded by the French National Hospital Clinical Re-search Program (PHRC 17– 6, 2004). All infants who were aged 27 to 31 weeks of completed gestation, either inborn or outborn, were eligible throughout the study period. Infants were included within the first 48 hours of life after receiving written parental consent. Ex-clusion criteria were (1) renal failure at inclusion time, defined as plasma creatinine ⬎130 mol/L or plasma urea⬎9.1 mmol/L, and (2) severe re-nal malformation diagnosed by prena-tal ultrasound.
Renal Function Evaluation
Renal glomerular function was mea-sured at inclusion time, then once a week during the first month of life, on days 7, 14⫾1, 21⫾1, and 28⫾1 (day 0⫽day of birth). GFR was assessed by creatinine clearance measurement. The measurement method was the same in all centers. Urine was col-lected for 12 hours in a urine bag, with special care taken to avoid leaks. Blood samples for creatinine mea-surement were drawn at the end of urine collection by delicate venous puncture and immediately sent to the laboratory to avoid sample hemolysis. Creatinine was determined by a stan-dardized kinetic Jaffe´ method, per-formed on Cx5 (SYNCHRON Clinical System [Beckman Coulter, Villepinte, France]). (The Coefficient of variation was determined at 3.20% for 65mol/L and 2.15% for 470mol/L.) The body sur-face area was determined with the for-mula of DuBois and DuBois10body sur-face area⫽(weight0.425⫻height0.725)⫻ 0.007184 (height in cm and weight in kg).
Study Design and Analysis
We first reviewed the literature to de-termine all factors that could alter GFR in preterm infants. Then, we analyzed
the effect of these factors on the in-fants’ GFRs in our population. Finally, with the factors that were determined as significantly associated with glo-merular clearance in the previous step, we constructed a model to deter-mine GFR reference values for these preterm infants.
Literature Review
We performed a literature review to assess all factors that could impair re-nal function by using the PubMed data-base with the key words “renal func-tion and preterm infants” and the links of the various articles. The search was limited to articles that were published in the previous 10 years (1998 –2008) in English or French.
Effect of These Factors in Our Study Population
Step 1: From the factors published in the literature, we determined those that were significantly associated with glomerular clearance (mean GFR from day 7 to day 28) in bivariate analysis using Student’s t tests or analysis of variance (for variables with ⬎2 classes).
Step 2: The effect on GFR of each factor that reached a significance value of
P⬍.10 in this bivariate analysis was then tested, taking time into account, with a linear mixed model with re-peated measures adjusted on (1) time from day 7 to day 28, (2) the published protective or risk factor, and (3) gesta-tional age (GA) or birth weight. We checked for an interaction between these variables and time (ie, was the effect of these variables different over time?).
Step 3: Factors that reached a signifi-cance value of P ⬍ .05 in the latter analysis were considered for a new re-peated measure analysis, with GFR as a dependant variable. Independent variables were time, time-variable in-teraction, and all of the significant
tics defined as the lowest restricted maximum likelihood and the lowest Akaike information criterion.
Determination of GFR Reference Values
Step 1: Calculation of GFR reference values was based on the final model by using adjusted regression coeffi-cients, allowing removal of the risk fac-tor components of impaired glomeru-lar clearance.
Step 2: We checked the fit of our model to our population in sub-samples of various GAs or various times of measure.
Step 3: Internal validation of our model was obtained by using a bootstrap technique, generating 1000 samples.
All analyses were performed by using SAS 9.1 statistical software (SAS Insti-tute, Cary, NC).
RESULTS
General Characteristics of the Population
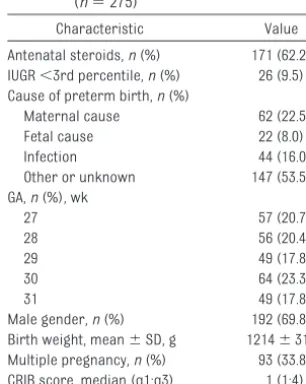
Our study population was composed of 275 infants who were aged 27 to 31 weeks’ gestation and prospectively in-cluded from October 2004 to August 2006. During this period, 66 infants of the same GAs were excluded, either be-cause they met exclusion criteria (n⫽
38) or because of lack of parental con-sent (n⫽28). General characteristics of our population are described in Ta-ble 1. The morbidity at the end of the study period (day 28) can be summa-rized as follows (some infants pre-sented with several pathologies): 82 (29.8%) infants required oxygen at 28 days of life, 56 (20.4%) presented with intraventricular hemorrhage (grades 1– 4), 29 (10.5%) presented with grades 1 to 3 necrotizing enterocolitis, and 10 (3.6%) infants had died.
Description of Renal Function
Seventeen GFR results were excluded from analysis because of nonstandard urine collection: 4 on day 7, 2 on day 14, 6 on day 21, and 5 on day 28. GFR in-creased during the first month of life (GFR mL/min per 1.73 m2, mean⫾SD; day 7: 18.5⫾12.6; day 14: 20.6⫾13.1; day 21: 22.2 ⫾ 11.7; day 28: 26.2 ⫾ 19.6). This increase was inversely cor-related with GA. Graphic presentation of GFR according to GA is presented in Fig 1.
From our literature search, we re-tained 16 articles that recognized 9 risk factors and 4 protective factors for renal function. Risk factors were cyclooxygenase (COX) inhibitors,11–16 nephrotoxic antibiotics,14,17,18prenatal treatment with magnesium sulfate,19 systemic arterial hypotension,14 hy-povolemia,14 perinatal asphyxia,14,20 septicemia,14intrauterine growth re-striction (IUGR),21,22 and congenital anomalies of the kidney and urinary tract.23Protective factors were antena-tal steroid therapy,24diuretics,25 meth-ylxanthines,26and dopamineⱕ5g/kg per min.14
Nephrotoxic antibiotics that were used in our population were aminoglu-cosides, glycopeptides, inhibitors of nucleic acid synthesis such as nitroim-idazoles, and rifampicine. We defined systemic arterial hypotension as the need for vasoactive support by dobut-amine or dopdobut-amine⬎5g/kg per min, hypovolemia when intravenous expan-sion fluids were prescribed, perinatal asphyxia as Apgar score⬍7 at 5 min-utes, IUGR as birth weight less than the third percentile for GA on Yudkin’s curve,27 and dopamine as a potential protective factor when prescribed at dosesⱕ5g/kg per min.
10 15 20 25 30 35
7 14 21 28
27 weeks GA 28 weeks GA 29 weeks GA 30 weeks GA 31 weeks GA
GFR
(m
L/
m
in/
1
.73
m²
)
Time, postnatal days FIGURE 1
GFR according to GA in the first month of life (n⫽275). Data are means⫾SEM. Characteristic Value
Antenatal steroids,n(%) 171 (62.2) IUGR⬍3rd percentile,n(%) 26 (9.5) Cause of preterm birth,n(%)
Maternal cause 62 (22.5) Fetal cause 22 (8.0) Infection 44 (16.0) Other or unknown 147 (53.5) GA,n(%), wk
27 57 (20.7)
28 56 (20.4)
29 49 (17.8)
30 64 (23.3)
31 49 (17.8)
Effect of These Factors in Our Study Population
Step 1: The impact of these factors on GFR, in our population by bivariate analysis, is presented in Table 2. No factor was significantly protective. Sig-nificant risk factors were diuretics, do-pamine, COX inhibitors, nephrotoxic antibiotics, systemic arterial hypoten-sion, septicemia, low GA, and low birth weight.
Step 2: The following were determined to be significant risk factors for lower GFR by repeated measure multivariate analysis: low birth weight, low GA, COX inhibitors, septicemia, and IUGR.
Step 3: The multivariate models were adjusted on the basis of the factors from step 2. The model that reached the lowest restricted maximum like-lihood and the lowest Akaike infor-mation criterion is described in Ta-ble 3.
Determination of GFR Reference Values
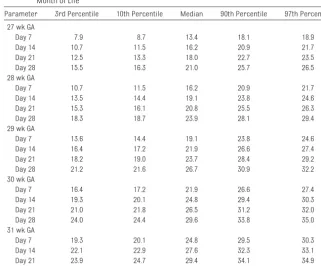
Step 1: Our model coefficients (Table 3) were finally applied to all infants who did not present with risk factors (COX
inhibitors, septicemia, IUGR). The ref-erence values for each GA are pre-sented in Table 4 and depicted in Fig 2.
Simple mathematical formulas may enable the practitioner to calculate
quickly the reference GFR median value for a determined GA (in com-pleted weeks of gestation):
● day 7: GFR⫽ ⫺63.57⫹2.85⫻GA ● day 14: GFR⫽ ⫺60.73⫹2.85⫻GA ● day 21: GFR⫽ ⫺58.97⫹2.85⫻GA ● day 28: GFR⫽ ⫺55.93⫹2.85⫻GA Step 2: GFR estimated by the model showed a good fit to GFR by measured clearance in the 146 infants who were free of the risk factors mentioned. This
TABLE 2 Bivariate Analysis of GFR in Our Population According to Protective and Risk Factors Identified in Literature (n⫽275)
Parameter n GFR, mL/min per 1.73 m2 P
Presence of the Factor
Absence of the Factor
Antenatal steroid therapy 171 17.97⫾12.98 16.90⫾11.22 .1500 Diuretics 23 13.95⫾9.44 17.94⫾12.57 .0002 Methylxanthines 233 17.39⫾12.27 19.01⫾13.08 .1700 Dopamineⱕ5g/kg per min 40 14.77⫾14.12 18.05⫾12.00 .0070 Gestational age⬍29 wk 112 13.87⫾8.02 20.27⫾14.16 ⬍.0001 Birth weight, g
500–999 75 14.18⫾8.67 ⬍.0001
1000–1499 153 17.76⫾12.97
⬎1500 47 23.12⫾13.80
COX inhibitors 74 14.91⫾9.93 18.56⫾13.03 ⬍.0001 Nephrotoxic antibiotics 223 17.13⫾12.05 19.84⫾13.71 .0200 Magnesium sulphate 11 16.38⫾13.71 17.64⫾12.33 .5100 Systemic hypotension 68 15.63⫾12.97 18.23⫾12.11 .0300 Hypovolemia 95 16.73⫾12.77 18.07⫾12.12 .0900 Perinatal asphyxia 79 17.45⫾12.88 17.65⫾12.11 .8100 Septicemia 80 15.09⫾9.44 18.75⫾13.38 ⬍.0001 CAKUT 4 12.19⫾9.87 17.66⫾12.39 .0900 IUGR 26 15.68⫾11.82 17.79⫾12.42 .0900 Data are means⫾SD. CAKUT indicates congenital anomalies of the kidney or urinary tract.
TABLE 4 Reference Values of GFR (mL/min per 1.73 m2) in Very Preterm Infants During the First
Month of Life
Parameter 3rd Percentile 10th Percentile Median 90th Percentile 97th Percentile 27 wk GA
Day 7 7.9 8.7 13.4 18.1 18.9
Day 14 10.7 11.5 16.2 20.9 21.7
Day 21 12.5 13.3 18.0 22.7 23.5
Day 28 15.5 16.3 21.0 25.7 26.5
28 wk GA
Day 7 10.7 11.5 16.2 20.9 21.7
Day 14 13.5 14.4 19.1 23.8 24.6
Day 21 15.3 16.1 20.8 25.5 26.3
Day 28 18.3 18.7 23.9 28.1 29.4
29 wk GA
Day 7 13.6 14.4 19.1 23.8 24.6
Day 14 16.4 17.2 21.9 26.6 27.4
Day 21 18.2 19.0 23.7 28.4 29.2
Day 28 21.2 21.6 26.7 30.9 32.2
30 wk GA
Day 7 16.4 17.2 21.9 26.6 27.4
Day 14 19.3 20.1 24.8 29.4 30.3
Day 21 21.0 21.8 26.5 31.2 32.0
Day 28 24.0 24.4 29.6 33.8 35.0
31 wk GA
Day 7 19.3 20.1 24.8 29.5 30.3
Day 14 22.1 22.9 27.6 32.3 33.1
Day 21 23.9 24.7 29.4 34.1 34.9
Day 28 26.9 27.3 32.4 36.6 37.9
TABLE 3 Description of the Model Retained to Determine GFR Reference Values (n⫽275)
Parameter ⫾ P
Intercept ⫺55.93⫾8.78 Time (reference:
day 28)
Day 7 ⫺7.64⫾0.97 ⬍.0001 Day 14 ⫺4.80⫾1.00
Day 21 ⫺3.04⫾0.74
GA, wk 2.85⫾0.30 ⬍.0001 COX inhibitors ⫺2.64⫾0.92 .0040 IUGR ⫺2.12⫾1.32 .1100 Sepsis ⫺1.62⫾0.89 .0700 The interaction between the stated variable and time, on GFR, did not reach significance.
was true either when the sample was considered as a whole or when analy-sis was performed in smaller sub-samples according to GA or to the time of measure (Table 5).
Step 3: The internal validation of the model with the bootstrap technique was good (mean difference between measured and estimated GFR⫽1.35 mL/min per 1.73 m2;P⫽.82).
DISCUSSION
Study’s Interest
Usefulness of Reference Values in Clinical Practice
We present both graphic depiction and tabular representation of median and 3rd, 10th, 90th, and 97th percentiles of GFR for each GA from 27 to 31 weeks, during the first month of life. This
infor-mation can be very helpful for clinicians in their everyday practice in NICUs, en-abling them to classify preterm infants according to their renal clearance and to monitor and assess renal injury. The di-agnosis of unexpectedly low GFR in these infants should lead to adapted doses of drugs that are eliminated mainly by re-nal clearance, thereby lowering the risk for adverse effects.
5 10 15 20 25 30 35 40
7 14 21 28
GFR
(m
L/m
in/1.73m
²)
Time, postnatal days
Time, postnatal days Time, postnatal days
29 weeks GA c
5 10 15 20 25 30 35
7 21
GFR
(m
L/m
in/1.73m
²)
14 28
5 10 15 20 25 30 35
7 14 21 28
GFR
(m
L/m
in/1.73m
²)
Time, postnatal days
5 10 15 20 25 30 35 40
7 14 21 28
31 weeks GA
GFR
(m
L/m
in/1.
73m²)
Time, postnatal days e
5 10 15 20 25 30 35 40
7 14 21 28
GFR
(m
L/m
in/1.73m
²)
d 30 weeks GA
FIGURE 2
Population and Methodologic Approach Used to Establish GFR Reference Values
When establishing normal values, it is common to exclude all patients who are known to present abnormal values of the particular measure studied. Consequently, the sample size on which reference values are estab-lished is low and the reference popula-tion then intrinsically differs from a standard population to which the ref-erence values are meant to be applied. Our study population is a relatively large cohort of preterm infants. We ex-cluded infants who presented with an-tenatal diagnosis of severe renal mal-formation because their treatment after birth is different from that of pre-term infants who present with other risk factors of impaired renal function. We also excluded preterm infants who already had renal impairment at birth. We did not exclude newborn infants who presented with risk factors of al-tered GFR, in a first stage. Infants who presented with risk factors were ex-cluded only from the tabular numeric depiction and the graphic application of the reference values. This achieved 2 goals: (1) sticking to the population for which the reference values are des-tined (polymorphic NICU preterm pop-ulation) and (2) increasing precision
in GFR modeling as a result of an in-creased number of infants included in the analysis and to an enhanced precision in the effect of each vari-able on GFR.
Moreover, we have established these GFR reference values in a multicenter population. The 3 French NICUs in-cluded in this study are located in dis-tant geographic areas (northeast and south of France) and have different care protocols. This provides an inter-esting diversity to our study popula-tion and will enable generalizapopula-tion of our curves to other NICUs.
Comparison of Reference Values to Published Values
The studies of Bueva and Guignard8and Gallini et al9previously provided insight on renal function in preterm newborns. The first study included a total of 66 pre-term and pre-term stable newborns, and the second included 83 newborns who were ⬍32 weeks’ GA and presented with no risk factors of renal function impair-ment. Both studies presented GFR as means and SD or SEM but not in percen-tiles. To our knowledge, our study is the first to assess reference values of GFR for very preterm newborns in a large co-hort of 275 infants. Advantages of our study are the relatively large cohort and the presentation of preterm infants’ GFR
reference values during a 1-month span in graphs with the median and percen-tiles, allowing the level of GFR impair-ment to be evaluated quickly.
Limitations
A limitation of our study is the time be-tween measurement points in longitu-dinal analysis. Although GFR is a dy-namic function, it is not possible to measure it continuously to ascertain its kinetic. Previous data described the progressive increase of GFR from the first week of life.8,9Thus, weekly mea-sures seemed sufficient to draw rele-vant graphs from day 7 to day 28. An-other limitation is the measurement method. The gold standard to deter-mine GFR is inulin clearance,28but the need for volunteer bladder voiding renders it impossible in newborns. Creatinine clearance is an accepted, feasible measurement in the preterm infant.29 This method is used in all NICUs. Thus, any bias that this technique may induce does not have an impact on the relevance of our reference values. Finally, our reference values did not undergo external validation. External validation would involve performing venipuncture in many preterm new-borns, solely for the purpose of check-ing animation data. Because external validation was not possible in the NICU patients, we ascertain that that the ref-erence values of estimated GFR were suited for each GA and each measure-ment point. We also performed an internal validation by a bootstrap method on the whole population, with no fewer than 1000 different sample combinations. These precautions help to demonstrate the validity of our results.
CONCLUSIONS
The reference curves and tables pre-sented are based on a multicenter co-hort. Statistical modeling of GFR al-lowed prediction of normal GFR values for infants of a given GA by using a
sim-TABLE 5 Comparison Between GFR (mL/min per 1.73 m2) Observed and Estimated in Infants
Without Risk Factors (COX Inhibitors, Septicemia, IUGR)
Parameter n GFR, Mean⫾SD Pfor Fit Test Between Observed and Calculated GFR Observed in the
Population
Estimated With the Model
Whole population 146 23.23⫾12.35 24.04⫾4.69 .39 Time
Day 7 142 19.95⫾9.30 20.27⫾3.79 .76 Day 14 115 22.11⫾14.91 23.11⫾3.79 .58 Day 21 100 24.64⫾10.88 24.87⫾3.79 .86 Day 28 92 27.66⫾12.66 27.91⫾3.79 .86 GA, wk
27 19 16.25⫾8.00 17.15⫾2.79 .53 28 19 16.27⫾5.42 20.00⫾2.79 .13 29 28 21.64⫾10.97 22.85⫾2.78 .46 30 45 26.60⫾15.16 25.70⫾2.78 .19 31 35 28.60⫾10.04 28.55⫾2.78 .97
P⬍.05 means that the estimated GFR differs significantly from the measured GFR.
gists who currently work in NICUs to adapt drug doses or to determine risk groups in retrospective or prospective studies that measure GFR. Application of these GFR reference values in NICUs
ACKNOWLEDGMENTS
This study was funded by the French National Hospital Clinical Research Program (PHRC 17– 6, 2004).
co-investigator centers of Marseille and Dijon. We are indebted to Henryse Legagneur for the analysis of the bio-logical measurements used in this study.
REFERENCES
1. Barker D. The midwife, the coincidence, and the hypothesis. BMJ. 2003;327(7429): 1428 –1430
2. Brenner BM, Garcia DL, Anderson S. Glomer-uli and blood pressure. Less of one, more the other?Am J Hypertens.1988;1(4 pt 1): 335–347
3. Luyckx VA, Brenner BM. Low birth weight, nephron number, and kidney disease. Kid-ney Int Suppl.2005;(97):S68 –S77 4. Guignard JP. Nephron deficit: causes and
late consequences[in French].Arch Pedi-atr.2005;12(6):726 –727
5. Vehaskari MV, Woods LL. Prenatal program-ming of hypertension: lessons from experi-mental models.J Am Soc Nephrol. 2005; 16(9):2545–2556
6. Zandi-Nejad K, Luyckx VA, Brenner BM. Adult hypertension and kidney disease: the role of fetal programming.Hypertension.2006; 47(3 pt 2):502–508
7. Sonntag J, Prankel B, Waltz S. Serum creat-inine concentration, urinary creatcreat-inine ex-cretion and creatinine clearance during the first 9 weeks in preterm infants with a birth weight below 1500 g.Eur J Pediatr.1996; 155(9):815– 819
8. Bueva A, Guignard JP. Renal function in pre-term neonates.Pediatr Res. 1994;36(5): 572–577
9. Gallini F, Maggio L, Romagnoli C, Marrocco G, Tortorolo G. Progression of renal func-tion in preterm neonates with gestafunc-tional ageⱕ32 weeks. Pediatr Nephrol.2000; 15(1–2):119 –124
10. DuBois D, DuBois EF. A formula to estimate the approximate surface area if height and weight be known.Arch Intern Medicine.
1916;17:863– 871
11. Chamaa NS, Mosig D, Drukker A, Guignard JP. The renal hemodynamic effects of
ibu-profen in the newborn rabbit.Pediatr Res.
2000;48(5):600 – 605
12. Drukker A, Guignard JP. Ibuprofen-lysine for closure of patent ductus arteriosus. Acta Paediatr.2001;90(4):465– 466
13. Drukker A, Guignard JP. Renal aspects of the term and preterm infant: a selective up-date.Curr Opin Pediatr.2002;14(2):175–182 14. Guignard JP. The adverse renal effects of prostaglandin-synthesis inhibitors in the newborn rabbit. Semin Perinatol.2002; 26(6):398 – 405
15. Pre´vot A, Mosig D, Martini S, Guiganrd JP. Nimesulide, a cyclooxygenase-2 preferen-tial inhibitor, impairs renal function in the newborn rabbit. Pediatr Res.2004;55(2): 254 –260
16. Allegaert K, Vanhole C, de Hoon J, et al. Non-selective cyclo-oxygenase inhibitors and glomerular filtration rate in preterm neo-nates. Pediatr Nephrol. 2005;20(11): 1557–1561
17. Tugay S, Bircan Z, Caglayan C, Arisoy AE, Gokalp AS. Acute effects of gentamicin on glomerular and tubular functions in pre-term neonates. Pediatr Nephrol. 2006; 21(10):1389 –1392
18. Anderson BJ, Allegaert K, Van der Anker JN, Cossey V, Holford NH. Vancomycin pharma-cokinetics in preterm neonates and the pre-diction of adult clearance.Br J Clin Pharma-col.2007;63(1):75– 84
19. Brenna S, Thonney Viani M, Drukker A, Guig-nard JP. Effect of magnesium sulfate on kid-ney function in the newborn rabbit.Biol Ne-onate.1998;74(6):451– 456
20. To´th-Heyn P, Drukker A, Guignard JP. The stressed neonatal kidney: from pathophysi-ology to clinical management of neonatal vasomotor nephropathy. Pediatr Nephrol.
2000;14(3):227–239
21. Giapros V, Papadimitriou P, Challa A, An-dronikou S. The effect of intrauterine growth retardation on renal function in the first two months of life.Nephrol Dial Trans-plant.2007;22(1):96 –103
22. Allegaert K, Anderson BJ, van des Anker JN, Vanhaesebrouck S, de Zegher F. Renal drug clearance in preterm neonates: relation to prenatal growth. Ther Drug Monit.2007; 29(3):284 –291
23. Martini S, Guignard JP. Diagnosis and man-agement of urinary tract dilatations de-tected in utero.Rev Med Suisse Romande.
2002;122(12):619 – 624
24. Amador-Licona N, Guizar-Mendoza JM, Maciel-Miranda JA, Romero-Gutierrez G. An-tenatal dexamethasone and renal vascular resistance in preterm infants.J Paediatr Child Health.2007;43(4):303–306
25. Brion LP, Soll RF. Diuretics for respiratory distress syndrome in preterm infants. Co-chrane Database Syst Rev. 2008;(1): CD001454
26. Pre´vot A, Mosig D, Rijtema M, Guignard JP. Renal effects of adenosine A1-receptor blockade with 8-cyclopentyl-1,3-dipropylxanthine in hypoxemic newborn rabbits.Pediatr Res.2003;54(3): 400–405
27. Yudkin PL, Aboualfa M, Eyre JA, Redman CW, Wilkinson AR. New birthweight and head cir-cumference centiles for gestational ages 24 to 42 weeks.Early Hum Dev. 1987;15(1): 45–52
28. Deschaux M. Renal functional explorations in children. [in French].Encycl Med Chir Pediatrie.4-083-J-10, 1994
29. Guignard JP, Drukker A. Why do preterm newborns have a high plasma creatinine?
DOI: 10.1542/peds.2009-1426 originally published online April 5, 2010;
2010;125;e1186
Pediatrics
Guillemin
Rachel Vieux, Jean-Michel Hascoet, Dana Merdariu, Jeanne Fresson and Francis
Glomerular Filtration Rate Reference Values in Very Preterm Infants
Services
Updated Information &
http://pediatrics.aappublications.org/content/125/5/e1186
including high resolution figures, can be found at:
References
http://pediatrics.aappublications.org/content/125/5/e1186#BIBL
This article cites 25 articles, 3 of which you can access for free at:
Subspecialty Collections
http://www.aappublications.org/cgi/collection/nephrology_sub
Nephrology
sub
http://www.aappublications.org/cgi/collection/fetus:newborn_infant_
Fetus/Newborn Infant following collection(s):
This article, along with others on similar topics, appears in the
Permissions & Licensing
http://www.aappublications.org/site/misc/Permissions.xhtml
in its entirety can be found online at:
Information about reproducing this article in parts (figures, tables) or
Reprints
http://www.aappublications.org/site/misc/reprints.xhtml
DOI: 10.1542/peds.2009-1426 originally published online April 5, 2010;
2010;125;e1186
Pediatrics
Guillemin
http://pediatrics.aappublications.org/content/125/5/e1186
located on the World Wide Web at:
The online version of this article, along with updated information and services, is
by the American Academy of Pediatrics. All rights reserved. Print ISSN: 1073-0397.