A Study on Data Mining with Big Data
B. Zakia Bano
1, Dr. K. Pavan Kumar
21
M.Tech student, Dr K V Subba reddy college of Engineering for women,
2
Professor, Dr K V Subba reddy college of Engineering for women,
Kurnool, Andhra Pradesh, India.
Abstract- Big data is the term for a collection of data sets which are large and complex, it contain structured andunstructured both type of data. Data comes from everywhere, sensors used to gather climate information, posts tosocial media sites, digital pictures and videos etcThis data is known as big data. Useful data can be extracted fromthis big data with the help of data mining.
I. INTRODUCTION
The term ’Big Data’ appeared for first time in 1998 in aSilicon Graphics (SGI) slide deck by John Mashey with thetitle of ”Big Data and the Next Wave of InfraStress” [4]. BigData mining was very relevant from the beginning, as thefirst book mentioning ’Big Data’ is a data mining book that appeared also in 1998 by Weiss and Indrukya [10] . However,the first academic paper with the words ’Big Data’ in thetitle appeared a bit later in 2000 in a paper by Diebold [3].The origin of the term ’Big Data’ is due to the fact thatwe are creating a huge amount of data every day. UsamaFayyad [6] in his invited talk at the KDD BigMine’12 Workshop presented amazing data numbers about internet usage,among them the following: each day Google has more than1 billion queries per day, Twitter has more than 250 miliontweets per day, Facebook has more than 800 million updatesper day, and YouTube has more than 4 billion views perday.
The data produced nowadays is estimated in the orderof zettabytes, and it is growing around 40% every year.Anew large source of data is going to be generated from mobiledevices, and big companies as Google, Apple, Facebook, Yahoo, Twitter are starting to look carefully to this data to finduseful patterns to improve user experience.
In Big data the information comes from multiple, heterogeneous, autonomous sources with complexrelationship and continuously growing. upto
2.5 quintillion bytes of data are created daily and 90 percent data inthe world today were produced within past two years [1].for example Flicker, a public picture sharing site,where in an average 1.8 million photos per day are receive from February to march 2012[5].this shows that it isvery difficult for big data applications to manage, process and retrieve data from large volume of data usingexisting software tools. It’s become challenge to extract knowledgeable information for future use [7]. Thereare different challenges of Data mining with Big Data. We overlook it in next section. Currently Big Dataprocessing depends upon parallel programming models like MapReduce, as well as providing computingplatform of Big Data services. Data mining algorithms need to scan through the training data for obtaining thestatistics for solving or optimizing model parameter. Due to the large size of data it is becoming expensive toanalysis data cube. The Map-Reduce based approach is used for data cube materialization and mining overmassive datasets using holistic (non algebraic) measures like TOP-k for the top-k most frequent queries. MRCube approach is used for efficient cube computation.We need new algorithms, and new tools to deal with all ofthis data. Doug Laney was the first one in talking about3 V’s in Big Data management:
• Volume: there is more data than ever before, its sizecontinues increasing, but not the percent of data thatour tools can process.
• Variety: there are many different types of data, as text,sensor data, audio, video, graph, and more. • Velocity: data is arriving continuously as streams ofdata, and we are interested in obtaining useful information from it in real time.
Nowadays, there are two more V’s:
• Value: business value that gives organization a compelling advantage, due to the ability of making decisions based in answering questions that were previously considered beyond reach.
These different characteristics of Big Data make it challenge for discovering useful information orknowledge from it. After analyzing and research challenge form a three tier structure framework to mentiondifferent challenges at different tier, as shown in fig.1.
Fig.1. A Big Data processing Framework The challenges at tier I focus on low-level data accessing and arithmetic computing procedures,Challenges on information sharing and privacy. Big Data often stored on different location and it is continuouslygrowing that’s why an effective computing platform to take distributed large scale data storage intoconsideration for computing. Tier II concentrate on high-level semantics, application domain knowledge fordifferent applications of big data and the user privacy issues. This information provides benefits to Big dataaccess but also add a technical barriers to Big Data access (Tier I) and mining algorithms (Tier II). The Outmosttier is tier III which challenges the actual mining algorithms.
At this tier III the mining challenges concentrate onalgorithm designs in tacking the difficulties which is raised by the big data volumes, distributed datadistribution, complex and dynamic characteristics.Tier III contains three stages. In first stage sparse, heterogeneous, uncertain, incomplete andmultisource data is preprocessed by data fusion technique. In second stage after preprocessing stage complexand dynamic data are mined. Third stage is
for local learning and model fusion, where the global knowledge isobtained by local learning and model fusion is tested and the relevant information is feedback to preprocessingstage.
II. BIG DATA CHARACTERISTICS
A. HACE Theorem.
Big Data starts with large-volume, heterogeneous, autonomous sources with distributed and decentralized control, andseeks to explore complex and evolving relationships among data.These characteristics make it an extreme challenge fordiscovering useful knowledge from the Big Data. In a naïve sense, we can imagine that a number of blind men are tryingto size up a giant Camel, which will be the Big Data in this context. The goal of each blind man is to draw a picture (orconclusion) of the Camel according to the part of information he collects during the process. Because each person‟s viewis limited to his local region, it is not surprising that the blind men will each conclude independently that the camel“feels” like a rope, a hose, or a wall, depending on the region each of them is limited to. To make the problem even morecomplicated, let us assume that the camel is growing rapidly and its pose changes constantly, and each blind man mayhave his own (possible unreliable and inaccurate) information sources that tell him about biased knowledge about thecamel (e.g., one blind man may exchange his feeling about the camel with another blind man, where the exchangedknowledge is inherently biased). Exploring the Big Data in this scenario is equivalent to aggregating heterogeneousinformation from different sources (blind men) to help draw a best possible picture to reveal the genuine gesture of thecamel in a real-time fashion. Indeed, this task is not as simple as asking each blind man to describe his feelings about thecamel and then getting an expert to draw one single picture with a combined view, concerning that each individual mayspeak a different language (heterogeneous and diverse information sources) and they may even have privacy concernsabout the messages they deliberate in the information exchange process.The term Big Data literally concerns about datavolumes, HACE theorem suggests that the key characteristics of the Big Data are
the Big Data is the hugevolume of data represented by heterogeneous and diverse dimensionalities. This huge volume of data comes from varioussites like Twitter,Myspace,Orkut and LinkedIn etc.
Decentralized control:- Autonomous data sources with distributed and decentralized controls are a main characteristicof Big Data applications. Being autonomous, each data source is able to generate and collect information withoutinvolving (or relying on) any centralized control. This is similar to the World Wide Web (WWW) setting where eachweb server provides a certain amount of information and each server is able to fully function without necessarily relyingon other servers
Complex data and knowledge
associations:-Multistructure,multisource data is complex data, Examples of complexdata types are bills of materials, word processing documents, maps, time-series, images and video.Such combined characteristics suggest that Big Data require a “big mind” to consolidate data for maximum values.
III. SYSTEM AND METHODOLOGY
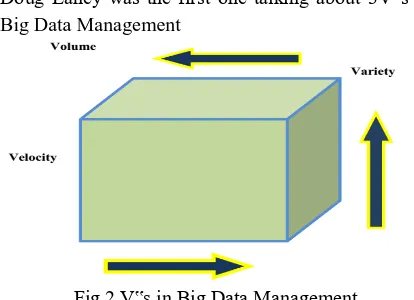
Doug Laney was the first one talking about 3V‟s in Big Data Management
Fig 2 V‟s in Big Data Management
Volume: The amount of data. Perhaps the characteristic most associated with big data, volume refers to the massquantities of data that organizations are trying to harness to improve decision-making across the enterprise. Data volumescontinue to increase at an unprecedented rate.
Variety: Different types of data and data sources. Variety is about managing the complexity of multiple data types,including structured, semi-structured and unstructured data. Organizations need to integrate and analyze data from acomplex array of both traditional and non-traditional information sources, from within and outside the enterprise. Withthe
explosion of sensors, smart devices and social collaboration technologies, data is being generated in countless forms,including: text, web data, tweets, audio, video, log files and more.
Velocity: Data in motion. The speed at which data is created, processed and analyzed continues to accelerate.
Generally, data mining (sometimes called data or knowledge discovery) is the process of analyzing data from differentperspectives and summarizing it into useful information - information that can be used to increase revenue, cuts costs, orboth. Technically, data mining is the process of finding correlations or patterns among dozens of fields in large relationaldatabase.Data mining as a term used for the specific classes of six activities or tasks as follows: 1. Classification
2. Estimation 3. Prediction 4. Association rules 5. Clustering 6. Description
A. Classification:Classification is a process of generalizing the data according to different instances. Several major kinds of classificationalgorithms in data mining are Decision tree, k-nearest neighbor classifier, Naive Bayes, Apriori and AdaBoost.Classification consists of examining the features of a newly presented object and assigning to it a predefined class. Theclassification task is characterized by the well-defined classes, and a training set consisting of reclassified examples.
B. Estimation: Estimation deals with continuously valued outcomes. Given some input data, we use estimation to come up with avalue for some unknown continuous variables such as income, height or credit card balance.
C. Prediction: It‟s a statement about the way things
will happen in the future , often but not always based on experience or knowledge.Prediction may be a statement in which some outcome is expected.
D.Association Rules: An association rule is a rule which implies certain association relationships among a set of objects (such as “occurtogether” or “one implies the other”) in a database.
every other problem of this kind,it deals with finding a structure in a collection of unlabeled data.
The Big Data phenomenon is intrinsically related to theopen source software revolution. Large companies as Facebook, Yahoo!, Twitter, LinkedIn benefit and contribute working on open source projects. Big Data infrastructure dealswith Hadoop, and other related software as:
• Apache Hadoop [2]: software for data-intensive distributed applications, based in the MapReduce programming model and a distributed file system calledHadoop Distributed Filesystem (HDFS). Hadoop allows writing applications that rapidly process largeamounts of data in parallel on large clusters of computenodes. A MapReduce job divides the input datasetinto independent subsets that are processed by maptasks in parallel. This step of mapping is then followed by a step of reducing tasks. These reduce tasksuse the output of the maps to obtain the final resultof the job.
• Apache Hadoop related projects [11]: Apache Pig, ApacheHive, Apache HBase, Apache ZooKeeper, Apache Cassandra, Cascading, Scribe and many others.
• Apache S4 [8]: platform for processing continuousdata streams. S4 is designed specifically for managingdata streams. S4 apps are designed combining streamsand processing elements in real time.
• Storm [9]: software for streaming data-intensive distributed applications, similar to S4, and developed byNathan Marz at Twitter.
IV. SIMULATION RESULTS
Fig. 3
Fig. 4
Fig .5
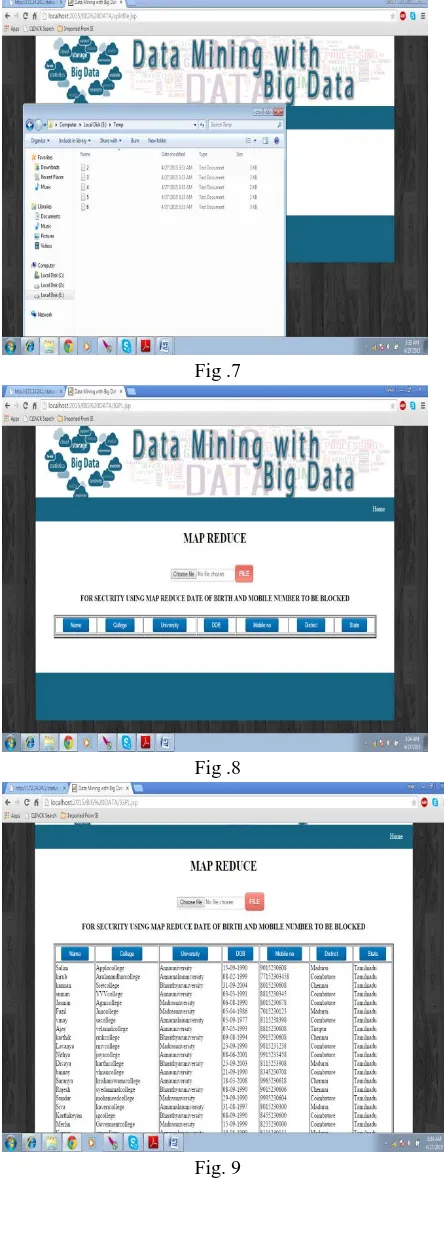
Fig .7
Fig .8
Fig. 9
Fig.10
V. CONCLUSION
In real-world applications managing and mining Big Data is Challenging task, As the data concernlarge in a volume, distributed and decentralized control and complex. There are several challenges at data,model and system level. We need computing platform to handle this Big Data. The MapReduce framework isone of the most important parts of big data processing, and batch oriented parallel computing model.
REFERENCES
[1]. Xindong Wu, Fellow, IEEE, Xingquan Zhu, Gong-Qing Wu, and Wei Ding” Data Mining with Big Data” ieee transactionson knowledge and data engineering, vol. 26, no. 1, january 2014.
[2] Apache Hadoop, http://hadoop.apache.org. [3] F. Diebold. ”Big Data” Dynamic Factor Models forMacroeconomic Measurement and Forecasting. Discussion Read to the Eighth World Congress of the Econometric Society, 2000.
[4] F. Diebold. On the Origin(s) and Development of theTerm ”Big Data”. Pier working paper archive, PennInstitute for Economic Research, Department of Economics, University of Pennsylvania, 2012. [5]. F. Michel, “How Many Photos Are Uploaded to
Month?”http://www.flickr.com/photos/franckmichel/ 6855169886/, 2012.
[6] U. Fayyad. Big Data Analytics: Applications and Opportunities in On-line Predictive Modeling. http://big-data-mining.org/keynotes/#fayyad, 2012. [7]. Hadoop. http://hadoop.apache.org/.
[8] L. Neumeyer, B. Robbins, A. Nair, and A. Kesari.S4: Distributed Stream Computing Platform. In ICDMWorkshops, pages 170–177, 2010.
[9] Storm, http://storm-project.net.
[10] S. M. Weiss and N. Indurkhya. Predictive data mining:a practical guide. Morgan Kaufmann Publishers Inc.,San Francisco, CA, USA, 1998. [11] P. Zikopoulos, C. Eaton, D. deRoos, T. Deutsch,and G. Lapis. IBM Understanding Big Data: Analytics for Enterprise Class Hadoop and Streaming Data.McGraw-Hill Companies,Incorporated, 2011.
BIODATA Author
B.Zakia Bano presently pursuing her M.Tech (CSE) in Dr K V Subba reddy college of Engineering for women, Kurnool, Andhra Pradesh, India.
CoAuthor