Big Data Processing on Clustered Computers –
Application of Simulated Annealing Algorithm
Techniques
1
Venkata SanyasiRao Sasipalli; 2 S.Murthy Naidu Kothuri; 3 Krishnam Raju Gottumukkala
1
Graduate School of Advanced Sciences of Matter, Hiroshima University, Higashi-Hiroshima, Hiroshima, Japan
2, 3
Center for Excellence in Computer Technology, Visakhapatnam City, AP 530001, India
Abstract – The inevitable accumulation of data leads to Big Data problems. Receive and transmit the data assumes high speed wired or wireless communications technology and processing environment. With the advancements of wired and wireless technologies, data transceiver problems are addressed, however, data processing is a challenging part in Big Data. There is a need to find data process simulation techniques for higher volumes of data to cope with the advancements of device level technologies. In this paper, a large-scale data-intensive all-to-all comparison-like problem is addressed with most widely used Simulated Annealing Algorithm (SAA) techniques, implemented in distributed or clustered systems to process data sets among several processor nodes. Results show that the techniques of SAA with Custom Datasets suit well on distributed network of processor nodes irrespective of wired or wireless to process data at large-scale.
Keywords – Big Data, Communication Speed, Terahertz, Data Processing, Optimization
1. Introduction
The inevitable accumulation of different types of data is becoming a big problem, and researchers recognized the immediate need to address this issue as Big Data problem. The underlying device technology advancement forced this Big Data problem to grow rapidly. The devices that support high data-rates are getting cheaper and aggressively pushed into markets, that in turn becoming standard requirements. For example, the high data-rate (1Gbps~50Gbps) wireless link has become an emerging need for big-data communication such as next generation Wi-Fi as well as on-chip I/Os. It requires the design of Terahertz communication (60GHz, 140GHz, 280GHz, etc.,). To cope with the advancements of device level technology, the problem of Big Data must be addressed in different perspectives: such as accumulation, classification and processing. Big data by name can suggest to a meaning “data in big volumes”. For Volumatic communication, we certainly we need Terahertz technology. But, it has more things to consider, than this simple big volume meaning. Besides Volume, there are other prominent aspects of big data which are Variety, Velocity, Viability and Value [1].
Volume: The volume of big data is data collected or created that grows exponentially day to day. The data accumulated everyday amounts to 2.5 quintillion bytes, and much of this data in the world today has been created in last few years alone. One can imagine at what rate the data can explode in the coming years. This volumetric measure adds load to the processors.
Variety: Data produced in volumes from different sources is not of the same type. Some data is structured, some unstructured and much is raw data, which are very difficult to be handled by traditional systems. Optimal algorithms are very necessary to process the big-data.
Velocity: With the device level speeds, data accumulation is also speedy. This concept indicates the speed at which the data generated and become historical. Terahertz technology makes more comfortable to tranceive data in wireless environment. Big data can handle the incoming and outgoing data rapidly. The velocity also adds load to the processors.
Improper definitions of variability can cause the optimization process longer and adds load to the processors.
Value: Business trend basically depends on value of data. Users query the data store to find the business trends and change their strategies. Value aspect of big data is so critical as all business entities are keen in improving their value-added services to protect existing and attract new customers. Customer attitudes and trends in the market are to be analyzed. The open-to-all big data helps create transparent and functional analysis. Online / offline analysis and decision making are based on the analysis of data in different locations in the cluster environment. This adds load to the processors.
The advantages of leveraging big data are real and oftentimes far-reaching, that is why so many organizations have adopted big data for their own operations [2]. But that doesn’t mean big data has prepared a paved road to the future. The far more essential task is to reduce load to the processors that handle big data issues. All-to-all comparison poses load imbalances. Hadoop data distribution strategies are used in general, but not sufficient due to Hadoop’s fundamental basis in the MapReduce computing model. Suitable algorithms are to be used to address the optimal utilization processor nodes to handle the data especially in a cluster environment. Though there are many other Big data issues [3], for the implementation of algorithms, first task is the classification / categorization of big data.
2. Data Classification
Classification of big data helps to simplify the process for implementing algorithms. Irrelevant types of data coming from different sources, and diversity of data fields, etc., are main issues in classification. The important classes of Big Data are: Data Source, Data Formats, Data Storing, Data Organizing, Data Processing and Data Querying.
Since our focus is on Data Processing, other classes such as Data Sourcing, Data Organizing and Data Querying are assumed to be well in order and suitable, for the process implementation.
Data Formats: Raw data, Unstructured data, Partially Structured data and Structured; and Data Storing: Images, Graphs, Documents and Key Values Storing. Key Values Store is a way of storing application's data with null schema. It doesn't require a static data model. Unique keys are used to represent values stored in it. This process is intrinsic in our implementation.
Data formats and storing influences the load balancing in processing. Therefore, we limit our attention to structured data and local storing of any data type.
3. Formulation and Implementation
3.1 Problem Formulation
High-end platforms that support iterative and interactive analysis for data-intensive computing, and provide large amounts of memory per computer-server can accelerate the rate of data discovery [4]. Such platforms provide support for running portable legacy applications on fast hardware and thereby contribute in reducing the time-to-results.
All-to-all comparison is simply a specific Cartesian product of a data set. We must feed the Cartesian product and the data set [5]. Solving this kind of problems in distributed systems, processor capability based approach is to be considered.
Now the problem can be formulated as: Given a number jobs, number of slave nodes or processor nodes in distributed system and the capability of each processor node. Find the optimal distribution or allocation of the jobs to the processor nodes, which process the datasets fed to them.
The jobs can be converting unstructured data to structured data, or all-to-all comparison, or Isolating a certain type of datasets by Data Querying or any related. In general, the data shall be processed at each node with the given constraints.
Some example allocations of Jobs to Nodes are, let the number of jobs N = 6 and available processors M = 3 then, some possible distribution matrices can be written as below.
processor nodes sequentially. But this is what we must find an optimal distribution or allocation of jobs among available processors. Note we did not utilize the objective function (information of Time taken for ith job in jth processor), this is crucial point and we minimize the total time. This is related to the capability of each processor to execute a certain job type, such as structuring data, isolating data by querying, or all-to-all comparison, etc.
Let us introduce capability parameters (also considered as load parameters) as
and since T(i, j) can be defined as set of M arrays as
and define
then, T(i, j) can be represented as
T(i, j) is now a function of Node Capability and Job Randomness. Now we have to create a likely distribution pattern, which can be an initial input to simulated annealing algorithm as Initial Distribution Pattern (IDP). The IDP can be as random as possible in terms of number of jobs and number of processor nodes.
3.1 Implementation
A cluster of multiple processors and disks is defined using high-speed communication network to allow the data to be portioned among the available computing resources and processed independently to achieve performance and scalability based on (1) the amount of data, (2) node capability, (3) definition of randomness. This cluster is parallel and distributed system consisting of M inter-connected stand-alone computers working together as a single integrated computing resource. This kind of distributed or clustered system with commodity
resources have been widely used in processing data-intensive problems.
In our implementation, Matlab data structure of
Simulated Annealing Algorithm such as
“simulannealbnd”, and “Custom DataType” techniques are used.
Figure 1: Cluster Computers Setup
We have chosen below data Nodes M = 10 and
Number of Jobs N = {100, 200, 300, 400, 500, 600}
Define A = random(1, N)
= {10, 7, 2, 5, 3, 4, 1, 6, 4, 3}, small values mean more powerful or less process time.
Hence T(i, j) is defined.
IDP is defined as a random matrix based the above M, N values. The objective function T(i, j) is the total times required to execute the given Jobs on available Nodes. We minimized the total time while balancing the loads suitably.
Input Data
Results R O O T
N O D E
Slave Node 1
Slave Node 2
Slave Node 3
4. Results
Assignment of jobs is a major step in simulation to optimize the total time while balancing the loads on each processor node that process the data. The results are calculated for 100, 200, 300, 400, 500, 600 job counts. Each experiment reveals Best Point Iteration and Best Objective Function values.
Graph 1: Best Point of Iteration
Trend line is drawn with cubic polynomial fit, which shows close approximation to the real data. We can observe that the best point of iteration decreases with job count increase.
Graph 2: Best Objective Function Values
Trend line is drawn with linear curve fit, which shows the best objective function values are linearly increasing with the increase of job count.
Graph 3: Utilization of Nodes at each Step Count
For a given 100 jobs, number of processors that are engaged at each computation step are show in this Graph.
Graph 4: Job Count and Step Count Behavior
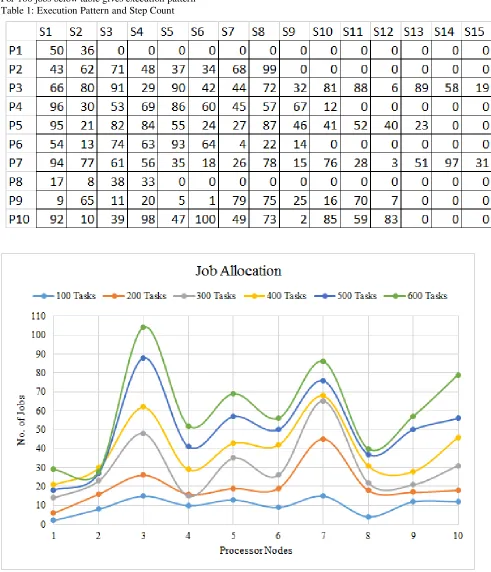
For 100 jobs below table gives execution pattern Table 1: Execution Pattern and Step Count
Graph 5: Jobs allocation
5. Conclusions
From the Table 1 and Graph 3, we can note that the jobs of datasets processing are allocated to the nodes in sequential order, but more jobs to powerful nodes. And, we can observe from the graphs in Graphs 1, 2 and 4 that for the given configuration of parameters, the pivotal region is between job counts of 300 and 400 but bit near to 400. The consequence of this behavior is clearly seen in Graph 5, that the job allocations in the cases of 100 to 300 are non-uniform but from 400 onwards the curves are uniformly shaped between node 2 to 9. This means that these techniques are suitable for handling data-intensive problems with higher counts of jobs for particular process type. As with advancements of underlying Terahertz communication devices, the techniques for data processing presented here proved that the data-intensive problems can be addressed effectively at the application level restructuring the datasets to higher job counts.
These techniques can be applied to the cases where datasets are non-homogeneous, by taking two-step implementation approach. Since the core techniques are identified and these can be applied to pre-process phase as well.
Acknowledgments
Authors are grateful to Hiroshima University and C.E.C.Tech., for its collaborative work and acknowledge sincere thanks for the support.
References
[1] S. Justin Samuel et. al. (May 2015) “A Survey on Big Data and Its Research Challenges”, ARPN Journal of Engineering and Applied Sciences, Vol. 10 No. 8. [2] Sheetal Singh, Vipin Kumar Rathi, et. al., (Aug 2015)
"Big Data and Cloud Computing: Challenges and Opportunities", IJIET Vol. 5, Issue 4, pp. 117 – 125 [3] Pedro Caldeira Neves, Bradley Schmerl, et. al. (Oct
2016) “Big Data in Cloud Computing: Features and Issues”, ACME, Carnegie Mellon University
[4] Adam Carter, (Jul 2013) "Data Intensive Computing", APARSEN Advanced Practitioners Course, Glasgow [5] Zhang, Yi-Fan, et. al., (2015) "Distributed Computing
of all-to-all Comparison Problems in Heterogeneous Systems", Proceedings of 41st Conf., of IEEE Industrial Electronics Society, Yokohama
VSRao Sasipalli currently working on Analog Circuits, he worked on applications of computer technology to engineering problems. He received M.Sc., M.Phil., Mathematics from Andhra University, India 1985 and 1990, and M.Sc. Nat., from Kaiserslautern University, Germany 1993 and Dr.Engg., information engineering from Hiroshima University, Japan 1998. Passionate about computer technology and interested in underlying device development to user-interactive application development. With encouragement from colleagues Sasipalli started international collaboration research with various universities around the world. Believes in international collaborations towards a global leader.
S.Murthy Naidu Kothuri, Ex-scientist, NRSA, India. Research in remote sensing, computer technology for engineering applications. Bachelor, Masters and Doctor of Philosophy from Andhra University in Biology.