Abstract—Distribution system should be operated in minimum active and reactive power loss condition for efficient distribution and improvement of reliability of the system. In this paper a new voltage stability indicator is presented to measure voltage stability level of network. An IEEE 30-bus system has reconfigured here for minimization of total system losses and enhancement of voltage stability. Reconfiguration is a modern methodology of modification the topology structure of network which is done here by changing the switching status of additional power lines with the existing network. Considering the different switching combination, configuration which generates minimum value of proposed Equivalent voltage stability indicator (VSIeqv), is selected as optimal network configuration. Simulation results have shown that after reconfiguration voltage stability is improved significantly. From different case studies with random selection of loads, satisfactory results of voltage stability indicators have been obtained to realize the efficient distribution system properly. A strong connection between VSIeqv and active and reactive losses is established in which decreasing value of the VSIeqv indicates reduction of total distribution losses. So, improved distributions can possible reconfiguring the network using developed VSIeqv without any additional voltage regulation hardware installation.
Index Terms—Equivalent two-bus system, switching option, equivalent voltage stability indicator, active and reactive losses.
I. INTRODUCTION
Distribution system reconfiguration can be considered as an operational problem and it is realized by changing the status of sectionalizing and tie switches. Under normal operating conditions, the main aim of network reconfiguration [1, 3, 11] is reduction of system losses and improvement of stability of the system. The reduction of system losses have taken into account very seriously due to the high cost of electrical energy. Besides economic considerations, by minimizing the power losses, voltage stability of the system can be increased and reliability of the system can be maximized [1, 2, 7, 9]. Voltage stability of a network damages when the power system faces the problem of heavy transmission line loading and insufficient local reactive power supply. The level of voltage stability of a system can be measured using Equivalent voltage stability indicator (VSIeqv). Improvement of voltage stability
Manuscript received April 5, 2012; revised May 1, 2012.
P. Kayal and T. Dutta are with the Department of Electrical Engineering, Fututre Institute of Engineering and Management, Kolkata, India (e-mail: [email protected], [email protected]).
C. K. Chanda is with the Department of Electrical Engineering, Bengal Engineering and Science University, Howrah, India (e-mail: [email protected]).
involves study of different tie and sectionalizing switching combinations. The best switching option can be implemented by choosing each successive operation that minimizes the value of voltage stability indicator [4, 6, 10] most, without violating the constraints such as voltage constraints, capacity constraints of line and transformers and reliability constraints.
In the last few years, interest has grown on distribution system reconfiguration for improvement of voltage stability with many publications where new heuristic algorithms were applied to the problem given in [5, 8]. In network reconfiguration, a solution method consists of a search over radial configuration for load balancing and loss minimization has proposed by Baran and Wu [11]. Many techniques have been suggested to find the suitable pair of switches in order to achieve optimal configuration of interconnected network. A new approach of switching search has given by M. A. Kashem et al for enhancement of voltage stability [1, 5]. M. A. Kashem et al have used a voltage stability index derived by Jasmon and Lee for realization of voltage stability [7, 8].
In this paper Equivalent voltage stability indicator has been derived. The developed voltage stability indicator is then applied to different switching combination of the network to assess voltage stability after reducing them into their corresponding equivalent two-bus system. This paper also shows a relationship between voltage stability and total system loss in which it is shown that voltage stability is maximized when total system loss is minimized. We have studied different case studies here with changing system loads randomly to obtain best switching option by network reconfiguration.
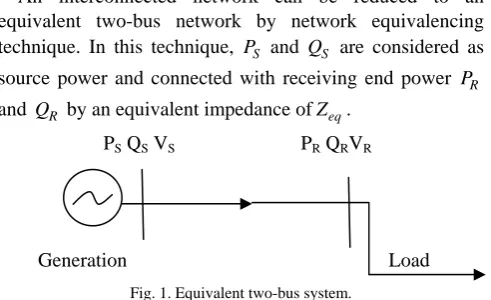
II. CALCULATION OF EQUIVALENT TWO-BUS NETWORK An interconnected network can be reduced to an equivalent two-bus network by network equivalencing technique. In this technique, PS and QS are considered as
source power and connected with receiving end power PR
and QR by an equivalent impedance ofZeq.
PS QS VS PR QRVR
Generation Load
Fig. 1. Equivalent two-bus system.
The power flow equation for the equivalent two-bus system can be shown as
Efficient Distribution System Realization Using
Equivalent Voltage Stability Indicator
S L R
P =P +P (1)
S L R
Q =Q +Q (2) The real power loss PLand reactive power loss QLfor the
equivalent system can be represented by 2 2
2 ( S S)
L eq S P Q P r V +
= (3)
2 2
2 ( S S)
L eq S P Q Q x V +
= (4)
where req and xeqare the equivalent resistance and reactance
of the system. Here VS is the sending end voltage.
The equivalent impedance of the system is given by
eq eq eq
Z =r + jx (5)
)
(
2 2L eq S S P r P Q =
+ (6)
)
(
2 2L eq S S Q x P Q =
+ (7)
The sending end voltage VS being assumed to be at
nominal value (VS= 1.0 p.u). The receiving end voltage VR
can be calculated easily as given below
)
(
. S S
R S eq
S
P j Q
V V Z
V
−
= − (8)
The total transmission loss (including real and reactive power loss) is obtained from the load-flow solution of the original interconnected system.
III. PROPOSED EQUIVALENT VOLTAGE STABILITY INDICATOR
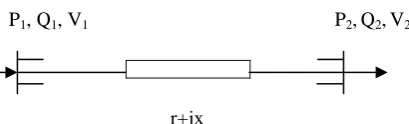
A new voltage stability indicator of the system is developed here. The proposed indicator is given below considering a line of impedance r+ jxis connected between two nodes as shown in the following Fig. 2.
P1, Q1, V1 P2,Q2,V2
r+jx
Fig. 2. SLD of two-bus segment of distribution system.
As reactive power and voltage are strongly coupled and active power and voltage are weakly coupled, so for the implementation of Equivalent voltage stability indicator active power is taken as constant. V1is considered as the reference bus voltage.
From the general power flow equation,
2 1 L
Q =Q −Q (9)
2 2 1 1 2 1 ( ) L P Q Q x V +
= (10)
)
(
2 2 2 2
1 1 2 1 1 1
Q V =Q V +x P +Q (11) Derivative of the above equation with respect to Q1yields,
2 2 2
1 1 1
1 2
dQ
V V Q x
dQ
= + (12)
)
(
21 1
2 2 1 2 1
dQ V
dQ = V − Q x (13)
Again,
(
)
2 2 2 2 2 2 L P Q Q x V +
= (14)
From Eqn(14) and Eqn(9),
)
(
2 2 2 2
1 2 2 2 2 2
Q V =Q V +x P +Q (15) Derivative of Eqn(15) with respect to Q2generates,
2 1 2 2 2
2 1 2 2 2 2 2
2 2 2
2 2 2
dQ dV dV
V Q V V Q V Q x
dQ + dQ = + dQ + (16)
Using the value of 1 2
dQ
dQ from Eqn(13) and QL from
Eqn(9) in Eqn(16), proposed voltage stability indicator is obtained as,
)
(
2 2 2 1
2 2 2 L L 1 2 1
dV Q x xV Q
L
dQ V Q Q V x Q
= = −
− (17) From the concept of equivalent two-bus network, Equivalent voltage stability indicator is given by
)
(
1 2R eq eq R S
eqv
R L L eq S
Q x x V Q
L
V Q Q x Q
= −
− (18) The more the value of the indicator nearer to zero, the system is more stable.
IV. NETWORK RECONFIGURATION SCHEME
Reconfiguration of distribution network is determined by different switching options for enhancement of voltage stability under a given loading condition. Improvement of voltage stability is realized by addition or deletion of power lines with original interconnected system which can be achieved by placing line interconnection switches (S) into the network. ‘0’ indicates switch is open and ‘1’ indicates switch is closed. N number of switches in a network generates 2N possible switching combinations. Study of network reconfiguration involves identification of best switching option which minimizes active and reactive power losses among different switching combinations.
TABLEI:LINE DATA OF ADDITIONAL POWER LINES
Power line
Starting bus
End
bus R (p.u) X (p.u)
B/2 (p.u)
Tap setting value L1 2 7 0.0012 0.1762 0.0 1 L2 5 16 0.1229 0.2558 0.0 1 L3 9 19 0.1168 0.2246 0.0 1 L4 13 23 0.1247 0.2615 0.0 1
V. SOLUTION TECHNIQUE USING PROPOSED VSIEQV The steps for calculation of best switching option using developed VSIeqv for improvement of distribution
efficiency are as follows:
1) Select the additional power lines using switching states ‘0’ or ‘1’ of switch S with the existing network.
2) Run a standard load flow solution program and calculate bus voltages, total generation power (PS+ jQS), total
load power (PR+ jQR) and total active and reactive
losses (PL andQL) of the system.
3) Reduce the multi-bus network into an equivalent two-bus network using equivalent resistance req ,
equivalent reactance xeqand equivalent receiving end
voltage R 1 eq.
(
S S)
S
P j Q
V Z
V
−
= − .
4) Calculate the value of Leqv using equation
)
(
1 2R eq eq R S
eqv
R L L eq S
Q x x V Q
L
V Q Q x Q
= −
− .
5) Repeat the previous steps with different switching status of additional power lines.
6) Search the minimum value of Leqv to obtain best voltage stable and minimum power loss system.
VI. SIMULATION RESULTS AND DISCUSSIONS An IEEE 30-bus system has been reconfigured considering 4
2 =16 different switching combinations for the four switches in additional lines. All switches open yields normal operating condition. Each switching combination has been studied separately and given a reference configuration number. At normal loading condition calculated value of voltage stability indicators, active and reactive power losses are given below Table.
TABLEII:DIFFERENT SWITCHING COMBINATIONS FOR MODIFICATION THE
EXISTING NETWORK
Configuration no S1 (2-7) S2 (5-16) S3 (9-19) S4(13-23)
0 0 0 0 0
1 0 0 0 1
2 0 0 1 0
3 0 0 1 1
4 0 1 0 0
5 0 1 0 1
6 0 1 1 0
7 0 1 1 1
8 1 0 0 0
9 1 0 0 1
10 1 0 1 0
11 1 0 1 1
12 1 1 0 0
13 1 1 0 1
14 1 1 1 0
15 1 1 1 1
TABLEIII:CALCULATED VALUES OF LEQV,ACTIVE,REACTIVE AND
TOTAL LOSSES FOR DIFFERENT CONFIGURATIONS
Configuration no
Value of Leqv
Active power loss (MW)
Reactive power loss (MVar)
Total system loss (MVA)
0 0.0363 23.726 50.778 56.048 1 0.0373 23.832 49.147 54.620 2 0.0378 23.654 49.446 54.813 3 0.0365 23.749 47.969 53.526 4 0.0334 23.669 43.057 49.134 5 0.0323 23.765 41.755 48.044 6 0.0327 23.506 42.080 48.200 7 0.0317 23.616 40.827 47.165 8 0.0346 21.229 44.287 49.112 9 0.0332 21.326 42.660 47.694 10 0.0336 21.146 42.944 47.868 11 0.0323 21.235 41.469 46.589 12 0.0300 21.539 38.033 43.709 13 0.0289 21.610 36.720 42.607 14 0.0293 21.368 37.049 42.769
15 0.0283 21.433 35.851 41.769
From the previous table it is seen that the value of Leqv and total system loss is minimum at configuration no.15. The lowest value of Leqv indicates the system is most voltage stable. So, after studying each switching combination, last combination i.e. all switches closed is estimated as the best switching option.
In this paper we have done different case studies with changing the system loads randomly to reconfigure the network. In every case the minimum value of Leqv and minimum power loss are calculated.
Case1: In this case load is increased 50% at buses 8, 16, 30 and load is decreased 50% at buses 19 and 26 of their original loadings. Considering each switching combination it is seen that best switching option is obtained with all additional power lines closed.
TABLEIV:VALUES OF LEQV,ACTIVE,REACTIVE AND TOTAL LOSSES
BEFORE AND AFTER RECONFIGURATION FOR CSAE1 Value of
Leqv
Active power loss (MW)
Reactive power loss (MVar)
Total system loss (MVA) Before
configuration 0.0459 27.691 63.212 69.011 After
reconfiguration 0.0352 24.848 46.375 52.612
TABLEV:VALUES OF LEQV,ACTIVE,REACTIVE AND TOTAL LOSSES
BEFORE AND AFTER RECONFIGURATION FOR CSAE2 Value of
Leqv
Active power loss (MW)
Reactive power loss (MVar)
Total system loss (MVA) Before
configuration 0.0299 19.919 36.473 41.557 After
reconfiguration 0.0214 18.683 25.762 31.823
Case3: With 50% increase of load at buses 7, 16, 19 and 50% decrease of load at bus 23, we have found that all switch status ‘1’ generate lowest value of Leqv .
TABLEVI:VALUES OF LEQV,ACTIVE,REACTIVE AND TOTAL LOSSES
BEFORE AND AFTER RECONFIGURATION FOR CSAE3
Value of
Leqv
Active power loss (MW)
Reactive power loss (MVar)
Total system loss (MVA) Before
configuration
0.0448 27.101 62.979 68.563
After reconfiguration
0.0351 24.672 47.416 53.450
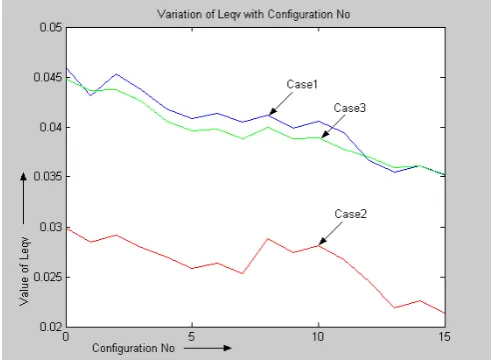
The following graphs show changing of proposed indicator values for different configurations and variation of total system losses for different switching combinations for different cases.
Fig. 3. Graph for variation of Leqv with different configurations
Fig. 4. Graph for variation of total loss with different configurations
Fig. 5. Plot for variation of Total Loss with respect to Leqv
From all above results it could be observed that after reconfiguration both active and reactive power losses are reduced to considerable lower values. The proposed indicator values justify minimization of losses satisfactorily as they change proportional to system losses. It is seen from different case studies with random selection of load that configuration of network having switching status S1=1, S2=1, S3=1, S4=1 gives desired reconfiguration.
VII. CONCLUSION
In this paper a new voltage stability indicator has been derived from power flow equation of distribution system. Reconfiguration of a network is done here for minimization of active and reactive losses and improvement of voltage stability. It is clear from above discussions that there must be a switching option which can result best configuration for any loading and generation condition. The configuration which generates the minimum value of Equivalent indicator is considered to be the best voltage stable system. A relation between VSIeqv and system loss is presented here in which decreasing value of VSIeqv indicates reduction of active and reactive losses. So, efficient distribution system can be achieved reconfiguring the network using developed VSIeqv.
REFERENCES
[1] M. A.kashem, V. Ganapathy, and G. B. Jasmon, “A new approach of distribution system reconfiguration for loss minimization,” Elsevier (Electrical Power and System Research 22), 2000, pp. 269-276. [2] C. K. Chanda, A. Chakraborti, and S. Dey, “Development of global
voltage security indicator (VSI) and role of SVC on it in longitudinal power supply (LPS) system,” Elsevier (Electrical Power and System Research 68), 2004, pp.1-9.
[3] S. Sivanagaraju, N. Visali, V. Sankar, and T. Ramana, “Enhancing voltage stability of radial distribution systems by network reconfiguration,” Electric power components and systems, vol. 33, pp. 539-550, 2005, copy right Taylor and Francis.
[4] C. K. Chanda and A. Chakrabarti et al, “Development of a Unique Network Equivalencing Technique for Determining Voltage Stable states in a Multi-bus Longitudinal Power System using Load Flow Analysis,” IE(I) Journal-EL, vol. 85, pp. 196-202, March 2005. [5] M. A. Kashem and Mahmoud Moghavveni, “Maximizing Radial
[6] T. K. Abdul and G. B. Jasmon, “A New Technique for Voltage Stability Analysis in a Power system and Improved Load Flow Algorithm for Distribution Network,” IEEE Catalogue no 95TH8130.
[7] G. B. Jasmon and Lee, “Maximizing voltage stability in distribution networks via loss minimization,” J. Electr. Power Energy System, 1991, pp. 148-152.
[8] M. A. kashem, V. Ganapathy and G. B. Jasmon, “Network Reconfiguration for enhancement of voltage stability in distribution systems,” IEE Proc.-Gener Trunsm Dislrib., vol. 147, no. 3, May 2000.
[9] S. K. Goswami and S. K. Basu, “Direct solution of distribution systems,” IEE Proc. C, vol. 138, no. 1, pp. 78-88, 1991.
[10] F. Gubina and B. Strmcnik, “A simple approach to voltage stability assessment in radial network,” IEEE Trans. on PS, vol. 12, no. 3, pp. 1121-1128, 1997.