O R I G I N A L R E S E A R C H A R T I C L E
Open Access
Comparison of Two Different Sprint Interval
Training Work-to-Rest Ratios on Acute
Inflammatory Responses
Christopher R. Harnish
1*and Roy T. Sabo
2Abstract
Background:The study aims to compare how work-to-rest ratio (W:R) influences insulin sensitivity (Si) and inflammatory responses following one session of sprint interval training (SIT).
Methods:Thirteen men and two women completed a cross-over comparison of two SIT interventions—Tabata
(TAB), 10 × 20-s sprints/10-s rest, and Wingate (WIN), 5 × 30-s sprints with 270-s rest. IL-6, IL-10, and TNF-αwere assessed at baseline, immediately following, and 1 h after SIT, as well as prior to the 24-h post-exercise oral glucose tolerance tests (OGTTs).
Results:Participants were 23.8 (±3.5) years old and 180.0 (±10.2) cm tall, weighed 78.5 (13.0) kg, and had 16.9 (±6.5) % body fat, with a mean VO2Peakof 42.0 (±7.9) ml kg−
1
min−1. There were no differences in total work (kJ) between TAB (64.7 ± 12.0) and WIN (68.0 ± 15.0). Mean (±95 % CI) Si24 h changed−2.8 (−5.1,−0.5) from baseline after TAB and−3.9 (−6.9,−0.9) after WIN. Cytokines were measured in pg ml−1and expressed as mean change (±95 % CI). IL-6 increased significantly immediately following SIT for TAB 0.70 (0.23, 1.17), and WIN 1.11 (0.60, 1.62), and remained elevated 1 h post SIT for TAB 1.10 (0.37, 1.83), and WIN 0.95 (0.26, 1.65). IL-10 showed a significant positive change immediately following exercise for TAB 1.53 (0.77, 2.29) and WIN 1.59 (0.58, 2.59). TNF-αalso increased immediately both TAB 3.26 (1.57, 4.96) and WIN 3.05 (0.56, 5.54) and was directly proportional to IL-10 (r= 0.64,p< 0.0001).
Conclusions:W:R did not alter either the inflammatory or metabolic response following SIT nor does SIT improve 24-h Si, despite increased levels of IL-10.
Keywords:SIT, Cytokines, Myokines, Wingate, Tabata
Key Points
Work-to-rest ratio does not significantly alter the inflammatory or metabolic responses of sprint interval training (SIT).
An acute bout of SIT does not improve insulin sensitivity in non-obese persons.
Transient increases in anti-inflammatory cytokines, like IL-6 and IL-10, are associated with insulin sensitivity following SIT.
There appears to be a strong positive relationship between IL-10 and TNF-αfollowing SIT.
Background
High-intensity interval training, including sprint inter-val training (SIT), has been proposed as an effective means for improving both exercise performance and metabolic function [2, 4, 5, 9, 13, 14, 18, 33, 37, 39]. While it has been shown that repeated sessions of SIT using long rest periods (i.e., low work-to-rest ra-tio) elicit improvements in endurance performance [4, 33] and Si [2, 37, 39], a single bout of SIT appears
in-effective for improving Si [3, 30, 38]. In contrast,
Whyte et al. [37] showed that a single maximal effort of matched work could improve Si, indicating that the
mechanisms for metabolic improvements following a single bout of high-intensity exercise require further investigation.
* Correspondence:[email protected]
1Department of Health and Human Performance, Ferrum College, Ferrum, VA
24088, USA
Full list of author information is available at the end of the article
There are many possible mediators of Si and
glu-cose uptake following exercise, including cytokines [10, 11, 26–28, 31]. It is also important to note that while some describe exercise-induced IL-6 release as anti-inflammatory [26], others continue to view IL-6 as pro-inflammatory [22–24], complicating the inter-pretation of their impact. For example, endurance ex-ercise has long been viewed as anti-inflammatory, resulting in significant increases in circulating cyto-kines like IL-6 and IL-10, which are believed to im-prove glucose uptake [21, 26]. In contrast, SIT is viewed as pro-inflammatory with significant increases in IL-6 within 1 h after training [22–24]. More re-cently, however, Lira et al. [19] have shown that both upper and lower extremity Wingate sprints elicit similar significant increases in IL-10, but not IL-6 im-mediately following exercise, indicating that high-in-tensity sprint training may have an anti-inflammatory effect immediately following exercise. Furthermore, unlike endurance exercise, which improves Si after
just a single bout, SIT has only been shown to im-prove Si after two or more weeks of training.
There-fore, it is unclear whether inflammatory cytokines are influencing the metabolic changes following a single bout of exercise.
Another important, yet unstudied area, is the ef-fect of work-to-rest ratio (W:R) on the inflammation or Si. W:R is an important mediator of metabolic,
cardiovascular, and endocrine responses during and after interval and resistance training [8, 15, 16], but data are scarce as to how it influences exercise in-flammatory response. Available evidence suggests that a brief bout of maximal sprints with very short rest periods could elicit a significant increase in both IL-6 and IL-10 [11, 25], as well as provide an exer-cise stimulus more akin to the brief time trial used by Whyte et al. [37]. Thus, we could elucidate whether any single bout of SIT could improve Si,
and whether inflammatory cytokines are related to such an improvement.
The purpose of this study was to compare the impact of W:R on Si and inflammatory indices. We
hypothe-sized that when matched for total work (kJ), SIT using brief rest periods (W:R = 2:1) would improve Siand
asso-ciated inflammatory markers more than SIT using long rests (W:R = 1:9).
Methods
Participants
A total of 13 men and 2 women were actively re-cruited for the study. All participants were evaluated for safe exercise participation using an American College of Sports Medicine (ACSM) risk factor as-sessment and informed of the purposes of the study
before signing an informed consent document ap-proved by the Virginia Commonwealth University (VCU) Institutional Review Board. Inclusion criteria included men and women between the ages of 18– 35 years old who were minimally active—at or below 3 × 30 min of activity/week, and had a body fat≤25 % for men and 32 % for women. Exclusion criteria were any person exceeding the body fat cut off, orthopedic lim-itations preventing full participation in the study, pre-diabetes or pre-diabetes mellitus, reported hypothyroidism, renal disease, and/or anyone considered high risk for exercise participation based on current ACSM clinical guidelines.
Experimental Protocol
All experimental procedures were performed in accord-ance with the ethical standards of the Declaration of Helsinki and approved by the VCU Institutional Review Board. The design (Fig. 1) was similar to previous SIT studies and consisted of a 1-week intra-subject control period. During this period, participants performed base-line (B) and pre-training (PRE) oral glucose tolerance tests (OGTTs). Participants then completed two differ-ent acute SIT protocols—Tabata andWingate, utilizing a counter balanced cross-over trial design, with each training bout separated by no less than 1 week. Subject 1 was randomly assigned to either Tabata or Wingate first, completing the other session second; each subse-quent subject was then assigned to the opposite group first. All exercise took place using a mechanically braked Monark Peak Bike (Monark Exercise AB, Sweden) equipped with an SRM power meter (SRM Service Cen-ter, Inc., Colorado Springs, CO). Blood samples (~10 ml) were taken immediately following, and 1 h after each training session, as well as 24 h after exercise; this corre-sponded to the initial resting sample prior to the post-exercise OGTT. Women participants were tested during the follicular phase of their self-reported menstrual cycle to minimize the impact on cytokine levels.
Dietary Control
Preliminary Testing and Evaluation
On the initial assessment day (day 3) and during the OGTT, participants completed body composition ana-lysis using bioelectrical impedance analysis (RJL Quantum IV, RJL Systems, Inc., Clinton Township, MI), where participants lay supine for a period of 20 min to allow body fluids to equilibrate across the body. During this time, small electrodes were placed on the right ankle and wrist. Body composition was then estimated using web-based software (RJL Interactive Online BIA, RJL Systems Inc., Clinton Township, MI). Following the initial OGTT, physiologic testing included bicycle VO2Peak testing. Testing was
com-pleted on the SRM equipped Monark bike; power (W) was measured for each stage. VO2 and HR were
measured continuously using a Parvo OneMax sys-tem (Parvo Medics, Salt Lake City, UT) and Polar HR monitor (Polar Electro Inc., New Success, NY), respectively. Participants were instructed to pedal at their preferred cadence throughout testing. The ini-tial workload was set at 1.5 KP with an approximate work rate of 100 W, increasing by 0.5 KP every 2 min until volitional exhaustion was reached, or the subject could not maintain their chosen cadence. Peak power output at VO2Peak was calculated as the
highest average 1-min power output achieved during the final stage of testing; this power output was termed Power at VO2Peak.
Exercise Protocols
All SIT sessions began between 0700 and 0900, and each subject’s sessions took place at the same time of the morning. All sprint bouts began with a 10-min unloaded warm-up at ~70 rpm. Participants then pedaled against a resistance equivalent to 7 % (0.07 kg kg−1) body mass for Wingate sprints and slightly lower 5 % (0.05 kg kg−1) body mass for Tabata. The former resistance has been shown to produce optimal power output and reliable measure-ment [12], while the latter was shown to be optimal during pilot data work prior to the study. Participants
were instructed to pedal as fast as possible for ~2 s before the load is applied and to continue to crank while being provided with vigorous verbal encourage-ment throughout each sprint. The Wingate protocol consisted of a total of five 30-s sprints with approximately 4-min recovery (i.e., very slow unloaded pedaling), while those completing the Tabata protocol consisted of ten 20-s sprints with 10-s recovery. The number of intervals performed for each protocol was chosen based on pilot data indicating a close match in total work (kJ).
Peak and mean power (W), as well as total work, were measured and stored using the SRM power meter and downloaded for later analysis using com-mercially available software (Training Peaks 3.0, Training Peaks, Boulder, CO). Blood lactate samples (5 μl) were measured from the fingertip using a small plastic lancet prior to exercise, immediately fol-lowing, 1 and 3 min after exercise, and analyzed using a Lactate Scout Analyzer (EKF diagnostic sales GmbH, Barleben/Magdeburg). Each sprint session lasted between 15 and 30 min with warm-up. For de-scriptive purposes, the relative average power output during each SIT session was expressed a % Power at VO2Peak.
Blood Analysis
Hemoglobin concentration (g dL−1) and hematocrit (%), using the micro-hematocrit method, were mea-sured in duplicate and then used to estimate percent-age changes in PV [6]. An indwelling venous catheter was inserted to allow for convenient blood draws. Blood samples (~10 ml) were collected together using gray top sodium fluoride tubes (OGTT) and gold top serum-separator tubes (cytokines) through-out testing and then centrifuged after each session at 4000 rpm for 15 min at 4 °C. Separated plasma was immediately removed and stored in capped 1.5-ml polypropylene tubes frozen at −80 °C until later analysis.
Oral Glucose Tolerance Tests
OGTTs were completed following insertion of a cath-eter. Blood (~10 ml) was drawn before, as well as 30, 60, 90, and 120 min after ingestion of a 75 % Glucola drink (Fisher Science Inc., Philadelphia, PA). Plasma glucose concentrations (mg dl−1) were measured using the auto-analyzer glucose oxidase method, while plasma insulin concentrations (mU l−1) were determined by ELISA (R&D Systems, Inc, Minneapolis, MN). The coefficient of variation (CV) for baselineCederholmSiwas 4.8 %.
Inflammatory Markers
Inflammatory markers of interest included IL-6 (IL-6 B), IL-10 (IL-10 B), and TNF-α (TNF-α B) measured during baseline testing periods, as well as following each bout of SIT based on the time periods reported in prior research [22–24]. At base-line, samples were analyzed from the blood taken at minute 0. On SIT days, 10 ml of blood was taken prior to, imme-diately following exercise (P), and 1 h later (P 1). A final cytokine measurement was taken prior to the OGTT ~24 h after the SIT bout (P 24). Plasma concentrations of IL- 6, IL-10, and TNF-α were determined using interleukin-specific Humakine ELISA kits (R&D Systems, Minneapolis, MN), each completed according to manufac-turer’s instructions. Coefficients of variation (CV) for IL-6, IL-10, and TNF-αwere 9.9, 6.1, and 6.6 %, respectively.
Statistical Analysis
Data analysis was performed using commercially available software (Jump 13.0, SAS Institute Inc, Cary, NC). During the design process, power analyses run for cytokines and Siestimated that anNof 15 provides a power of 0.85. All
data are presented as means ± SD. Area under the curve (AUC) was calculated using the trapezoidal rule, while the Cederholm index, which represents peripheral Si, was
cal-culated using the formula:
BW is the body weight, G0 andG120 are plasma
glu-cose concentration at 0 and 120 min (mmol l−1), and Imeanand Gmean are the mean insulin (mU l−1) and
glu-cose (mmol l−1) concentrations during the OGTT. All exercise responses (Si, glucose AUC, insulin AUC,
and cytokines) are reported as absolute values and changes from baseline. Data were analyzed using absolute change responses from baseline ± 95 % confidence inter-vals; 95 % CI changes that failed to cross 0 (i.e., 0 change) were considered significant. Dependentttests were run to compare change in Si followingTabataand WingateSIT
from baseline and at 24 h. IL-6, IL-10, and TNF-α were compared between SIT groups using a similar repeated measures ANOVA model, though with a four-level time indicator (baseline, post, 1 h, 24 h). Finally, Pearson’s cor-relation coefficients were calculated to examine the rela-tionships between Siand changes in cytokine response.
Results
Fifteen participants completed both sprint sessions, with one subject unable to complete a 24-h follow-up after the Wingate session due to inclement weather. Participants were 23.8 (±3.5) years old and 180.0 (±10.2) cm tall, weighed 78.5 (13.0) kg, and had 16.9 (±6.5) % body fat, with a mean VO2Peak of 42.0 (±7.9) ml kg−1 min−1 at 237.0
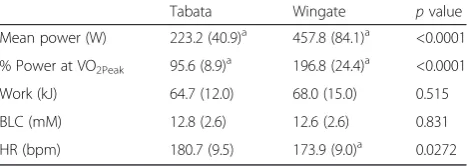
(±56.6) W. Dietary analysis indicated our participants con-sumed a diet consisting of 2077.5 ± 132.3 kcal from 81.9 ± 8.0 g of fat, 243.2 ± 14.4 g of carbohydrate, and 93.2 ± 6.8 g of protein, and were without any remarkable findings. Table 1 provides a summary comparison of SIT session var-iables. The % Power at VO2Peak, was significantly higher
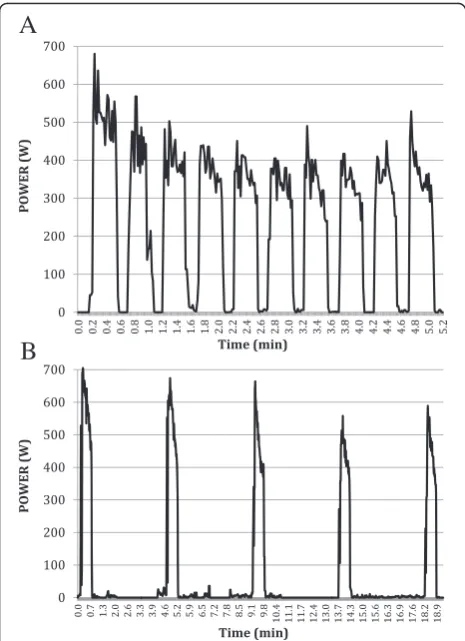
(p< 0.0001) during WIN (196.8 ± 24.4 %) compared to TAB (95.6 ± 8.9 %). While there were no differences in total kJ (p= 0.5152) or blood lactate (p= 0.8307) be-tween SIT sessions, HR was significantly lower (p= 0.0272) during Wingate sessions. Figure 2 depicts sample SIT sessions for one subject. Overall responses for men and women overlapped and trended similarly and therefore were analyzed together.
Insulin Sensitivity
Baseline Si for all participants was 75.9 (±1.0) mgI2
mM−1 mU−1 min−1. Table 2 summarizes the Si,
glu-cose AUC, and insulin AUC data for both SIT sessions using an intent-to-treat analysis. As noted above, one sub-ject was unable to complete a 24-h post testing, including OGTT, after WIN training. The data indicate that Siwas
significantly depressed after both TAB, −2.8 (−5.1, −0.5),
Cederholm Si ¼ 75;000 þ ðG0−G120Þ 1:15 180 0:19 BW=120 Gmean logðImeanÞ 1000
Table 1Comparison ofTabataandWingateprotocols and exercise session data
Tabata Wingate pvalue Mean power (W) 223.2 (40.9)a 457.8 (84.1)a <0.0001
% Power at VO2Peak 95.6 (8.9)a 196.8 (24.4)a <0.0001
Work (kJ) 64.7 (12.0) 68.0 (15.0) 0.515 BLC (mM) 12.8 (2.6) 12.6 (2.6) 0.831 HR (bpm) 180.7 (9.5) 173.9 (9.0)a 0.0272
Data are presented as means (±SD)
a
and WIN, −3.9 (−6.9, −0.9), but no differences between sprint interventions (p= 0.6723), and AUC for neither glu-cose nor insulin were significantly impacted (see Table 2).
Inflammatory Cytokine Response
Changes in glucose, insulin, and cytokines are summarized in Table 2. Plasma cytokine levels for IL-6, IL-10, and TNF-αwere measured in all 15 participants during pre-OGTT (baseline) and TAB test sessions, where 14 partici-pants of 15 participartici-pants were measured 24 h after WIN. IL-6 increased significantly immediately following SIT for TAB 0.70 (0.23, 1.17), and WIN 1.11 (0.60, 1.62), and remained elevated 1-h post SIT for TAB 1.10 (0.37, 1.83), and WIN 0.95 (0.26, 1.65). IL-10 showed a significant positive change immediately following exercise for TAB 1.53 (0.77, 2.29) and WIN 1.59 (0.58, 2.59). TNF-αalso in-creased immediately both TAB 3.26 (1.57, 4.96) and WIN 3.05 (0.56, 5.54). All cytokines returned to baseline levels 24 h after exercise. The relative anti-inflammatory re-sponse, expressed as a ratio between IL-10 and TNF-αdid not change significantly for any time period (p= 1.0) and ranged from 0.62 to a peak of 0.88 and 0.79 immediately following TAB and WIN, respectively. Results of all
significant Pearson correlations are summarized in Table 3. IL-6 was not related to either IL-10 or TNF-αbut showed a strong inverse relationship at baseline with Si. IL-10 and
TNF-αwere positively related (r= 0.64, p< 0.001) overall, as well as immediately following SIT.
Discussion
The purpose of this study was to compare how W:R in-fluences inflammatory and metabolic responses follow-ing a sfollow-ingle bout of SIT. It was believed that when matched for total work (kJ), SIT using brief rest periods (W:R = 2:1) would elicit a greater improvement in Si
pro-portional to a higher cytokine response than SIT using long rests (W:R = 1:9). However, our data indicate that both SIT sessions depressed Si 24 h after exercise. In
contrast, both sessions increased IL-6, IL-10, and TNF-α for up to 1 h after exercise. While IL-10 and TNF-α re-lease appear to be directly proportional to each other following SIT, their impact on Siis unclear.
SIT and Si
A major finding of this research was that neither TAB nor WIN SIT improved Si P 24, indicating that W:R
does not influence Si in healthy young adults. In the
present study, Si was actually significantly decreased by
5 % following WIN, while 5 min of TAB decreased Si, by
3.6 % 24 h after exercise. This finding was consistent among participants in both SIT trials, with only 3 of 15 participants actually improving Si following TAB. Close
examination of these data show that 2 of 15 participants had 15 % or greater decrease in Sifollowing WIN.
Inter-estingly, the (male) subject with the largest decrease in Si, ~15 % following TAB and 20 % following WIN, also
had the highest body fat at 24.8 %. However, no other differences, including diet, were noted between partici-pants, and removal of these outliers did not reverse the trend toward reduced Si.
The lack of improvement following TAB was unpected because total work was similar to that of the ex-tended sprint reported by Whyte et al. [38]. In that study, subjects performed two interventions, four WIN intervals, and a maximal ~200-s extended sprint (ES), both resulting in ~62 kJ. Si improved significantly 24 h
after the ES, but not WIN. In fact, a single bout of WIN has failed to improve Siin other studies as well [3, 30].
These researchers suggested that the key factor for acute improvements in Si may be ATP turnover [36], which
would be maximal during the ~200-s continuous time trial used in their study. It was this premise that influ-enced our choice of theTabataSIT intervention.
As reported by Tabata et al. [34, 35], 4 min of the 20-s work to 10-s rest ratio maximally stimulated oxygen consumption and anaerobic capacity; peak VO2 in the
final 10 s of the 4-min Tabata was similar to their Fig. 2Sample sprint interval training session of one participant for
participants’VO2max, as was the accumulated O2deficit.
In order to match work in our study, our TAB SIT ses-sion lasted an additional 50 s (i.e., two 20-s sprints), with a total duration exceeding Whyte’s ES but likely max-imally stimulating mitochondrial ATP production. Therefore, work and ATP turnover may not be critical factors at play. Of particular note, however, Whyte et al. [38] enrolled overweight and obese male participants, while we studied healthy young adults, who were rela-tively lean (body fat % = 16.9). Not surprisingly, the out-lier showing the greatest drop in Sifollowing TAB also
had the highest body fat at nearly 25 %. Therefore, over-weight and obese individuals may be more responsive to single bouts of SIT than lean individuals. Changes in Si
following a single session of SIT are more complex and warrant further investigation.
SIT Impact on the Inflammatory Response
Another major finding of this study was that W:R does not alter the effect on inflammatory cytokine release fol-lowing SIT, as there were no differences between SIT groups for any cytokine measured. In addition, we noted that IL-10 release was not dependent on IL-6 but that increases in IL-10 immediately following SIT were dir-ectly proportional to TNF-α (r= 0.64, p< 0.001), sup-porting, in part, the findings of Lira et al. [19], but not other SIT research. For example, prior research by Meckel et al. [22, 23] and Nemet et al. [24] reported that running sprint exercise significantly increased IL-6 1 h after exercise but did not influence IL-10 [24] in trained men and women. In contrast, Brestoff et al. [3] showed that a session of five Wingate sprints (1:9 W:R) did not alter IL-6 or TNF-α release after exercise in recreation-ally active men and women. Most recently, however, Lira et al. [19] reported a similar significant increase in IL-10 immediately following lower extremity Wingate sprints, but not upper extremity sprints; they also failed to show an increase in TNF-α.
A major premise of cytokine release following endur-ance exercise is that IL-6 is released directly from the muscle, making it a myokine [26], and that this re-lease from the muscle influences its anti-inflammatory
Table 3Summary of significant Pearson correlation coefficients
Independent variable Dependent variable r pvalue Baseline IL-6 Baseline Si r=−0.65
TNF-α IL-10 r= 0.64 <0.0001 Tabata
TNF-αP IL-10 r= 0.83 0.0027 TNF-αP 24 IL-10 r= 0.76 0.0472 Wingate
TNF-αP IL-10 r= 0.93 0.0001
No other significant relationships were observed
Bbaseline,Pimmediately post exercise,P 2424 h post exercise
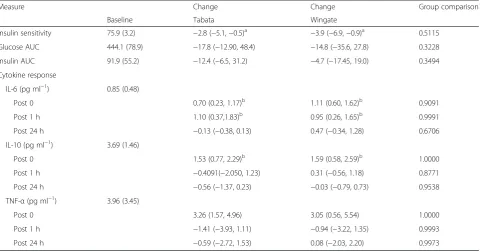
Table 2Comparison of baseline (mean ± SD) and mean (±95 % CI) changes for glucose, insulin, and cytokine measures
Measure Change Change Group comparison
Baseline Tabata Wingate
Insulin sensitivity 75.9 (3.2) −2.8 (−5.1,−0.5)a −3.9 (−6.9,−0.9)a 0.5115
Glucose AUC 444.1 (78.9) −17.8 (−12.90, 48.4) −14.8 (−35.6, 27.8) 0.3228 Insulin AUC 91.9 (55.2) −12.4 (−6.5, 31.2) −4.7 (−17.45, 19.0) 0.3494 Cytokine response
IL-6 (pg ml−1) 0.85 (0.48)
Post 0 0.70 (0.23, 1.17)b 1.11 (0.60, 1.62)b 0.9091
Post 1 h 1.10 (0.37,1.83)b 0.95 (0.26, 1.65)b 0.9991
Post 24 h −0.13 (−0.38, 0.13) 0.47 (−0.34, 1.28) 0.6706 IL-10 (pg ml−1) 3.69 (1.46)
Post 0 1.53 (0.77, 2.29)b 1.59 (0.58, 2.59)b 1.0000
Post 1 h −0.4091(−2.050, 1.23) 0.31 (−0.56, 1.18) 0.8771 Post 24 h −0.56 (−1.37, 0.23) −0.03 (−0.79, 0.73) 0.9538 TNF-α(pg ml−1) 3.96 (3.45)
Post 0 3.26 (1.57, 4.96) 3.05 (0.56, 5.54) 1.0000
Post 1 h −1.41 (−3.93, 1.11) −0.94 (−3.22, 1.35) 0.9993 Post 24 h −0.59 (−2.72, 1.53) 0.08 (−2.03, 2.20) 0.9973
Group comparisonpvalues indicate there were no differences between sprint groups
a
95 % CI changes that failed to cross 0 (i.e., 0 change) were considered significant with a significant decrease above baseline
b
role [27, 28]. Further, IL-6 is believed to be a stimu-lant to IL-10 release, which is a known inhibitor of TNF-α [1, 7, 32]. These data suggest that SIT, regard-less of W:R, results in a nearly 60 % increase in TNF-α immediately following exercise, as well as a similar increase in IL-10, which leads to a consistent yet insignificant increase in the IL-10-to-TNF-α ratio. This finding is important for two reasons. First, it supports recently published data indicating that IL-10 increases following intense exercise independent of IL-6. Second, it suggests that IL-10 may increase in response to TNF-α. The latter is supported by our data showing that both IL-10 and TNF-α increased significantly immediately after both TAB and WIN, which is then followed by a significant decrease in TNF-α 1 h after exercise. Furthermore, IL-10 levels were strongly related (r= 0.87, p< 0.005) to TNF-α immediately following both SIT sessions, which is not surprising, as IL-10 has been shown to be a potent mediator of TNF-α [1, 7]. A pro-inflammatory re-sponse, though transient, may be an important stimu-lus for long-term adaptation [5], similar to the role reactive oxygen species, like H2O2, and lactate
accu-mulation, play in mitochondrial biogenesis [17, 20]. It is also possible it simply reflects increased glycogenol-ysis and lipolglycogenol-ysis [21].
SIT: Inflammation and Glucose Regulation
Presently, our understanding of cytokine release follow-ing SIT is limited, and any relationship to acute im-provement in Si is largely based on endurance exercise
studies [10, 26, 28, 32]. Our data indicate that SIT does not have an acute impact on IL-6 release, nor does acute SIT influence on Si, regardless of W:R. Additionally,
there was no relationship between cytokine release and Si, suggesting that inflammatory cytokines do not play a
significant role in the improved Siseen in SIT studies of
at least 2 weeks [2, 30, 37, 39]. Newly published data in-dicate a disruption in the sarcoplasmic reticulum (SR) following a single bout of SIT [29]. The disruption in the SR has been postulated as the trigger for reported improvements in the chronic endurance performance and metabolic function following two or more weeks of SIT [4, 29]. For example, Coffey and Hawley [5] outlined four distinct signals for mitochondrial biogenesis and improved glucose regulation, including mechanical stretch, increased intramuscular calcium concentration, reduced muscle ATP concentrations, and an increase in ROS, or other disruptions to muscle homeostasis. While Place et al. [29] reported the latter two signals in their recent work, only the last would support the role of in-flammatory cytokines in this process. Nonetheless, far more work is needed before direct conclusions can be drawn.
These results add to a growing body of literature eluci-dating the inflammatory response following SIT and its possible role in the chronic training improvements re-ported from a variety of sprint protocols. While intriguing, our results represent a relatively healthy population of college-age adults. The fact that these data seem to con-trast those of Meckel et al. [22, 23], who studied sprint training in elite athletes during run SIT, indicates that population characteristics, fitness level, and mode likely influence inflammation in SIT. The results in the present investigation demonstrate the need for examining a num-ber of mechanisms in various populations to better under-stand the possible health benefits of SIT.
Conclusions
In conclusion, our data indicate that W:R does not sig-nificantly alter the metabolic and inflammatory re-sponses following SIT of similar work. Moreover, it appears that despite rapid increases in IL-6 and IL-10, SIT actually suppressed Si24 h after exercise. The rapid
peaks in TNF-α and IL-10 are supported by data pub-lished for Wingate SIT [19] and are more akin to the re-lease pattern seen during sepsis [1, 7, 11]. It is unclear, however, whether the cytokine release pattern represents a pro-inflammatory environment or merely relates to in-creased substrate mobilization. Nonetheless, the post-exercise environment may be an important stimulus for long-term positive adaption to high-intensity sprint and interval training regimens.
Competing Interests
The authors declare that they have no competing interests.
Authors’Contributions
CH was involved in all aspects of this research, including the conception, design, data collection and analysis, as well as writing. RS was involved in the design and data analysis editing of this manuscript. Both authors read and approved the final manuscript.
Acknowledgements
We wish to thank David Morries for his dedication to the project. This study could not have been completed without the support of Virginia Commonwealth University’s Center for Clinical and Translational research grant #UL1TR000058, National Center for Advancing Translational Sciences, as well as the technical and nursing support by the VCU Clinical Research Service Unit. In addition, this study received support from the VCU Dept. of Kinesiology and Health Sciences, SRM USA, and R&D, Inc, as well ascrowd fundingsupport through Experiment.com.
Author details
1Department of Health and Human Performance, Ferrum College, Ferrum, VA
24088, USA.2Department of Biostatistics, Virginia Commonwealth University,
Richmond, VA 23298, USA.
Received: 4 September 2015 Accepted: 22 February 2016
References
2. Babraj JA, Vollaard NB, Keast C, Guppy FM, Cottrell G, Timmons JA. Extremely short duration high intensity interval training substantially improves insulin action in young healthy males. BMC Endocr Disord. 2009;9:1–8.
3. Brestoff JR, Clippinger B, Spinella T, von Duvillard SP, Nindl BC, Arciero PJ. An acute bout of endurance exercise but not sprint interval exercise enhances insulin sensitivity. Appl Physiol Nutr Metab. 2009;34:25–32. 4. Burgomaster KA, Howarth KR, Phillips SM, et al. Similar metabolic
adaptations during exercise after low volume sprint interval and traditional endurance training in humans. J Physiol. 2008;586(1):151–60. 5. Coffey VG, Hawley JA. The molecular basis for training adaptation. Sports
Med. 2007;37:737–63.
6. Dill DB, Costill DL. Calculation of percentage changes in volumes of blood, plasma, and red cells in dehydration. J Appl Physiol. 1974;37:247–8. 7. Dhingra S, Sharma AK, Arora RC, Slezak J, Singal PK. IL-10 attenuates
TNF-alpha-induced NF kappaB pathway activation and cardiomyocyte apoptosis. Cardiovasc Res. 2009;82(1):59–66.
8. Dudley GA, Abraham WM, Terjung RL. Influence of exercise intensity and duration on biochemical adaptations in skeletal muscle. J Appl Physiol. 1982;53(4):844–50.
9. Earnest CP. Exercise interval training: an improved stimulus for improving the physiology of pre-diabetes. Med Hypotheses. 2008;71(5):752–61. 10. Febbraio MA, Pedersen BK. Muscle-derived interleukin-6: mechanisms for
activation and possible biological roles. FASEB J. 2002;16:1335–47. 11. Fischer CP. Interleukin-6 in acute exercise and training: what is the
biological relevance? Exerc Immunol Rev. 2006;12:6–33.
12. Foster C, Hector LL, MacDonald KS. Measurement of anaerobic power and capacity. In: Maud PJ, Foster C, editors. Physiological assessment of human fitness. Champaign: Human Kinetics; 1995.
13. Gibala M. Use of high intensity training in metabolic syndrome patients. Denver: ACSM Annual Meeting; 2011. p. 43–5.
14. Gibala MJ, Little JP, van Essen M, et al. Short-term sprint interval versus traditional endurance training: similar initial adaptations in human skeletal muscle and exercise performance. J Physiol. 2006;575(Pt 3):901–11. 15. Gray AB, Telford RD, Weidemann MJ. Endocrine response to intense interval
training. Eur J Appl Physiol. 1993;66:366–71.
16. Häkkinen K, Pakarinen A. Acute hormonal responses to two different fatiguing heavy-resistance protocols in male athletes. J Appl Physiol. 1993;74(2):882–7.
17. Hashimoto T, Hussien R, Oommen S, Gohil K, Brooks GA. Lactate sensitive transcription factor network in L6 cells: activation of MCT1 and mitochondrial biogenesis. FASEB J. 2007;21(10):2602–12.
18. Hawley JA, Gibala MJ. Exercise intensity and insulin sensitivity: how low can you go? Diabetologia. 2009;52(9):1709–13.
19. Lira FS, Panissa VLG, Julio F, Franchini E. Differences in metabolic and inflammatory responses in lower and upper body high-intensity intermittent exercise. Euro J Appl Physiol. 2015;115:1467–74. 20. Lira VA, Benton CR, Yan Z, Bonen A. PGC-1alpha regulation by exercise
training and its influences on muscle function and insulin sensitivity. Am J Physiol Endocrinol Metab. 2010;299(2):E145–61.
21. Lira FS, Rosa JC, Yamashita AS, Koyama CH, Batista ML, Seelaender M. Endurance training induces depot-specific changes in IL-10/TNF-alpha ratio in rat adipose tissue. Cytokine. 2009;45(2):80–5.
22. Meckel Y, Eliakim A, Seraev M, et al. The effect of a brief sprint interval exercise on growth factors and inflammatory mediators. J Strength Cond Res. 2009;23(1):225–30.
23. Meckel Y, Nemet D, Bar-Sela S, et al. Hormonal and inflammatory responses to different types of sprint interval training. J Strength Cond Res. 2011;25(8):2161–9.
24. Nemet D, Meckel Y, Bar-Sela S, Zaldivar F, Cooper DM, Eliakim A. Effect of local cold-pack application on systemic anabolic and inflammatory response to sprint-interval training: a prospective comparative trial. Eur J Appl Physiol. 2009;107:411–7.
25. Nielsen HB, Secher NH, Christensen NJ, Pedersen B. Lymphocytes and NK cell activity during repeated bouts of maximal exercise. Am J Physiol. 1996;40:222–R227.
26. Pedersen BK. Muscles and their myokines. J Exp Biol. 2011;214:337–46. 27. Pedersen BK, Steensberg A, Schjerling P. Muscle-derived interleukin-6:
possible biological effects. J Physiol. 2001;536(2):329–37. 28. Petersen AMW, Pedersen BK. The role of IL-6 in mediating the
anti-inflammatory effects of exercise. J Physiol Pharmocol. 2006;57(S10):43–51.
29. Place N, Ivarsson N, Venckunas T, et al. Ryanodine receptor fragmentation and sarcoplasmic reticulum Ca2+ leak after one session of high-intensity interval exercise. Proc Natl Acad Sci U S A. 2015;112(50):15492–7. 30. Richards JC, Johnson TK, Kuzma JN, Lonac MC, Schweder MM, Voyles WF, et
al. Short-term sprint interval training increases insulin sensitivity in healthy adults but does not affect the thermogenic response to
β-adrenergic stimulation. J Physiol. 2010;588(15):2961–72. 31. Staczkowski M, Kowalski I, Nikolajuk A, Krukowska A, Gorska M. Plasma
interleukin-10 concentration is positively related to insulin sensitivity in young healthy individuals. Diabetes Care. 2005;28(8):2036–7. 32. Steensberg A, Fischer CP, Keller C, Møller K, Pedersen BK. IL-6 enhances
plasma IL-1ra, IL-10, and cortisol in humans. Am J Physiol Endocrinol Metab. 2003;285:E433–7.
33. Stepto NK, Hawley JA, Dennis SC, Hopkins WG. Effects of different interval-training programs on cycling time-trial performance. Med Sci Sports Exerc. 1999;31(5):736–41.
34. Tabata I, Irisawa K, Kouzaki M, Nishimura K, Ogita F, Miyachi M. Metabolic profile of high intensity intermittent exercises. Med Sci Sports Exerc. 1997;29(3):390–5.
35. Tabata I, Nishimura K, Kouzaki M, Hirai Y, Ogita F, Miyachi M, et al. Effects of moderate-intensity endurance and high-intensity intermittent training on anaerobic capacity and VO2max. Med Sci Sports Exerc. 1996;28(10):1327–30.
36. Thyfault JP. Setting the stage: possible mechanisms by which acute contraction restores insulin sensitivity in muscle. Am J Physiol Regul Integr Comp Physiol. 2008;294:R1103–10.
37. Trilk JL, Singhal A, Bigelman KA, et al. Effect of sprint interval training on circulatory function during exercise in sedentary, overweight/obese women. Eur J Appl Physiol. 2011;111:1591–1597.
38. Whyte LJ, Ferguson C, Wilson J, et al. Effects of single bout of very high-intensity exercise on metabolic biomarkers in overweight/obese sedentary men. Metabolism. 2013;62(2):212–9.
39. Whyte LJ, Gill JMR, Cathcart AJ. Effect of 2 weeks of sprint interval training on health-related outcomes in sedentary overweight/obese men. Metabolism. 2010;59:1421–8.
Submit your manuscript to a
journal and benefi t from:
7Convenient online submission
7Rigorous peer review
7Immediate publication on acceptance
7Open access: articles freely available online
7High visibility within the fi eld
7Retaining the copyright to your article