Elsevier Editorial System(tm) for Computers & Chemical Engineering Manuscript Draft
Manuscript Number: CACE-D-14-00647R1
Title: Solid oxide fuel cell reactor analysis and optimisation through a novel multi-scale modelling strategy
Article Type: Full Length Paper
Section/Category: Modeling, numerical analysis and simulation
Keywords: Solid Oxide Fuel Cell, Aspen Plus, Multi-Scale, Optimisation, Modelling Corresponding Author: Professor Moses Oludayo Tade, PhD
Corresponding Author's Institution: Curtin Univ. of Technology First Author: Amirpiran Amiri
Order of Authors: Amirpiran Amiri; Vijay Periasamy; Moses Oludayo Tade, PhD; Khaliq Ahmed; Gordon D Ingram; Vishnu Pareek; Ranjeet Utikar
Abstract: The simulation of a solid oxide fuel cell (SOFC) that incorporates a detailed user-developed model was performed within the commercial flowsheet simulator Aspen Plus. It allows modification of the SOFC's governing equations, as well as the configuration of the cell's fuel-air flow pattern at the flowsheet level. Initially, the dynamic behaviour of single compartment of a cell was examined with a 0D model, which became the building block for more complex SOFC configurations. Secondly, a sensitivity analysis was performed at the channel (1D) scale for different flow patterns. Thirdly, the effect of fuel and air flow rates on the predominant distributed variables of a cell was tested on a 2D assembly. Finally, an optimisation study was carried out on the 2D cell, leading to a robust, optimal air distribution profile that minimises the internal temperature gradient. This work forms the foundation of future stack and system scale studies.
1
Solid oxide fuel cell reactor analysis and optimisation through
a novel multi-scale modelling strategy
Amirpiran Amiri1, Periasamy Vijay1, Moses O. Tadé*1, Khaliq Ahmed2, Gordon D. Ingram1, Vishnu Pareek1, Ranjeet Utikar1
1
Centre for Process Systems Computations, Department of Chemical Engineering, Curtin University, GPO Box U1987, Perth WA 6845
2
Ceramic Fuel Cells Ltd., Noble Park, Victoria 3174, Australia
*
Corresponding Author. Telephone: +61-8-9266-7581. Fax: +61-8-9266-2681. Email:
Abstract
The simulation of a solid oxide fuel cell (SOFC) that incorporates a detailed user-developed model
was performed within the commercial flowsheet simulator Aspen Plus. It allows modification of the
SOFC‟s governing equations, as well as the configuration of the cell‟s fuel-air flow pattern at the
flowsheet level. Initially, the dynamic behaviour of single compartment of a cell was examined with a
0D model, which became the building block for more complex SOFC configurations. Secondly, a
sensitivity analysis was performed at the channel (1D) scale for different flow patterns. Thirdly, the
effect of fuel and air flow rates on the predominant distributed variables of a cell was tested on a 2D
assembly. Finally, an optimisation study was carried out on the 2D cell, leading to a robust, optimal
air distribution profile that minimises the internal temperature gradient. This work forms the
foundation of future stack and system scale studies.
Keywords: Solid Oxide Fuel Cell, Aspen Plus, Multi-Scale, Optimisation, Modelling
*Manuscript (for review)
2
1.
Introduction
Over the last few decades, worldwide energy demand has shown a dramatic increase due to
population growth, industrial development and consumer behaviour. Contemporarily, societal
concerns and environmental regulations have also significantly changed, forcing energy producers
and consumers to seriously reduce their creation of greenhouse gas pollutants, including carbon and
nitrogen oxides. Despite the wide range of industrial and academic research efforts being undertaken
to enhance pollutant gas capture technologies, a proven methodology that can guarantee
environmental obligations is not yet commercially available. Therefore, clean energy generation
technologies have received tremendous attention as they offer a more fundamental solution.
Fuel cell technology is a promising alternative to traditional energy conversion techniques due to its
high conversion efficiencies leading to cleaner exhaust emissions. Furthermore, this technology
offers a flexible selection of fuels, ranging from renewable resources to fossil fuels; for example,
biomass and natural gas, respectively (Aguilar et al., 2004; Lu and Schaefer, 2004; Lin et al., 2005;
Ahmed and Föger, 2010; Doherty et al., 2010; Danilov et al., 2011a). Fuel cells find use, in
commercial or prototype form, as power systems for transportation (buses, ferries, aircraft), in
portable consumer (cameras) or military (portable soldier power) devices, in combined heat and
power systems, and for standalone power generation for commercial and residential establishments.
The application of this technology, however, is not yet well commercialised due to high
manufacturing costs and maintenance requirements. Commercialisation of solid oxide fuel cell
(SOFC) technology is highly dependent on the synthesis, configuration and application of advanced
materials, because such small scale phenomena ultimately influence the functioning of the whole
process. However, attention also needs to be focused at the system scale for overall process design
and optimisation purposes, as the balance of plant (BOP) has, in turn, a strong impact on cell scale
behaviour and maintenance requirements. From the modelling point of view, there is a bidirectional
exchange of information between a single reactor compartment (micro-scale) and the overall system
(macro-scale) that cannot be efficiently established without having practical, numerically reliable
models at these extreme scales and at intermediate ones. Some previous work has created models
that span the different scales of the system through multi-scale strategies (Andersson et al., 2010;
Bessler, 2011), but more fundamental and applied research and development effort is still needed at
the various process scales to support the commercialisation of the technology.
A comprehensive model of SOFC behaviour involves numerous complex phenomena, including
reaction and transport phenomena, catalyst characteristics, thermal and mechanical properties of the
materials and electrochemical processes. It is a „multi-physics‟ problem. As a result, the application
3
users, particularly industrial ones, usually seek convenient, integrated modelling and simulation
tools: modular process simulators, for instance. Despite some limited work published in this area
(Zhang et al., 2005; Doherty et al., 2010; Kattke and Braun, 2010; Ameri and Mohammadi, 2011),
demonstrations of system scale modelling and simulation of SOFCs using commercial simulation
packages are scarce. Unfortunately, the current widely used, commercial process simulators,
including Aspen Plus and Aspen HYSYS, do not include an inbuilt module for a SOFC unit (Zhang
et al., 2005) that covers the associated transport and reaction phenomena (Hussain et al., 2007; Ho et
al., 2009). There are several reasons for this situation. Firstly, SOFCs are considered to be novel
reactors that are the subject of ongoing rigorous experimental and modelling research (Colpan et al.,
2008). Research results frequently reveal new aspects of SOFCs that should be accounted for in
comprehensive modelling and simulation work. These quickly evolving SOFC designs and SOFC
models are not stable enough and mature enough to be embedded as standard blocks in well-known
process simulators, such as a Continuous Stirred Tank Reactor (CSTR) or a Plug Flow Reactor
(PFR). Secondly, in contrast to the common rigorous and shortcut reactor models, applications of
SOFCs are restricted to a narrow field of process engineering and energy conversion technologies.
This is possibly another cause for them receiving little attention by process simulator developers,
compared to that allocated to conventional reactors. Thirdly, material characteristics, electrochemical
reaction kinetics and catalysis are striking and complicated phenomena affecting SOFC behaviour
(Tietz et al., 2008; Ho et al., 2010) and the standard reactor units in process simulators are not
powerful and flexible enough to tackle these complexities.
The SOFC simulation work presented in this paper provides a foundation for future research and
commercialisation studies. Some of the new aspects of this work include: creation of a detailed,
compartment scale SOFC block in a commercial process simulator; demonstration of the new and
convenient configurability of the block for 0D, 1D and 2D simulations that aims to capture the
internal, distributed SOFC variables in different dimensions; development of a novel capability for
co-current, counter-current and cross-current fuel-air flow patterns to be modelled in a flowsheeting
environment; and illustration of the use of current, inbuilt process analysis facilities for sensitivity
and optimisation studies of a SOFC reactor, for example to find the air flow distribution that
minimises cell temperature gradients. The context and significance of these contributions are
expanded upon below.
With regard to the available commercial simulators, the modelling library for fuel cell reactors,
SOFCs in particular, is still in its infancy. The compartment scale Aspen Custom Modeller (ACM)
SOFC building block created in the current project has the potential to form the basis of a
comprehensive SOFC modelling library in current process simulators. This approach has two strong
4
by modifying the ACM code. That is, it is completely flexible. Simultaneously, all the benefits of a
commercial process simulator are also available: rigorous thermodynamics calculations, a
comprehensive unit model library, ease of placing and configuring units and streams in a flowsheet,
and inbuilt tools for performing optimisation, sensitivity studies and so on.
The compartment scale ACM model that is exported to Aspen Plus is the building block for larger
scale models. It assumes perfect mixing of both fluid phases. Any desired flow pattern of the fuel
and oxidant streams at the larger channel, cell and stack scales, including co-, counter- and
cross-current flows and any combination of them, can easily be approximated by connecting together
multiple ACM blocks in an appropriate configuration on the Aspen Plus flowsheet. No extra
programming is needed. Furthermore, by having a detailed, programmed ACM block that
encompasses the cell‟s electrochemical variables and parameters, the simulation of the fuel cell as an
ideal PFR, or an even more realistic reactor, becomes feasible by simply connecting blocks in series
where the number of repetitive element will be appropriately estimated based on residence time
distributions.
The present model not only provides information about the cell outlet streams, but also presents
detailed internal information on the operation, flows and electrical properties in the anode, cathode
and electrolyte regions. In addition, either internal or external fuel reformer simulation is feasible.
The fuel processing aspect has not been simulated in the present study, but the potential approaches
are briefly examined here. An external reformer could be simulated by using a currently available
standard reactor block. Internal reforming can be implemented through two approaches: (i) direct
internal reforming (DIR) by modification of the ACM code so that it includes the reforming and gas
shift reaction rates and enthalpies, with these reactions occurring on the surface of the anode; or (ii)
indirect internal reforming (IIR) through linking each current ACM block, which does not include
reforming, with its own standard reactor block that handles the fuel reforming reactions.
In the following parts of this paper, based on the developed ACM compartment model, a fuel cell
reactor is explored on three scales. A dynamic study of a single well-mixed compartment is
conducted for testing the model implementation and to reveal its response characteristics at the
compartment scale. The role and impact of dominant process variables on steady state channel scale
performance is investigated by approximating a channel by several compartments in series. This
investigation helps inform the choice of cell configuration, objective function and design variables
for use in a subsequent optimisation study at the 2D cell scale, which is approximated by linking
multiple channels together.
5
Any process that involves a fuel cell reactor behaves as a multi-scale system. Therefore, both
comprehensive individual scale modelling as well as data exchange between the various scales of
interest according to an appropriate modelling framework are important. For fuel cell processes, the
temporal and spatial scales are very wide. Furthermore, a vast range of reaction and transport
phenomena are involved. For example, the key electrochemical reaction between hydrogen and
oxygen takes place, along with fuel reformation reactions like the water-gas shift reaction and steam
reforming of hydrocarbons. All these are surface reactions requiring a catalyst surface site for
activation. Although a comprehensive and applied model should cover the majority of these aspects,
the final model should also offer optimum computational performance and convenience to the end
user. Being user-friendly is always a goal in simulator development. In this work, we aimed to find a
good trade-off between performance and convenience by combining numerical and process
flowsheet packages.
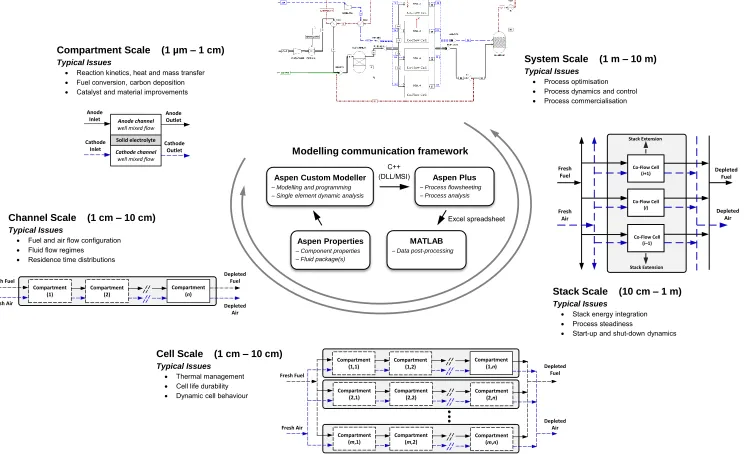
Figure 1 displays the communication between the various packages and models used in the current
work and also planned for future stages of the same project. In this plan, the effectiveness and ease
of process calculations were emphasised without compromising modelling accuracy. In terms of the
development of the work, initially a well-mixed reactor model consisting of the main governing and
constitutive equations for a single SOFC compartment has been programmed and tested in the ACM
environment. This part of the project enables us to capture the electrochemical and thermal details of
a fuel cell‟s internal workings in the Aspen Plus environment. Different voltage losses and internal
temperatures can be estimated in the current work for anode, cathode and electrolyte sections
separately.
In the second part of the work, an ACM model was exported and made accessible as a new reactor
block in the model library within Aspen Plus. The exporting was done through C++ file generation.
The model in Aspen Plus operates interactively with the ACM code and all user-machine interfaces
are similar to the standard flowsheet blocks. All of the cell‟s parameters and variables that are
defined in the ACM program are accessible through the Aspen Plus data sheet, offering flexibility
and convenience for changing the parameter values. A typical 1D SOFC channel was then
approximated by six compartments in series, and a 2D cell was created by linking five channels
together with a cross-current flow of air. Any other configuration of compartments and air-fuel flow
patterns is also possible and easy to implement. This flexibility, combined with residence time
distribution (RTD) functions, can be used to simulate ideal CSTR and PFR reactors, as well as any
reactor that falls between these two ideals (Levenspiel, 1999). These capabilities were not available
in prior studies (Doherty et al., 2010; Kattke and Braun, 2010; Ameri and Mohammadi, 2011), since
6
Despite not being covered in this paper, the final target, as shown in Figure 1, is to use the detailed
SOFC block within a 3D stack embedded in a process flowsheet for analysis and optimisation
purposes at the system scale.
3.
Model and parameters
The governing conservation and constitutive equations for SOFC modelling are strongly dependent
on the modelling assumptions and goals. This fact results in a wide range of modelling approaches,
ranging from „steady and lumped‟ models to „dynamic and 3D‟ ones (Kakaç et al., 2007;
Bhattacharyya and Rengaswamy, 2009). There must be a good reason to choose a complicated
model; otherwise a simple one should be preferred. For instance, while steady state models are
efficient and adequate for process rating analysis under normal operating conditions, a dynamic
model is required for controller tuning and process commissioning purposes. As the main goal of the
work in this paper is to establish a representative simulation of a SOFC for flowsheeting purposes, a
„lumped and dynamic‟ approach has been used for the single compartment model to keep solution
times modest while capturing some transient performance details. Consequently, a single
compartment consists of three lumped (0D) regions for the anode, the cathode and the electrolyte to
capture the details of the cell internals. Even though the model is 0D at the compartment scale, it
becomes a 1D, 2D and 3D model at the channel, cell and stack scales, respectively, as shown in
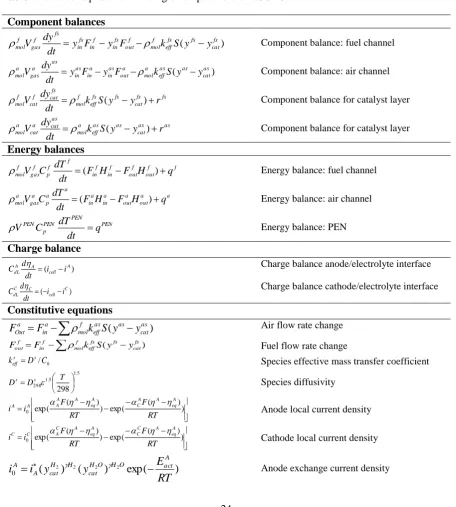
Figure 1. The governing conservation and constitutive equations are taken from Hosseini et al.
(2010) and Danilov et al. (2011b) and adapted for a single compartment. The model parameters and
operating conditions are the same as those used in Hosseini et al. (2010). The model equations and
the simulation parameters are summarised in Tables A1 and A2.
4.
Compartment scale dynamic analysis
Micro-scale compartment modelling is essential as it is the scale that captures the reaction and
electrochemical mechanisms. The insights that can be achieved through this dynamic, mechanistic
model are significantly greater than those that can be achieved with only the inbuilt, non-dynamic,
standard reactor models used for SOFC simulation in the literature (Zhang et al. 2005; Ameri and
Mohammadi, 2011). Detailed examination and validation of the compartment scale model is
necessary to provide a trusted foundation for the construction of higher scale models, including the
integrated multi-scale SOFC model. Furthermore, the predicted behaviour of a full scale SOFC is
strongly dependent on that of its sub-models, which are connected through a model integration
7
electrochemical reaction, heat transfer and mass transfer phenomena and the higher model scales
where process assessment will be carried out. It should be noted that a single compartment can be
used to represent a SOFC in a process flowsheet if a 0D model for this reactor is desired. In
summary, analysis of the compartment model‟s behaviour is important.
A vast range of dynamic investigations is possible, but only the dynamic response of the
compartment model to perturbations in the cell‟s fuel and air intakes are presented in this paper.
These analyses were executed in the ACM environment to verify the ACM implementation and to
demonstrate this highly nonlinear model‟s features in dynamic investigations. Extensive simulation
and sensitivity analysis of the SOFC compartment model is outside the scope of this study because
many other works have been published at this scale. The essential model used in this research was
validated by Hosseini et al. (2010) and Danilov et al. (2011b).
Perturbations in both the air and fuel flow rates result in dynamic thermal behaviour of the cell
through affecting the rates of heat generation through reaction and heat removal from the system.
The importance of each of these mechanisms, however, is not necessarily equal as will be
quantitatively described below. The response of the compartment temperature to step changes in the
air and fuel flow rates are presented in Figures 2 and 3, respectively.
It is well known that the oxidant normally does not have a reaction controlling role as it is always
available in excess. Accordingly, it impacts the cell temperature mainly via the heat removal
mechanism. In Figure 2, the dynamic response of the deviation in the cell temperature (ΔT) to
stepwise changes in the air flow rate (±10% variation from the base case value) is presented. The
thermal behaviour of the cell is similar to a CSTR having a stepwise change in the coolant stream
flow rate. The reactor reaches a new steady temperature after a delay. There is no overshooting of the
final temperature. Another point is that the 10% increase and decrease in the air flow from the base
case value does not cause the same cell temperature variation: they cause 5.5 K and 7 K deviations,
respectively. Even though this observation has its root in the nonlinear nature of the model, it can be
explained by the minor role of a higher flow rate of oxidant generating more heat through promoting
the reaction rate. A similar scenario has been examined for the fuel flow rate changes. The main
difference in the temperature profile dynamics, Figure 3, in contrast to that of air case, is the sudden
overshoot observed, which can be attributed to the reactant‟s impact on the reaction rate and
consequently on the heat generated by the reaction. This is an important observation about cell
temperature instability due to air and fuel stream fluctuations. Further, unequal temperature
deviations from the base case are observed while the reactant flow rate increase and decrease are
equal. The role of convective heat removal by the fuel steam becomes greater at higher fuel rates. In
8
response of the cell temperature to the changes in the air flow rate will have implications for cell
temperature control, as controllers designed or tuned with linear model assumptions may not be
sufficiently effective.
5.
Channel scale sensitivity analysis
Two key advantages of the simulation approach outlined in this work are that a wide range of
sensitivity analyses can be conducted over a spectrum of scales with little or no extra programming,
and they can be performed within an established modular simulator. Previously this has not been
possible for SOFCs. Aspen Plus contains a sensitivity analysis facility that can be used on any novel
model imported into its environment. The present user-defined model of a SOFC has been tested for
sensitivity analysis purposes and has been found to be highly flexible. For instance, the effect of fuel
flow rate increase, up to two times the base value, on the performance of the cell has been
parametrically investigated through monitoring of operating variables including the fuel utilization,
current density and temperature distributions for different fuel-air flow configurations (Figures 4–9).
For the first time, this study focuses on a single channel formed by connecting the fuel streams of six
compartment models in series, with three different air stream configurations, to illustrate the
capabilities for 1D process modelling and analysis of a SOFC reactor in the Aspen Plus environment.
Note that the simulation parameters used for these channel scale studies are those reported in Table
A2 and the choice of six compartments in series is discussed in Appendix B.
5.1 Effect of fuel flow rate on fuel utilization
For each compartment, fuel utilization (UF), a key SOFC performance characteristic, is defined as:
A in fs in
A out fs out F
F
y
F
y
U
1
(1)where
F
inA and A outF
are the fuel stream‟s inlet and outlet molar flow rates, andy
infs and fs outy
are thefuel species‟ inlet and outlet mole fractions, respectively. The prediction of fuel consumption, which
requires the simultaneous solution of the non-linear compartment model equations in Table A1,
depends on the reaction rate, which is itself dependent on the local fuel concentration and
temperature. Therefore, a higher fuel flow rate affects fuel utilization in a nonlinear way. This effect
9
1 corresponds to the location of the fuel inlet, and the Fuel Flow Rate Ratio is the ratio of the actual
inlet fuel flow rate for the case considered to the base case inlet fuel flow rate given in Table A2.
Generally the trends in the local fuel utilization profile are similar for all flow configurations. At
higher fuel rates a lower fuel utilization and lower gradient in the profiles is observed. The lower
gradient results from having a higher excess of reactant and a flatter temperature profile. While higher
fuel utilization, up to a certain limit, is always of interest, having a non-uniform UF profile implies
similar gradients in the temperature and current density profiles, which are undesirable. Therefore,
there is an inevitable trade-off between fuel utilization and uniformity of conditions inside the fuel
cell.
The fuel utilization profiles shows a higher gradient along the channel length for co-current fuel–air
flow compared to other two cases. Moreover, in spite of the similarity between the counter- and
cross-current patterns, the latter shows higher fuel utilization under all fuel flow rates, particularly at the
higher rates as shown. To emphasise the difference in UF for these flow patterns, the fuel utilization
ratios, UF cross-current / UF counter-current and UF cross-current / UF co-current, are compared for the flow patterns as
shown in Figures 4(C) and 4(D), respectively. The fuel utilization and temperature profiles are
interconnected; the UF trends will be further discussed when the temperature profiles are presented in
Section 5.3.
5.2 Effect of fuel flow rate on current density distribution
Current density and its distribution is another measure of a cell‟s performance that a comprehensive
model must be able to predict. This characteristic is examined for different fuel flow rates and the
results are displayed in Figure 5. The current density is increased by fuel flow rate for all
compartments for the three flow patterns. In addition, the profiles are smoother for higher flow rates.
However, the location of the observed peak in current density may change with the fuel flow rate.
Furthermore, there is a similarity between the current density trends of the counter- and cross-current
configurations, but detailed comparison of the values shows significant differences, particularly at low
fuel flow rates as emphasised in Figure 6. The current distribution is a highly nonlinear function of
local hydrogen conversion and the latter is affected by the spatially varying temperature. Any
variation in these dominant variables drives the changes in the produced current.
5.3 Effect of fuel flow rate on temperature profile
The temperature profile along the channel length is significantly different for the three flow patterns
studied in this work because of the dominant effect of the air stream on convective heat transfer inside
the system. A thermally homogenous system is always desired for fuel cell operation to avoid
10
configuration shows lower temperature gradients compared to the other two patterns. Due to its
importance in a cell‟s thermal management, this configuration will be the focus of the cell
optimisation study reported in the next section.
These temperature profiles help to explain the differences in the fuel utilization results reported in
Figures 4(A) and 4(B). It can be seen that a higher average temperature improves the average fuel
utilization and, in turn, higher conversion increases the temperature. This interaction is mutual and
nonlinear. Even though the temperature profile for cross-current flow is not flat, its average over the
channel length is higher than other two patterns. The same behaviour can be seen for fuel utilization
in the cross-current flow regime compared to other two (Figures 4(C) and 4(D)). Where the
temperature profile of the cross-current flow falls below that of co-current flow, the fuel utilization
profiles also cross each other. Note that in this analysis, the same total air flow rate was used in the
three flow patterns. In cross-current flow, each compartment receives fresh, low temperature air, and
the total flow is divided equally among the six compartments involved.
6.
Cell scale sensitivity analysis
Practical analysis of the behaviour of a cross-current cell must be carried out in two dimensions. The
cross-current flow pattern is potentially suitable for cell thermal management through manipulation of
the air flow distribution. Therefore, to provide the groundwork for this possibility, sensitivity analysis
was conducted on the 2D cross-flow cell in Figure 8. The main goal of the study was to see the effect
of fuel and air flow rates on the spatial variation of several key variables inside the cell and also on
the overall performance of the cell.
To quantify the spatial variations for several key distributed variables
D
I
,
T
,
y
H,
E
OCV
2
, the averagevalues (D) and coefficients of variation (CVD), or standard deviation divided by the mean, were
calculated using the following equations:
m j n i j i m j n i j i j iD
mn
D
S
S
D
1 1 , 1 1 , ,1
1
(2)
m j n i i i m j n i j iD D D
mn D D D D S S CV 1 1 2 2 1 1 , 1 1 1
(3)
where j is the channel number, i is the number of the compartment within channel j, m is the number
11
total area of the cell, Di,j is the value of D in compartment (i,j), and it is assumed that all cells have the
same size.
6.1 Effect of fuel flow rate at constant air flow rate
The cell‟s distributed variables are interconnected through highly nonlinear relations. Therefore,
interpreting the cause-effect relationships in the modelling results can be challenging. In this part of
the study, the effect of fuel flow rates 10% higher and 10% lower than the base case value are
investigated for their influence on the temperature, current density, hydrogen mole fraction and Nernst
voltage while the air flow rate was kept constant at the base case value. The cell is operated in
constant voltage mode with Ecell = 0.80 V as shown in Table A2. The results of this sensitivity study
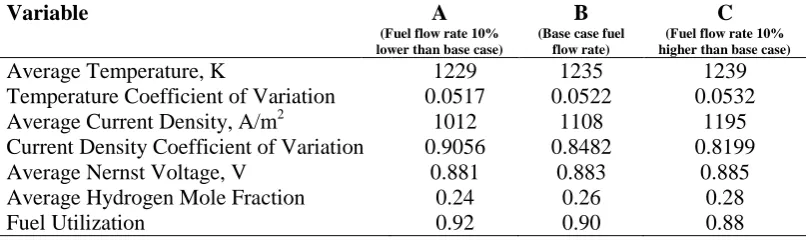
are displayed in Figure 9 with numerical values reported in Table 1.
The 2D temperature distributions plotted in Figure 9 show only small changes with an increase in the
fuel flow rate. Numerical results presented in Table 1 show that the average temperature over the cell
surface is increased by about 10 K when the fuel flow rate changes from –10% to +10% of the base
case value. It might be concluded that the heat generated by the reaction due to the fuel increase
outweighs the heat removed by the flow of this stream. The higher fuel rate also results in a higher
spread in the temperature distribution as characterised by the coefficient of variation of the
temperature (Table 1). This indicates that the reaction rate is not promoted equally in all parts of the
cell by providing more fuel. This is also illustrated by the increasing difference between the “hot spot”
and “cold spot” temperatures, max(Ti,j) – min(Ti,j), which changes from 265.0 to 278.8 K for the
lowest and highest fuel rates, respectively. It should be noted that the locations of the hot and cold
spots do not change, as can be seen in Figure 9. Even though the cooling role of the fuel stream is not
often emphasised in the analysis of hydrogen fuelled SOFC processes, purposefully adjusting the fuel
stream composition, rather than using pure hydrogen, could potentially be a useful extra design
option.
Increasing the fuel flow rate increases both the average temperature and the hydrogen mole fraction in
all parts of the cell, which has a positive influence on the electrochemical reaction. Therefore, the
generated current density benefits and is improved by about 18% when the lowest and highest fuel
rates are compared. Interestingly, the coefficient of variation of the current density is also lowered by
increasing fuel rate even though the current peak becomes more pronounced. This is in contrast with
the thermal behaviour and could be interpreted by considering the role that hydrogen plays. With
higher fuel rates the hydrogen distribution becomes more even: its coefficient of variation decreases
from 0.8274 to 0.7541. It must be noted that fuel utilization always decreases at higher feed rates, but
this does not necessarily lead to lower generated current or heat, as the inlet fuel rate is varying. In
12
hydrogen is more appropriate for evaluation of the generated heat and current, while fuel utilization is
a suitable indicator of the possibility of fuel waste in these cases.
Nernst voltage is a function of local temperature and concentration. The peak voltage can be observed
where the temperature is low and the hydrogen concentration is high.
6.2 Effect of air flow rate at constant fuel flow rate
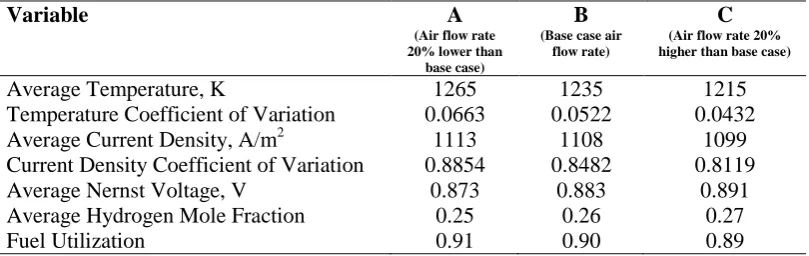
With the fuel flow rate kept constant at the base case value, the influence of air flow rate on the cell‟s
behaviour was investigated for three different air flows and the results obtained are shown in Figure
10 and Table 2.
As a preliminary finding, the higher air flow rates reduce the thermal inhomogeneity in the cell, while
the average temperature of the cell also considerably decreases because of the higher heat removal
rate. Increased air flow lowers the temperature and the Nernst voltage increases as a consequence. To
maintain the operation at a constant cell voltage, the current is reduced and, as a result, fuel utilization
is also reduced.
While the impact of the fuel flow rate was more significant on the cell‟s overall performance in terms
of current production and fuel consumption, the air stream, in contrast, mostly influences the position
and spread of the peaks in the distributed variables over the cell‟s surface. For instance, increasing the
air flow rate caused the peak of the current density to be lowered and shift from the middle of the
cell‟s inlet to the hot side of the inlet. The higher the temperature and hydrogen concentration, the
higher the current density produced due to promotion of the electrochemical reaction. Therefore, the
current density profile is dominated by the temperature and hydrogen distributions.
Even though a higher air flow rate offers a smoother internal temperature profile, its negative side
effects on the cell performance, such as the fuel utilization and power produced, are significant, as
described in the literature (Halinen et al., 2010; Di Carlo et al., 2013). More importantly the higher air
flow rates cause higher operating costs as greater power is consumed in providing the required flow
rate (Di Carlo et al., 2013).
7.
Cell scale optimisation study
The maintenance and effective working life of a cell, which are critical issues for SOFC
commercialisation, are strongly dependent on its thermal management history. Any inhomogeneity in
the temperature distribution influences the temperature dependent parameters, which may amplify the
13
the current density increases at that particular location. The higher current density drives the reaction
and generates more reactive heat that leads to an increase in temperature (Mangold et al., 2004). The
manipulation and optimisation of the air flow rate is one of the most effective strategies for setting up
and controlling an appropriate temperature distribution over the cell‟s commissioning, operation and
shutdown stages. The oxidant needed for the electrochemical reaction is also provided by the air
stream. The negative consequences of high air flow rates were mentioned in the previous section. On
the other hand, a very low flow rate of air may cause air starvation in parts of the cell in addition to
undesirable gradients in the distributed variables. Therefore, optimising the air distribution inside the
cell for a moderate total flow rate is a promising way to enhance the cell‟s thermal behaviour while
avoiding the disadvantages of very high or low air intakes.
Fuel cell optimisation consists of solving a minimisation problem for the objective function subject to
equality and inequality constraints. The objective function depends on a set design variables, which
can vary in a certain range (Secanell et al., 2011).
An air distribution optimisation case study for a cell with a cross-current flow pattern has been
implemented in Aspen Plus using the 2D model (Figure 8). The air stream might be fed into the
cell‟s air channels either uniformly or non-uniformly. The first option offers simplicity and ease in
cell manufacturing. Alternatively, an optimised air flow could potentially result in enhancement of
the cell‟s operation in terms of its thermal performance and homogeneity of the current production.
Note that the 2D modelling and simulation of a SOFC in Aspen Plus and also the use of this package
for SOFC optimisation purposes are novel aspects of this study. The parameters presented in Table
A2 were used as the basis of this simulation.
A cell with 30 compartments was considered in this case study. The air intake flow rate for each air
channel must be optimised, aiming to minimise the temperature gradient over the cell surface.
Therefore, the minimum difference in temperature between adjacent compartments is considered as
the objective function, f, and it is to be obtained by manipulating the air flow distribution by using
split fractions in splitter block B1 shown in Figure 8:
n i m j j i j i m j n i j i ji
T
T
T
T
T
nm
f
1 1 1 2 1 , , 1 1 1 2 , 1 ,)
(
)
(
2
1
min
(4)
subject to:
10% < flow fraction < 30%
where
T
is the cell‟s mean temperature and Ti,j is the temperature in compartment (i,j). The14
current density, fuel utilization and other process variables. Note that the flow fraction in the
non-optimised case of uniform air flow distribution is 1/6 or 0.1667. The optimisation was conducted
using Aspen Plus‟ inbuilt optimisation capabilities, which employ sequential quadratic programming
for simultaneous optimisation and flowsheet convergence (Aspen Technologies, 2013). The objective
function was defined as usual with a FORTRAN statement within Aspen Plus.
Figures 11 displays the PEN temperature profiles and other distributed variables of interest over the
cell for both non-optimised (uniform) and optimised (non-uniform) air intake flow rates. The
uniform distribution results show good agreement with the profiles predicted by Selimovic et al.
(2005) and Chyou et al. (2005) for the cross-current configuration with adiabatic boundaries. Some
temperature gradients are still present in the optimised case, but overall the temperature profile has
been smoothed by optimising the air flow rate distribution in splitter block B1. The temperature
distribution for the uniform air flow case shows significant differences in different locations of the
cell, particularly with the hot spot formation near the fuel inlet. Under the optimised conditions, the
air channels FC51-A, FC52-A, FC53-A, FC54-A, FC55-A and FC56-A shown in Figure 8 receive
23.13%, 18.70%, 16.83%, 15.27%, 13.82% and 12.25%, respectively, of the total air flow entering
the fuel cell (the AF stream in Figure 8). It should be noted that none of the split fractions are at the
limits (10–30%) set up in the optimisation problem. The objective function value is f = 0.023 in the
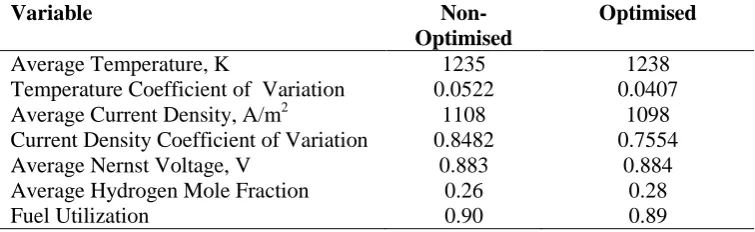
optimised case in contrast to 0.051 for non-optimised case. The optimisation procedure converged in
17 iterations. While the temperature difference between the cold spot and hot spot is 271 K in the
non-optimised case, it is moderated by optimised air flow to 154 K.
As can be seen in Figure 11 and also from the results in Table 3, while the improvement in the
temperature distribution can be considered as the main achievement of the optimisation, the
homogeneity of the current density distribution has also been improved as its coefficient of variation
shows has been significantly reduced. The average current density, however, shows a slight decrease
due to the optimised air distribution, which is reflected in a small reduction in the fuel utilization.
This might be due to lowering the reaction rate by moderating the temperature at locations where the
hydrogen availability is higher (at the fuel entrance) to the places where this reactant concentration is
lower (neat the fuel exit). Fortunately this effect is minor.
The main source of heat generation in each compartment is the electrochemical reaction.
Management of the reaction rate through control of the fuel availability is a potential manipulated
variable that could be used to achieve the cell‟s thermal management goals. However it should be
noted that the PEN temperature is also influenced by the inlet and outlet flow rates of each
compartment. To further this investigation, the fuel distribution between channels was changed to
15
locations of the cell. For instance, compartment FC11, which possesses the highest temperature
(Figures 9 and 10), was targeted to receive less hydrogen flow in comparison to compartment FC51.
This was done for other compartments and channels too. However, the analysis revealed that this
strategy could not significantly influence the temperature distribution for the cross-current pattern.
This could be attributed to two reasons. Hotspots will always occur near where the fresh feed enters
a channel as the hydrogen concentration is at its highest there and is above the level that would
potentially control the reaction rate by limiting the reactant availability. In addition, a lower fuel flow
rate means that there is less capacity for the flow of the stream to transport energy from the
compartment, and hence the temperature rise cannot be moderated.
As a further investigation, effect of fuel flow rate on the optimised air flow profiles was tested.
Accordingly, the optimisation was repeated for several fuel flow rates and the optimum air
distribution profile was captured as shown in Figure 12. Note that the total air flow rate was constant
at the base case value, and the range of fuel flow rates investigated was intentionally selected to be
very wide to test the robustness of the predicted optimised air profiles. The air profiles are
reasonably similar in shape for the fuel flow rates investigated and show that more air is needed
close to the fuel inlet. Moreover, the optimised air profiles change little for a very wide range of fuel
flow rates, which suggests that manufacturers could build a simple air distributor that performs
optimally for a relatively wide range of fuel flows. To achieve the desired air flow profile, one
possibility is to manufacture different orifice sizes at the entrance of each air channel.
8.
Conclusions
As a part of an investigation into the multi-scale modelling of a SOFC system, the simulation of a
SOFC at the compartment (0D), channel (1D) and cell (2D) scales was carried out. The simulations
were implemented by a combination of numerical and process flowsheeting packages and were able
to achieve more insight into a cell‟s performance than could be obtained by using only the inbuilt
blocks available in well-known process simulators such as Aspen Plus. The proposed multi-scale
modelling platform was successfully implemented up to the cell scale, providing a convenient,
modular basis for developing planned stack and system scale SOFC process simulations. The model
has been parametrically tested. First, a single compartment‟s dynamic behaviour was explored. This
was followed by a sensitivity analysis of a single channel‟s performance under different fuel flow
rates and flow patterns. Finally, sensitivity analysis and thermal optimisation at the cell scale was
presented, showing the effectiveness of the modular flowsheet approach for finding the best air flow
distribution. The mathematical model of a single compartment has already been validated against
16
simulation block developed in this work will be used to create a rigorous and reliable system scale
simulation that can be used for design and optimisation studies.
Nomenclature
dL
C
Double layer capacitance (A s V–1 m–2)h
C Channel height (m)
p
C Specific heat (J mol–1 K–1)
s
D298 Species effective mass diffusivity coefficient at 298 K (m2 s–1)
s eff
D Species effective mass diffusivity coefficient (m2 s–1)
Eact Activation energy (kJ mol–1(
cell
E
Cell voltage (V)
OCV
E
Open circuit voltage based on the Nernst equation (V)F
Faraday‟s constant (96485 C mol–1)
out in
F
F
,
Inlet and outlet molar flow rate (mol s–1)H
Specific enthalpy (J mol–1)R
H
Reaction enthalpy (J mol–1)
I
Current (A)i
Current density (A m–2)i* Pre-exponential kinetics factor (A m–2)
0
i
Exchange current density (A m–2)
s eff
k Species effective mass transfer coefficient (m s–1)
17
q
Energy source term (J s–1)
R
Ideal gas constant (J mol–1K–1)
ohmic
R
Ohmic resistance (Ω m2)
r Mass source term (mol s–1)
S Cell area (m2)
Si,j Electrode area in compartment (i,j) (m 2
)
T Temperature (K)
t Time (s)
V
Volume (m3)
y
Species mole fractionGreek letters
Heat transfer coefficient (W m–2
K–1)
A A
Anodic charge transfer coefficients for anodeA C
Cathodic charge transfer coefficients for anode
C A
Anodic charge transfer coefficients for cathodeC C
Cathodic charge transfer coefficients for cathode
γ Reaction rate exponent
δ Catalyst thickness (m)
Porosity
η Overpotential (V)
Stoichiometric coefficient
ρCp PEN
PEN thermal capacity (J m–3 K–1)
mol
Molar density (mol m–3)ζ Conductivity (Ω–1
m–1)
18
A
Anodea Air
as Air species
C Cathode
cat Catalyst layer
eff Effective
eq
Equilibriumf Fuel
fs Fuel species
gas Gas phase
in
Inletout Outlet
Acknowledgements
The authors would like to acknowledge the financial support of the Australian Research Council (Grant Number: LP120200622).
References
Aguilar, L., S. Zha, Z. Cheng, J. Winnick and M. Liu (2004). “A solid oxide fuel cell operating on hydrogen sulfide (H2S) and sulfur-containing fuels” Journal of Power Sources 135(1–2): 17–
24.
Ahmed, K. and K. Föger (2010). “Fuel Processing for High-Temperature High-Efficiency Fuel Cells” Industrial & Engineering Chemistry Research 49(16): 7239–7256.
Ameri, M. and R. Mohammadi (2011). “Simulation of an atmospheric SOFC and gas turbine hybrid system using Aspen Plus software” International Journal of Energy Research 37(5): 412– 425.
Andersson, M., J. Yuan and B. Sundén (2010). “Review on modeling development for multiscale chemical reactions coupled transport phenomena in solid oxide fuel cells” Applied Energy 87(5): 1461–1476.
Aspen Technologies (2013). “Aspen Plus Help” in Aspen Plus (Version 8.4) [Software], Aspen
19
Bessler, W. G. (2011). “Multi-Scale Modeling of Solid Oxide Fuel Cells: From Patterned Anodes to a Power Plant System” ECS Transactions 35(1): 859–869.
Bhattacharyya, D. and R. Rengaswamy (2009). “A Review of Solid Oxide Fuel Cell (SOFC) Dynamic Models” Industrial & Engineering Chemistry Research 48(13): 6068–6086.
Chyou, Y.-P., T.-D. Chung, J.-S. Chen and R.-F. Shie (2005). “Integrated thermal engineering analyses with heat transfer at periphery of planar solid oxide fuel cell” Journal of Power Sources 139(1–2): 126–140.
Colpan, C. O., I. Dincer and F. Hamdullahpur (2008). “A review on macro-level modeling of planar solid oxide fuel cells” International Journal of Energy Research 32(4): 336–355.
Danilov, V. A., J. Denayer and I. Moon (2011a). “An Improved Tank in Series Model for the Direct Methanol Fuel Cell” International Journal of Electrochemistry doi:10.4061/2011/204937.
Danilov, V. A., P. Vijay and M. O. Tade (2011b). “Improved Tank in Series Reactor Model for Tubular Solid Oxide Fuel Cell Stacks” Chemical Engineering & Technology 34(5): 737– 745.
Di Carlo, A., D. Borello and E. Bocci (2013). “Process simulation of a hybrid SOFC/mGT and enriched air/steam fluidized bed gasifier power plant” International Journal of Hydrogen Energy 38(14): 5857–5874.
Doherty, W., A. Reynolds and D. Kennedy (2010). “Computer simulation of a biomass gasification-solid oxide fuel cell power system using Aspen Plus” Energy 35(12): 4545–4555.
Halinen, M., J. Saarinen, M. Noponen, I. C. Vinke and J. Kiviaho (2010). “Experimental Analysis on Performance and Durability of SOFC Demonstration Unit” Fuel Cells 10(3): 440–452.
Ho, T. X., P. Kosinski, A. C. Hoffmann and A. Vik (2009). “Modeling of transport, chemical and electrochemical phenomena in a cathode-supported SOFC” Chemical Engineering Science 64(12): 3000–3009.
Ho, T. X., P. Kosinski, A. C. Hoffmann and A. Vik (2010). “Transport, chemical and electrochemical processes in a planar solid oxide fuel cell: Detailed three-dimensional modeling” Journal of Power Sources 195(19): 6764–6773.
Hosseini, S., V. A. Danilov, P. Vijay and M. O. Tad (2010). “Improved Tank in Series Model for the Planar Solid Oxide Fuel Cell” Industrial & Engineering Chemistry Research 50(2): 1056–1069.
Hussain, M. M., X. Li and I. Dincer (2007). “Mathematical modeling of transport phenomena in porous SOFC anodes” International Journal of Thermal Sciences 46(1): 48–56.
Kakaç, S., A. Pramuanjaroenkij and X. Y. Zhou (2007). “A review of numerical modeling of solid oxide fuel cells” International Journal of Hydrogen Energy 32(7): 761–786.
20
Krewer, U., Y. Song, K. Sundmacher, V. John, R. Lübke, G. Matthies and L. Tobiska (2004). “Direct methanol fuel cell (DMFC): analysis of residence time behaviour of anodic flow bed” Chemical Engineering Science 59(1): 119–130.
Levenspiel, O. (1999). Chemical Reaction Engineering, 3rd ed., John Wiley and Sons: New York.
Lin, Y., Z. Zhan, J. Liu and S. A. Barnett (2005). “Direct operation of solid oxide fuel cells with methane fuel” Solid State Ionics 176(23–24): 1827–1835.
Lu, Y. and L. Schaefer (2004). “A solid oxide fuel cell system fed with hydrogen sulfide and natural gas” Journal of Power Sources 135(1–2): 184–191.
Mangold, M., M. Krasnyk and K. Sundmacher (2004). “Nonlinear analysis of current instabilities in high temperature fuel cells” Chemical Engineering Science 59(22–23): 4869–4877.
Secanell, M., J. Wishart and P. Dobson (2011). “Computational design and optimization of fuel cells and fuel cell systems: A review” Journal of Power Sources 196(8): 3690–3704.
Selimovic, A., M. Kemm, T. Torisson and M. Assadi (2005). “Steady state and transient thermal stress analysis in planar solid oxide fuel cells” Journal of Power Sources 145(2): 463–469.
Tietz, F., A. Mai and D. Stöver (2008). “From powder properties to fuel cell performance – A holistic approach for SOFC cathode development” Solid State Ionics 179(27–32): 1509– 1515.
21
Table 1. Cell performance for different fuel flow rates with air flow rate constant at the base case value.
Variable A
(Fuel flow rate 10% lower than base case)
B
(Base case fuel flow rate)
C
(Fuel flow rate 10% higher than base case)
Average Temperature, K 1229 1235 1239
Temperature Coefficient of Variation 0.0517 0.0522 0.0532
Average Current Density, A/m2 1012 1108 1195
Current Density Coefficient of Variation 0.9056 0.8482 0.8199
Average Nernst Voltage, V 0.881 0.883 0.885
Average Hydrogen Mole Fraction 0.24 0.26 0.28
22
Table 2. Cell performance for different air flow rates with fuel flow rate constant at the base case value.
Variable A
(Air flow rate 20% lower than
base case)
B
(Base case air flow rate)
C
(Air flow rate 20% higher than base case)
Average Temperature, K 1265 1235 1215
Temperature Coefficient of Variation 0.0663 0.0522 0.0432
Average Current Density, A/m2 1113 1108 1099
Current Density Coefficient of Variation 0.8854 0.8482 0.8119
Average Nernst Voltage, V 0.873 0.883 0.891
Average Hydrogen Mole Fraction 0.25 0.26 0.27
23
Table 3. Cell performance variables under non-optimised (base case) and optimised conditions for the
same total air flow rate in both cases.
Variable
Non-Optimised
Optimised
Average Temperature, K 1235 1238
Temperature Coefficient of Variation 0.0522 0.0407
Average Current Density, A/m2 1108 1098
Current Density Coefficient of Variation 0.8482 0.7554
Average Nernst Voltage, V 0.883 0.884
Average Hydrogen Mole Fraction 0.26 0.28
24
Appendix A
Table A1. Model equations for a single compartment of a SOFC.
Component balances
) ( catfs
fs fs eff f mol f out fs in f in fs in fs f gas f
mol y F y F k S y y
dt dy
V
Component balance: fuel channel
) ( as cat as as eff a mol a out as in a in as in as a gas a
mol y F y F k S y y
dt dy
V
Component balance: air channel
fs fs cat fs fs eff f mol fs cat f cat f
mol k S y y r
dt dy
V ( )
Component balance for catalyst layer
as as cat as as eff a mol as cat a cat a
mol k S y y r
dt dy
V ( )
Component balance for catalyst layer
Energy balances f f out f out f in f in f f p f gas f
mol F H F H q
dt dT C
V ( )
Energy balance: fuel channel
a a out a out a in a in a a p a gas a
mol F H F H q
dt dT C
V ( )
Energy balance: air channel
PEN PEN PEN p PEN q dt dT C V
Energy balance: PEN
Charge balance ) ( A cell A A
dL i i
dt d
C Charge balance anode/electrolyte interface
)
( C
cell C C
dL i i
dt d
C Charge balance cathode/electrolyte interface
Constitutive equations
ina molf effas ( as catas)
a
Out F k S y y
F Air flow rate change
( fs)
cat fs fs eff f mol f in f
out F k S y y
F Fuel flow rate change
h s s eff D C
k / Species effective mass transfer coefficient
5 . 1 5 . 1 298
298
D T
Ds s Species diffusivity
0 exp( ( )) exp( ( ))
RT F RT F i i A eq A A C A eq A A A A
A
Anode local current density
0 exp( ( )) exp( ( ))
RT F RT F i i A eq A C C A eq A C A C
C
Cathode local current density
) exp( )
( )
( 2 2 2 2
0 RT E y y i i A act O H O H cat H H cat A
A
25
) exp(
)
( 2 2
0 RT E y i i C act O O cat C
C Cathode exchange current density
Ohmic C act A act cell OCV cell R E E
i ( )/ Electrolyte current
A eq A A
act
Anode activation overpotential
C eq C C
act
Cathode activation overpotential
e e Ohmic
R / Electrolyte Ohmic resistance
) 10300 exp( 10 34 . 3 4 T
e
Electrolyte conductivity
F n i S r A e A O H O
H2 2 Water production rate
F n i S r C e C O
O2 2 Oxygen consumption rate
F n i S r A e A H
H2 2 Hydrogen consumption rate
) ( PEN f f
f S T T
q Fuel channel heat transfer
) ( PEN a
a a
T T S
q Air channel heat transfer
) ( 4 ) ( 2 ) ( ) 2 ( 2 2 2 PEN a O p a PEN f O H p H p f cell R PEN T T I F C S T T I F C C S I E F H q
PEN energy balance (net rate of energy accumulation) A in H in A out H out F F y F y U 2 2 1
Fuel utilisation
C in O in C out O out A F y F y U 2 2 1
26
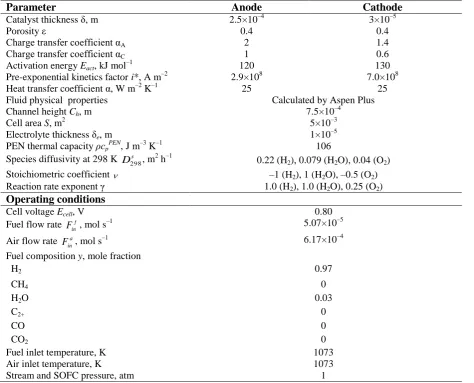
Table A2. Base case parameters and operating conditions of the planar SOFC compartment model.
Parameter Anode Cathode
Catalyst thickness δ, m 2.5×10⁻⁴ 3×10⁻⁵
Porosity ε 0.4 0.4
Charge transfer coefficient αA 2 1.4
Charge transfer coefficient αC 1 0.6
Activation energy Eact, kJ mol
–1
120 130
Pre-exponential kinetics factor i*, A m–2 2.9×10⁸ 7.0×10⁸
Heat transfer coefficient α, W m–2 K–1 25 25
Fluid physical properties Calculated by Aspen Plus
Channel height Ch, m 7.5×10
–4
Cell area S, m2 5×10⁻³
Electrolyte thickness δe, m 1×10⁻⁵
PEN thermal capacity ρcpPEN, J m–3 K–1 106
Species diffusivity at 298 K s
D298, m
2 h–1
0.22 (H2), 0.079 (H2O), 0.04 (O2)
Stoichiometric coefficient –1 (H2), 1 (H2O), –0.5 (O2)
Reaction rate exponent γ 1.0 (H2), 1.0 (H2O), 0.25 (O2) Operating conditions
Cell voltage Ecell, V 0.80
Fuel flow rate f in
F , mol s–1 5.07×10⁻⁵
Air flow rate a in
F , mol s–1 6.17×10⁻⁴
Fuel composition y, mole fraction
H2 0.97
CH4 0
H2O 0.03
C2+ 0
CO 0
CO2 0
Fuel inlet temperature, K 1073
Air inlet temperature, K 1073
27
Appendix B
The number of compartments, n, and their configuration needed to approximate a particular reactor of
interest can be estimated from its residence time distribution (RTD). Krewer et al. (2004) reported an
experimentally measured RTD for a fuel cell reactor. These data were used to estimate a typical n
value for the channel scale modelling work. The response of n ideal, well mixed reactors in series to a
step change in inlet tracer concentration (Levenspiel, 1999) is:
ni
i n
i
n
e
F
1
1
)!
1
(
1
(B1)where F is the dimensionless tracer concentration exiting the last reactor and θ is the dimensionless
time. The n value that yields the best fit to experimental data will be used as a reasonable n in this
study.
Figure B1 shows the responses of different numbers of reactors in series compared to the
experimental data of Krewer et al. (2004). It can be seen that for these data, n = 4–6 provides an
adequate fit. In the current study, we consequently selected n = 6 as a reasonable typical value to
28
Figure 1. Multi-scale modelling framework and software interactions for SOFC simulation:
undertaken (compartment, channel and cell scales) and planned (stack and system scales).
Figure 2. Compartment scale response of cell temperature to stepwise changes in the air flow rate.
Figure 3. Compartment scale response of cell temperature to stepwise changes in the fuel flow rate.
Figure 4. Channel scale fuel utilization trends for different flow patterns: (A) fuel utilization profiles for cross-current flow (solid surface) and counter-current flow (mesh surface); (B) fuel utilization profiles for cross-current flow (solid surface) and co-current flow (mesh surface); (C) ratio of fuel utilization in cross-current flow to that in counter-current flow; and (D) ratio of fuel utilization in cross-current flow to that in co-current flow.
Figure 5. Effect of fuel flow rate on current distribution profile in a channel for various flow patterns.
Figure 6. Ratio of current distribution in a channel in the cross-current configuration to that in counter-current configuration for different fuel rates.
Figure 7. Effect of fuel flow rate on temperature distribution profile in a channel for various flow patterns.
Figure 8. 2D Aspen Plus representation of a cross-current SOFC for the sensitivity analysis and
optimisation of the air distribution at the cell scale. Equal fuel flows are provided by flow splitter B2.
Optimisation is performed on the air flow distribution in flow splitter B1.
Figure 9. Effect of fuel flow rate on key distributed variables in a 2D cell for constant air flow rate conditions: (A) fuel flow rate 10% lower than base case, (B) base case fuel flow rate, and (C) fuel flow rate 10% higher than base case.
Figure 10. Effect of air flow rate on key distributed variables in a 2D cell for constant fuel flow rate conditions: (A) air flow rate 20% lower than base case, (B) base case air flow rate, and (C) air flow rate 20% higher than base case.
Figure 11. PEN temperature and other distributed variables in a 2D cell for non-optimised (A) and
optimised (B) air flow distributions.
Figure 12. Effect of fuel flow rates on the optimum air flow profile for constant total air flow rate.
Figure B1. Comparison of the RTD of n well mixed reactors in series with the experimental fuel cell
This study developed a non-isothermal, spatially distributed model for a SOFC channel and cell.
The model can capture any fuel-air flow pattern within a flowsheeting environment.
Sensitivity analysis and thermal optimisation are carried out by using the process analysis facilities within Aspen Plus.
An optimum air distribution profile was determined for a cell of a SOFC that minimises the temperature gradient.
Modelling communication framework
Aspen Custom Modeller
– Modelling and programming