DDoS: Flood vs. Shrew
Zhijun Wu, Guang Li, Meng Yue, Hualong Zeng
Tianjin Key laboratory for Advanced Signal Processing, Civil Aviation University of China, Tianjin, 300300, China
Email: {zjwu, myue}@cauc.edu.cn
Abstract—Distributed Denial of Service (DDoS) attack is one of the greatest threats to connectivity, continuity, and availability of the Internet. In this paper, two typical types of DDoS attacks, high-rate (Flood) and low-rate (Shrew), are studied on their generation principles, mechanism utilizations, behaviors, signatures, and attack performances. Experiment results show that: (I) high-rate DDoS sends a large amount of traffic to destroy the victim but it is easy to be detected. (II) low-rate DDoS organizes a small quantity of traffic to degrade the service quality at the victim end and it is easy to escape from detection. Comparison of flood with shrew is helpful to detect and defend DDoS attacks efficiently.
Index Terms—DDoS, High-Rate, Low-Rate, Flood, Shrew
I. INTRODUCTION
Nowadays, more and more computers connect with each other to compose a huge and complex system throughout the Internet. The situation of system security is not improved greatly for a long time. One of the primary reasons is that there are massive and aggressive behaviors in network system. As a typical destructive behavior, Distributed Denial of Service (DDoS) appeared as early as the birth of Internet. From the viewpoint of economic loss, investigation report from Arbor shows that the DDoS attack is the secondary rank of threat to Internet (Botnet ranks the first) [1]. It is very difficult to defense against DoS attack, and the reason is that the flows generated by DoS attacks are natural and normal.
After more than ten years’ experience, DDoS attack generates many forms and can be divided into different types. From the viewpoint of data rate, DDoS attack includes two categories: high-rate and low-rate.
The high-rate DDoS attack (Flood type DDoS, denoted as FDDoS) sends continuously large volume data packets to victims and consumes the victim’s limited resources,
such as network links or operating systems, to make the victim refusal to provide effective services for legitimate users. The high-rate DoS attack is very similar to flood to destroy a target in the attack form. Hence, high-rate DDoS attack is usually called Flood DDoS. The classical high-rate DoS attacks have SYN, ACK, TCP and UDP Flood [2], etc..
The low-rate DDoS attack (Shrew type DDoS, denoted as LDDoS) launches a sequence of cycle pulse with a certain period, width, and amplitude to victim and degrades the quality of service (QoS) at the end of victim without being sensed. Low-rate DDoS attack was firstly detected on Internet Abilene in 2001 and presented on SigComm conference in 2003 by Kuzmanovic[3]. Low-rate DDoS has a relatively low data rate to elude being detected. The behavior of low-rate DDoS attack likes a shrew can defeat an elephant. Hence, low-rate DDoS attack is called Shrew in early. Because the waveform of low-rate DDoS attack is a series square pulses, someone call low-rate DDoS attack as Pulse DoS (PDoS) attack. The purpose of low-rate DDoS attack is not to tear down the target, but to degrade the quality of service (QoS). So, low-rate DDoS attack has another name of Degrading QoS attack.
Low-rate DDoS attack is quite different from traditional flood-based attacks in behavior, attack effect and vulnerabilities mechanism exploitation. Low-rate DDoS attacks only send attack packets within a specific time interval with a relatively low rate, so that it can hide in normal network traffic. Hence, low-rate DDoS attack is characterized as intermittent attack[4].
Most available researches focus on the detection and defense against DDoS attacks, and little concern is paid on the attack performance (destructive). This paper focuses on the attack performance of high-rate and low-rate DDoS attacks for the purpose of understanding their degree of harm to victim. This paper makes three contributions. First, it describes a DDoS attack model that has been created for exploring the DDoS attack organization techniques. The model consists of four elements, attacker, handlers or masters, daemon agents or zombie hosts, and victim. Second, this paper develops a testbed that has been created for evaluating DDoS attack performance. The testbed consists of a software-defined real-time phase-coherent DDoS attack traffic simulator capable of carrying out sophisticated simulated attacks, a real-time software-defined attack sink that plays the role of victim, Manuscript received September 17, 2013; revised October 27, 2013;
accepted November 15, 2013.
Part of this paper was first appeared in ‘Research on the Comparison of Flood DDoS and Low-rate DDoS’, which is published on the proceedings of the 2nd International Multimedia Technology Conference (ICMT2011).
This work was supported by National Natural Science Foundation of China under grant 61170328 and U1333116, Natural Science Foundation of Tianjin under grant 12JCZDJC20900, and the Fundamental Research Funds for the Central Universities of CAUC under grant 31122013P007, 3122013D003, and 3122013D007.
Co-author: WU Zhijun Email: [email protected]
and post-processing versions of both the attacker and victim. Third, it presents results of simulated attacks against throughput of network, including the comparing of flood-type DDoS with shrew-type DDoS.
II. DDOSSTRATEGY
There are a variety of DoS attacks. The most common DoS attacks use a reasonable request to take up too many resources, so that legitimate users can not get a response from the service. The lack of effective authentication of the network makes it difficult to verify whether the packet is issued by the packet source IP address, resulting in a very easily to forge the source IP address and network attacks; and most of the access side of the bandwidth should be far less than the core side bandwidth, such as the core backbone of 40Gbps, while most of the access bandwidth is less than 1Gbps. The aggregate traffic from the core backbone link is easy to block the access link.
We make an assumption using knowledges of signal processing [5] to descript the process of DDoS attack. First, the Attacker generates attack signal, denoted by Attack t( ). After a certain delay time, it arrives at Handler and stimulates the Handler to produce a first-step response signal, denoted by Handle t( ) . Second, the first-step response signal takes a certain delay time to arrive at the Agent and generate a second-step response signalAgent t( ). Third, the second-step response signal undergoes a delay time and finally reaches the Victim. Then we can summarize the process of this system to form a mathematical model as shown in Fig.1[6].
Figure 1. Attack system model.
In Fig.1, Attack t( ) represents the behavior of the Attacker,
c
1,c
2 show the delay time between Attacker and Handler. Handle t( ) represents the system function of the Handler.a
11,a
12,a
21,a
22show the delay time between Handler and Agent. Agent t( ) denotes the system function of the Agent.v
11 ,v
12 ,v
21,v
22 show the delay time between Agent and Victim. Victim t( ) means the waveform at the end of Victim.We can derive the following system transfer function from Fig.1. Equation (1) indicates the response function of the attack system model.
2 2
1 1
( ) ( ) ( )
( ) ( ) ( )
i j i
ij ij
h t t c Console t
t a Agent t t v δ
δ δ
= =
= − ∗
∗ − ∗ ∗ −
∑∑
(1)Where, δ(t−ci) ,δ(t−aij) ,δ(t−vij) represent the
transfer function of the link delay.
Actually, since the number of the Handler and Agent is very large, we extend the
i
and j starting from 1 to infinite, as illustrated in equation (2).1 1
( ) ( ) ( )
( ) ( ) ( )
i j i
ij ij
h t t c Console t
t a Agent t t v
δ
δ δ
= =
= − ∗
∗ − ∗ ∗ −
∑∑
(2)Where, i=1, 2",j=1, 2" ,
i
is a variable which represents the number of the Handlers, while j is a variable which represents the number of Agents attached to the every Handler.Normally, the Attacker gives the orders at a moment, so we can deem it as an impulse signal, denoted by
( ) ( )
Attack t =δ t . From receiving the top orders to making next orders, the Handler need a certain time for machine reaction, denoted as by
τ
i, to a certain extent, we can also deem it as a delay system. Bothτ
iandc
i are delay systems, we combine them, totally denoted byc
i, as long as modify the definition thatc
iis the time slice between the Attacker giving the top orders and the Handler giving the second orders. Then, the behavior of the Handler can be represented as Handle t( )=δ( )t . The( )
Agent t represents concrete waveforms, e.g. rectangle, hackle or trapezoid (speed change). This paper mainly analyses the power, attack duration, periodic or non-periodic of the waveforms as described in Fig.2. Finally, the signals aggregate in the Victim after
v
ijdelay.(a) Typical FDDoS waveforms
(b)Typical LDDoS waveforms
Figure 2. Typical FDDoS and LDDoS waveforms.
So, the whole system can be illustrated as equation (3).
( ) ( ) ( )
( ) ( ) ( )
( ) ( ) ( )
( ) ( ) ( )
( ) ( ) ( )
( )
i j i
ij ij i
j i
ij ij i ij ij
j i
Victim t t h t
t t c Console t
t a Agent t t v
t t c t
t a Agent t t v Agent t c a v
δ
δ δ
δ δ
δ δ δ
δ δ
= ∗
= ∗ − ∗
∗ − ∗ ∗ −
= ∗ − ∗ ∗
− ∗ ∗ −
= − − −
∑∑
∑∑
∑∑
(3)
III. TRAFFIC ANALYSIS
Since DDoS attack is in a form of distribution, it must have issues of time synchronization and flow aggregation. If these two problems remain unsolved, the attack can’t achieve its purpose efficiently. Derived from equation (3), different attack flow has different delay, so we modify equation (3). Let k= ×i j , Agent t( − −ci aij−vij) is denoted by Agent t( −tk), k=0,1, 2" , then equation (3) can be converted to equation (4).
( ) ( k)
k
Victim t =
∑
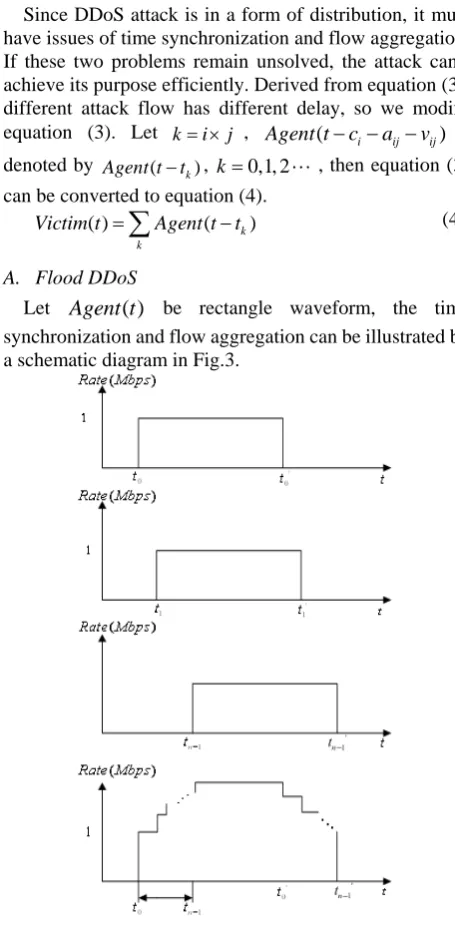
Agent t−t (4)A. Flood DDoS
Let Agent t( ) be rectangle waveform, the time synchronization and flow aggregation can be illustrated by a schematic diagram in Fig.3.
Figure 3. Time synchronization and flow aggregation in FDDoS
In Fig.3,
t
0,
"
,
t
n−1denote the every point ofn
attack flows arriving at victim; we define the metrics1 0 n
t
t
τ
−Δ =
−
as the performance of synchronization. The smallerΔ
τ
, the better synchronization and the higheraggregation in the beginning of the attack is. So the attack effect is better. And it’s a big challenge for the detection and defence system.
B. Shrew DDoS
A low-rate TCP attack is essentially a periodic burst which exploits the homogeneity of the minimum retransmission timeout (RTO) of TCP flows. Consider a router with capacity C(in bits/s). One form of attack is a periodic square wave as described in [7]. The period of the square wave is denoted by T, which is approximately one second so as to force other TCP flows to enter the retransmission state effectively. Within each period, the square wave has a magnitude of zero except for l units of time (l≥max{RTTi}). During this time, the square wave has a magnitude of a normalized burst of R. The average bandwidth of this periodic square wave is Rl T/ . Again, the objective of the low-rate attack is that for a short duration
l
, the attack packets will fill up the buffer of a victim router so that packets of any TCP flows are discarded by the router. The packet loss will force, if not all, most TCP flows to enter the retransmission state. And we note that it is considered to be a low-rate TCP attack, whose average rate has to be small. Otherwise, system administrators can easily detect an attack by its high traffic volume.A general model of a low-rate TCP attack can be described by these parameters
( , , )
R l T
. Fig.4 illustrates an example of low-rate TCP attack traffic [7].Figure 4. LDDoS attack traffic with parameters ( , , )R l T
The time synchronization and flow aggregation of LDDoS attack is shown in Fig.5.
In Fig.5,
t
0,
"
,
t
n−1denote the every point ofn
attack flows arriving at victim. We define the metrics1 0 n
t
t
τ
−Δ =
−
as the performance of synchronization. Normally, the durationl
is about of the order of 100ms, and ifΔ
τ
is relatively big forl
, it will extend thel
and weaken the power of attack aggregation, unlike FDDoS only affecting the attack beginning, it will affect the LDDoS attack all the time .Figure 5. Time synchronization and flow aggregation in LDDoS
Equation (4) is also suitable for LDDoS. The mainly difference is the attack duration.
IV. SIMULATION AND EXPERIMENTATION
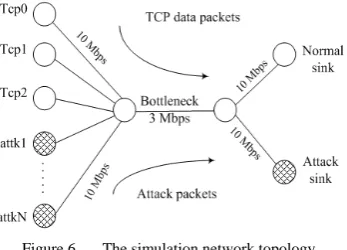
An experimental environment is built in NS-2 platform to test the performance of LDoS attack. The experimental network topology is a dumbbell as shown in Fig.6.
Figure 6. The simulation network topology
In Fig.6, the bandwidth for bottleneck is 3Mbps, which is the link of router R1 and R2, and the other links bandwidth is uniform 10Mbps, which are used for normal TCPs and attacks connecting with R1, and R2 connecting with Normal Sink and Attack Sink. There are three Normal TCP clients and N attacks in this topology. In experiments, the N is selected as 1, 3, 5, and 8 individually in order to sample a large number of flows for the purpose of traffic analysis. Routes use Drop Tail scheme. There are 3 legitimate TCP flows traversing through the bottleneck link, all of which are based on TCP New Reno, and their RTTs range from 20ms to 120ms. The minRTO of each flow is equal to 1s. All the simulation experiments were performed in the NS-2 2.34 environment. The queue size (QS) is 100 packets. All the attack flows begin at 20s and end at 110s[8][9].
A. Comparison of FDDoS and LDDoS as well as Normal TCP Traffic in Time-Frequency Domain
This part will reveal the differences between FDDoS and LDDoS in time domain and frequency domain. The traffic within the time slice between 20s and 30s is chosen to analyse. Vertical axis of time domain represents the number of arrivals within every ten milliseconds and the frequency domain is the FFT transform of the arriving packet number sequence in the time slice.
Without attack, normal traffic uses FTP traffic generator, setting package with size 1000B. As illustrated in Fig.7, the simulation results of normal traffic TCP flow.
(a) Normal tcp in time domain
(b)Normal tcp in frequency domain
Figure 7. Normal tcp traffic
Note that the mean number of arrivals is about 1.25. We can approximately calculate the traffic by 1.25*1000*8/100=1Mbit/s. As there are 3 TCPs flow, so the total TCP flow is 3Mbit/s in general corresponding with the bottleneck bandwidth, which proves the rationality of the simulation. In the frequency domain, there is a rather big value at 0HZ. We all know that 0HZ presents the direct current, which is consistent with the mean arrivals fluctuating above and below 1.25. The rest of frequency components are very small and well-proportioned[10].
FDDoS adopts UDP FLOOD attack, using CBR (Constant Bit Rate) traffic generator. Setting rate as 3Mb/s and package size as 50B, the traffic of FDDoS is shown in
Fig.8. From the frequency domain, the obvious feature is that there is a very large value at 0 HZ and little value in the rest frequency, due to FDDoS keeping a high traffic for a rather long time.
(a) FDDoS time domain
(b)FDDoS frequency domain
Figure 8. FDDoS traffic
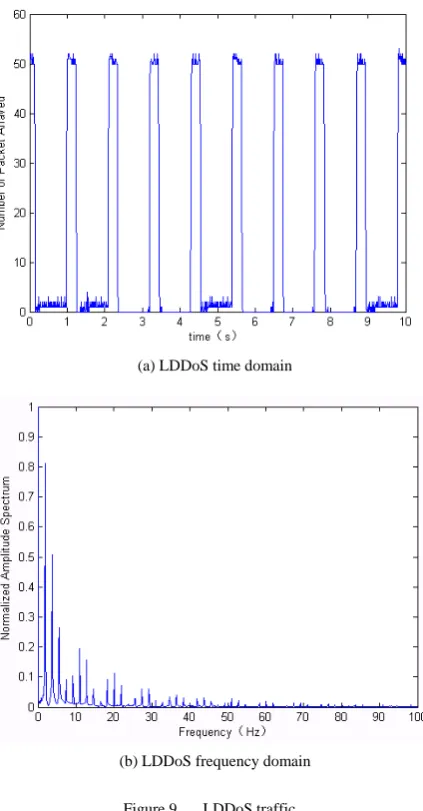
LDDoS attack sends 8 UDP rectangle pulses, with period 1.1s, pulse length 0.1s and peak rate 0.375Mb/s, packet size 50B. Then we can get simulation results as depicted in Fig.9.
Note that in the time domain, after the short pulses, normal TCP traffic is very low or even zero, certifying the effect of the LDDoS. In the frequency domain, the most important character is that the signal energy mainly focus on [0,20]HZ, due to the low-rate period[10].
(a) LDDoS time domain
(b) LDDoS frequency domain
Figure 9. LDDoS traffic
TableI gives the energy distribution in each frequency slice.
TABLE I.
ENERGY DISTRIBUTION IN PERCENT
Item Normal TCP FDDoS LDDoS
0 92.42 99.995 41.31
(0-20] 1.16 0.001 56.80 [20-40] 0.68 0.001 1.55 [40-60] 2.73 0.001 0.24 [60-80] 1.05 0.001 0.07 [80-100] 1.96 0.001 0.03 Energy distribution shows that 90% energy of normal traffic and FDDoS traffic focus on 0 HZ, which means they have a rather steady direct current without much fluctuation. As to LDDoS, the fluctuation is much higher, and only 41% energy focus on 0HZ, 97% energy is in the range of [0,20]HZ.
B. Network QoS Analysis
This paper evaluates the impact of FDDoS attacks and LDDoS attacks on two metrics: packet dropping rates and throughput.
All the following experiments are based on the NS-2 environment as mentioned above.
a) packet dropping rates
The experimental environment and parameters are the same as mentioned above except for the parameter of power.
The situation of dropping rate changes with different attack power is shown in TableII. With different power, the numbers of dropping packets are basically similar, but the numbers of total received packets are much distinct. So, we can draw a conclusion that stronger attack power does not indicate higher dropping rate.
TABLE II.
PACKET DROPPING PROBABILITY
Item
Total received numbers
Dropping packets numbers
Dropping rate
Normal TCP 3784 6 0.16%
FDDoS
3Mbps 578 149 25.78%
2Mbps 592 150 25.34%
1.5Mbps 925 159 17.19%
1Mbps 2038 156 7.65%
SDDoS
3Mbps 1792 264 14.73%
2Mbps 2517 298 11.84%
1.5Mbps 2435 297 12.20%
1Mbps 3326 206 6.20%
b) Throughput
Then, in order to analyse the throughput of FDDoS and LDDoS, the Normal, DoS and LDoS attacks are added into the experiments.
As we all know, single flow FDDoS is FDoS, and single flow LDDoS is LDoS. Here, we define the rate of DoS and LDoS as the bottle neck bandwidth, which is 3Mbps. Besides, we mainly study the beginning 10s of attack by statistics of the total cumulative TCP throughput.
In experiments, the LDoS attack is configured with a period of 100ms and pulse length of 200ms. The LDoS attack lasts for 25s, which starts at 25s and ends at 50s. All LDoS attack flows are sampled during 25s. Two types of LDDoS attacks, synchronous and asynchronous, are used to generate the attack traffic. The synchronized LDDoS attack is all LDoS attacks from different domain start attacking at the same time. The asynchronous LDDoS attack is organized to start all LDoS attacks one by one with a time separation of 20ms.The attack rate for single attack flow is different configured with the number of attacks, as shown in Table III.
TABLE III.
CONFIGURATION OF ATTACKS
Number of Attacks N 1 3 5 5 8
Attack rate of single flow R (mbps) 3 1 0.6 1 0.375
Multi-LDoS attacks with different attack rates are expressed in LDoS N-M. Here, N is the number of LDoS attacks, and M is the attack rate for single LDoS attack. The traffic are sampled in NS-2 platform and analyzed by using MATALB to draw the performance curve, in which the x-axis is time in second, range of 25s-50s, and the y-axis is the accumulative value of normal TCP flow though the bottleneck link under the LDoS attack during
25s-50s.
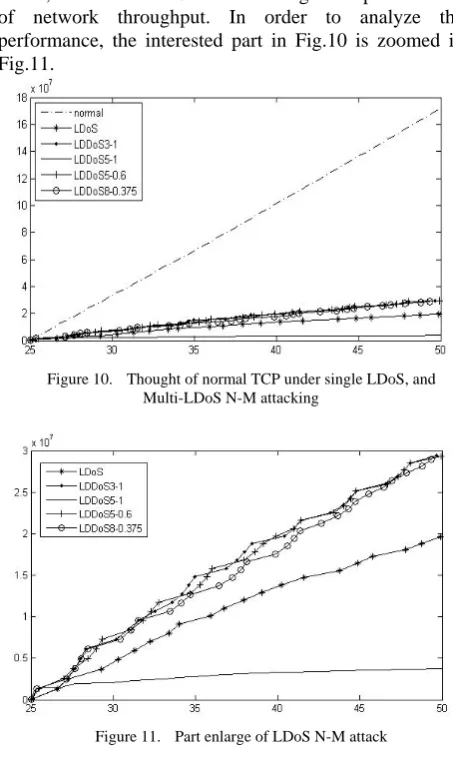
Fig.10 is the experiment result of normal TCP, single LDoS, and Multi-LDoS N-M attacking in the performance of network throughput. In order to analyze the performance, the interested part in Fig.10 is zoomed in Fig.11.
Figure 10. Thought of normal TCP under single LDoS, and Multi-LDoS N-M attacking
Figure 11. Part enlarge of LDoS N-M attack
Fig.10 and Fig.11 show that the throughput of normal TCP increases linearly, but it degrades badly when the LDoS attacks are added. (I) When the network suffers from single LDoS attack with a rate of 3Mbps, the network throughput has a drop of 89% approximately. (II) Increase the number of LDoS attacks from 1 to 3 and assign the bottleneck bandwidth of 3Mbps to 3 LDoS attacks averagely, hence, each of three LDoS attack has a rate of 1Mbps. This kind attack is denoted as LDoS 3-1. The attack effect of LDoS 3-1 is not better than the single LDoS attack. (III) Increase the number of LDoS attacks from 1 to 5 and assign 5Mbps to each LDoS attack, denoting this kind attack as LDoS 5-1. Because 5Mbps is bigger than the bottleneck bandwidth of 3Mbps, hence, the attack effect is much better than single LDoS attack. (IV) Increase the number of LDoS attacks from 1 to 5 and assign 3Mbps to each LDoS attack, denoting this kind attack as LDoS 5-0.6. The attack effect of LDoS 5-0.6 is almost the same with LDoS 3-1. (V) Increase the number of LDoS attacks from 1 to 8 and assign 3Mbps to each LDoS attack, denote this kind attack as LDoS 8-0.375. The attack effect of LDoS 5-0.375 is almost the same with LDoS 3-1 and LDoS 5-0.6.
Analysis shows that if a certain bandwidth is assigned to
a number of single LDoS attack averagely, this kind attack is called as LDoS N-M. LDoS N-M is compared with single LDoS attack in the attack effect, and result shows LDoS attack is better than LDoS N-M. But, LDoS N-M has relative lower rate than LDoS attack, hence, LDoS attack is easier to be detected than LDoS N-M, which is a covered attack can elude traditional detection. For example, the LDoS 5-1 attack is concealable even through it has a bigger attack rate of 5Mbps than the bottleneck bandwidth of 3Mbps.
The experiment result of normal TCP under single LDoS, and LDDoS attack is shown in Fig. 12.
Figure 12. Thought of normal TCP under single LDoS, and LDDoS attacking
LDoS and LDDoS attacks have the same attack rate. Asynchronous LDDoS attack is composed of many LDoS attacks from different domains. These LDoS attacks start one by one with a 20ms time dely. From the viewpoint of attack performance, single LDoS attack is the best. It is obvious that the attack effect of asynchronous LDDoS attack is not good as that of single LDoS and LDDoS attack. Because the attack rate is shared by all LDoS attacks, which are the elements of asynchronous LDDoS attack.
The experiment result of FDoS attack is shown in Fig.13. DDoS N-M means N single DoS attack with rate of M. Fig.13 shows that the network throughput degrades to about zero, and the whole network refuses to offer all service. For the purpose of analysis, the interested part in Fig.13 is enlarged.
Figure 13. Thought of normal TCP under single DoS, and Multi-DoS N-M attacking
The differences between LDDoS and DDoS on attack performance are analyzed as follow. The attack effects are shown in Fig.14, in which the single LDoS/DoS and LDDoS/DDoS attacks are involved, and the dotted line donates the throughput of normal TCP traffic.
Figure 14. Attack effects
Fig.14 shows that the total throughput under attacks is lower than the normal throughput. In general, the attack effect of DoS is better than that of LDoS. The best is DDoS attack, and the worst is LDoS attack. This result is reasonable, because the intent of DDoS attacks is to tear down the victim machine while LDoS attack is to degrade the quality of service at the end of victim.
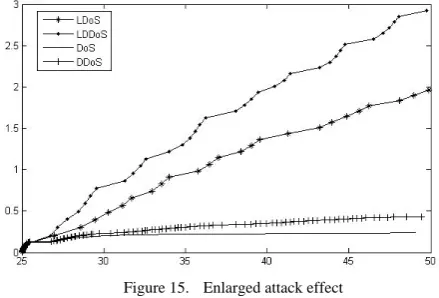
In order to get more clear observation on the attack effects, remove the throughput of normal traffic and enlarge the part of interest in Fig.14. Partial enlarged cavers are shown in Fig.15.
Figure 15. Enlarged attack effect
For understanding the attack effects better, the comparative analysis is performed by statistical on the cumulative value of the throughput within 25 seconds, as shown in Table IV.
C. Firewall Experiment
In this part, six typical software firewalls are used to test the detection and defence against DDoS in real environment, as shown in Table V.
The parameter configuration for LDDoS attack is 300ms-10M and 200ms-3.3M. It is different from FDDoS. Note that if LDDoS attacks of 300ms-10M cannot be intercepted by firewalls, then the LDDoS attacks of 200ms-3.3M scarcely have the probability to be stopped.
Additionally, the LDDoS attacks are configured to attack only on the servers, and it is able to achieve the effect of reduce service without being detected [9].
Table IV indicates that all the firewalls have the function of detecting FDDoS, but not all of them can detect LDDoS attacks.
TABLE IV.
CUMULATIVE VALUE OF THE THROUGHPUT WITHIN 25 SECONDS
Attacks Cumulative value of the throughput
Without Attack 100%
LDoS 11.4% LDoS3-1 17.0% LDoS5-1 2.0% LDoS5-0.6 17.0% LDoS8-0.375 17.2% DoS 1.2% DoS3-1 1.8% DoS5-1 0.6% DoS5-0.6 2.5% DoS8-0.375 2.1%
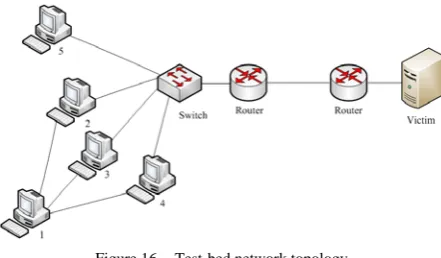
D. Web Service Experiments
Firstly, Web service test is performed. The test-bed topology is shown in Fig.16. The Victim is a Web server;
Routers are CISCO-XM 2621. The bottleneck bandwidth we set is 10Mbit/s (about 1.25MB/s)[11].
Figure 16. Test-bed network topology
Loadrunner is software that can be used to simulate Internet traffic, for example, http traffic.
LDDoS Attack is a UDP LDDoS attack tool embedded in zombies. LDDoS Control is a control tool which controls the LDDoS Attack to attack the victim with certain parameters.
TABLE V.
TEST OF FIREWALL
Type Name User Default UDP Traffic Threshold (Packets Number/s)
Attack Parameter Detecting
L (ms) R (Mbps) T (s) Yes No
General Firewall
KASPERSKY PC 500 200 3.3 1.1 Yes No
SkyNet PC None 300 10 1.1 Yes No
Zone ALARM PC None 300 10 1.1 Yes No
Professional FDDoS Firewall
Bing Dun Server 2000 200 3.3 1.1 Yes No
Tian Ao Server 10000 300 10 1.1 Yes No
Ao Dun Server 8000 300 10 1.1 Yes No
Set the parameter of LDDoS Attack in each zombie as follow[10][11][12]:
(I) pulse period T=1.1s. (II) length of burst L=200ms. (III) pulse peak rate R=40Mb/s. The setup for DDoS attack are:
(I) DDoS Attack is a SYN-FLOOD attack tool embedded in zombies.
(II) DDoS Control is a control tool that controls the DDoS Attack to attack the victim.
The parameter of SYN-FLOOD doesn’t need to set, because it will try its most best to send a large number of packets.
Run the Loadrunner tool to simulate 10 users visiting the web site “www.cauc.edu.cn”. The size of the web page is 60KB.
The configuration of test environment is shown in Table VI.
TABLE VI.
TEST-BED HOST CONFIGURATION
Number of host
IP
Address Role
Operating
System Software
1 10.0.20.2
14 controller
Fedora core 4
LDDoSContro l /DDoSControl
2 10.0.20.2
15 zombie RedHat 9.0
LDDoSAttack /DDoSAttack
3 10.0.20.2
16 zombie RedHat 9.0
LDDoSAttack /DDoSAttack
4 10.0.20.2
17 zombie RedHat 9.0
LDDoSAttack /DDoSAttack
5 10.0.20.2 18
normal
host Windows XP Loadrunner
Victim 10.1.30.2
23 target host
Fedora core
4 Apache
As shown in Fig 17, 00:00- 00:00, there is only legitimate http traffic. At 01:00, zombies start attacking, and at 01:30 (about 30min later), attacks stop. During 00:00 to 01:00, the response time is about 0.135s. While during 01:00 to 01:30, response time changes from 1.0s to
8.8s. At 01:30, attacks end, response time gradually recovers to 0.135.
Figure 17. Record of Transaction Response Time under LDDoS
Test data shows that LDDoS attacks lower the quality of service. It is verified that LDDoS attacks are harmful for legitimate Internet applications.
In Fig 18, 00:00- 01:00, there is only legitimate http traffic. At 01:00, zombies start attacking, and at 01:30, attacks stop. During 00:00 to 01:00, the response time is about 0.135s. At 01:00-01:30, there is no dot between this time slice. The response time is none, that is to say, the normal visiting are totally refused. At 01:30, attacks end, and response time gradually recovers to about 0.135s.
By comparing LDDoS with DDoS, result shows that DDoS attack has fatal harm.
Figure 18. Record of Transaction Response Time under DDoS
E. FTP Service Experiments
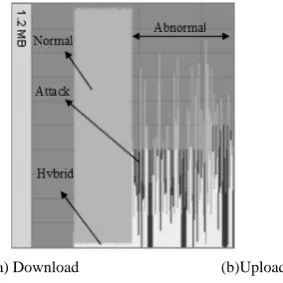
The test-bed network topology is shown in Fig.16, which is used to test FTP throughput, and here the victim provides FTP service. At the beginning, host 5 downloads a file from FTP server, and after the normal FTP traffic is steady, we start attacking with T=1.1s, L=200ms, R=40Mbps.
As shown in Fig.19, before attack, the Normal in Fig.19(a) represents the client’s normal download traffic recorded in host 5, and the Normal in the Fig.19(b) is the server’s upload traffic recorded in FTP server, they are approximately equal. The Hybrid represents the combination of the upload and downloads in the client or server, and the Abnormal is the attack traffic.
(a) Download (b)Upload
Figure 19. Traffic with LDDoS attacks
During LDDoS attacks, download traffic and upload traffic are lower than normal state and fluctuate strongly. In Fig.19(b), the Attack represents the attack traffic from zombies. We can see that the rate of LDDoS attacks is even lower than the attacked FTP traffic.
In Fig.20, the Hybrid also represents the combination of the upload and download in the client or server.
In Fig. 20(a), during DDoS attacks, download traffic in normal host 5 is none; the ftp service is totally down, absolutely denial of service. In Fig. 20(b), there is no upload traffic during DDoS, all of the traffic remained in the server is DDoS attack traffic from zombies.
(a) Download (b)Upload
Figure 20. Traffic with DDoS attacks
V. CONCLUSION
The comparison of FDDoS with LDDoS shows that they are different in some aspects, such as volume of traffic and behavior. LDDoS attack is stealthy with low enough flows, likes a shrew can beat an elephant. While FDDoS is manic with large volume traffic, likes a behemoth swallowing the victims.
FDDoS attacks do not need time to synchronize and aggregate flow to send a large amount of packets to targets during a certain time independently. There is no coordinate mechanism in FDDoS attacks. What the controller of FDDoS attacks does is just to set up the start and end time, then send the start instruction. Of course, before the attack, the controller should make a decision on how many zombies are used in this attack. The more zombies, the bigger attack traffic will be sent, and the better attack effect will be observed.
Ideally, LDDoS attacks need time synchronization and flow aggregation to send average low rate of packets in a periodic pulses, forming big volume of flows at the end of target. It is very difficult to generate synchronous and aggregated LDDoS attacks in real wide network. Because it needs to be coordinated to reach the state of time synchronization and flow aggregation. Additionally, network RTT and RTO are required to be estimated in synchronous and aggregated LDDoS attacks. If multiple LDoS attacks from different domains are simply put together according to their arrival time at the end of target, they are neither synchronous nor aggregated. The attack effect of multiple LDoS attacks is appreciably improved than a single LDoS attack even the number of attacks increases largely. But, if multiple LDoS attacks from different domain are coordinated carefully to form a big volume of attack flow, the attack effect will be improved obviously every time when a new LDoS attack is added in the attack.
In the future, the researches will focus on the control mechanism for Flood DDoS attacks and the time synchronization and flow aggregation for multiple LDoS attacks.
REFERENCES
[1] Steve Ragan, “Arbor Networks targeted after DDoS report (Update),” Dec 16 2010, 18:47.. http://www.thetechherald.com/article.php/201050/6571/A rbor-Networks-targeted-after-DDoS-report-Update [2] Khanna, S., Venkatesh, S.S., Fatemieh, O., Khan, F., and
Gunter, C.A., "Adaptive Selective Verification: An Efficient Adaptive Countermeasure to Thwart DoS Attacks", IEEE/ACM Transactions on Networking, 2012, 20(3):715-728.
[3] Kuzmanovic. A, Knightly. E. W, “Low-rate TCP-targeted denial of service attacks,” Proceedings of ACM SIGCOMM 2003, Karlsruhe, Germany, 2003: 75- 86.
[4] Aleksandar. Kuzmanovic, Edward W. Knightly, “Low-Rate TCP-Targeted Denial of Service Attacks and Counter Strategies,” IEEE/ACM Transactions on Networking. 2006,14(4): 683-696.
[5] M. Salagean and I. Firoiu, “Anomaly detection of network traffic based on Analytical Discrete Wavelet Transform,” 2010 8th International Conference on Communications (InfoComm), 2010: 49-52.
[6] Zhang Yong Zheng, Xiao Jun, Yun Xiao Chun, "DDoS Attacks Detection and Control Mechanisms". Journal of Software, 2012, 23(8): 2058-2072.
[7] Macia-Fernandez. G, Diaz-Verdejo. J.E, Garcia-Teodoro. P, “Mathematical Model for Low-Rate DoS Attacks Against
Application Servers,” IEEE Transactions on Information Forensics and Security, 2009, 4(3): 519 -529.
[8] Mohammed Alenezi, and Martin J Reed, “Traceback of DoS over Autonomous Systems”, International Journal of Network Security & Its Applications (IJNSA), 2013, 5(2):132-142.
[9] Mitko Bogdanoski,Tomislav Shuminoski, and Aleksandar Risteski, "Analysis of the SYN Flood DoS Attack", I. J. Computer Network and Information Security, 2013, 8:1-11. [10]Chen. Y, Hwang. K, “Collaborative detection and filtering of shrew DDoS attacks using spectral analysis,” Journal of Parallel and Distributed Computing, 2006, 66(9):1137-1151.
[11]Wu Zhijun, Yue Meng, “Research on the performance of low-rate attack,” Journal of Communications, 2008, 29(6): 87-93.
[12]Zhi-jun Wu, Minghua Wang, Haitao Zhang, Xingchen Liu, “Correlation-based Detection of LDoS Attack”, Journal of Software, 2012, 7 (10): 2341-2348.
ZhijunWu born in 1965, China. He received BS degree and Master Degree in Signal Processing from Xidan University, Xian city, China, in 1998 and 1996 individually. He received PhD degree in Cryptography and Network Security from Beijing University of Posts & Telecommunications. His main research field is Network Security, with special focus on denial of service (DoS) attacks, intrusion detection, and defense.
He is professor in College of Electronics & Information Engineering, Civil Aviation University of China (CAUC), Tianjin, China.
Guang Li was born in TianJin, 1988. He is a master candidate at Communication and Information System, Civil Aviation University of China (CAUC). His research interests include network and information security.
MengYue was born in Hebei province, China at July, 1984. He received the M.A., degree in communication and information system from Civil Aviation University of China (CAUC) in 2009.
He is currently with College of Electronics & Information Engineering Civil Aviation University of China (CAUC), Tianjin, China. In 2008, he studied in China Education & Research Network Engineering Center, Tsinghua University, China. His research was initially focused on information security and cloud computing, with special focus on denial of service attacks, intrusion detection, and defense.
HualongZheng was born in Henan province, China, 1985. He received master degree in Communication and Information System from Civil Aviation University of China (CAUC) in 2011. His research interests include network and information security