Figure 1. Fifty-three photos from Chinese trouble of freight car detection system.
Shape-Matching Model Optimization Using
Discrete-point Sampling and Feature Salience
Zongxiao Zhu
Huazhong University of Science and Technology, Wuhan, China South-Central University for Nationalities, Wuhan, China
Email: [email protected]
Guoyou Wang
Huazhong University of Science and Technology, Wuhan, China Email: [email protected]
Abstract—The component classification and potential fault region locating in the full-automatic inspection system of a freight train require a computer vision method with the ability of classifying quickly and locating precisely, addressing anti-nonlinear deformations, and being able to perform extensible learning. Inspired by these requirements, this paper specifically optimizes the three elements of a shape-matching model, including the scene map, the shape template, and the matching. Our method uses a discrete-point sampling map (DPSM) as an intermediate representation, to enhance the stability of the scene maps, uses the criterion function based on feature salience to select a better shape-template group, and matches hand-sketches with regions in DPSMs to reduce the difficulty of the matching calculation. Based on our optimized shape-matching model, we set up a new procedure for component classifications and potential fault region locating in the full-automatic inspection system for freight trains, which has been applied successfully on more than 10 parts of freight train cars in the railway for more than 2 years. The results of anti-noise testing in laboratory and daily operation at several inspecting stations show that our method has a strong ability to survive with nonlinear deformations, and has a good extensibility to be used with different parts, which meet application demands for the full-automatic inspection system.
Index Terms—TFDS; shape matching, discrete-point sampling, shape template, feature salience
I. INTRODUCTION
The research in this paper is inspired by a series of bottleneck problems that occur when Chinese freight train car inspections are changed from half-automatic mode to full-automatic mode. Currently, most freight car inspections are half-automatic with a substantial manual portion. The “Trouble of Freight Car Detection System” [1]-[2](TFDS, official name)that is equipped in
Chinese railways uses five cameras to take 53 part photos (sized 1400 × 1024) from the two sides and bottom of one freight car, where faults might emerge. Among these photos, two cameras from each side take 7 photos each, and three cameras from the bottom side take 13 photos each, as Fig. 1 shows. When these photos are taken, the freight train is running normally, and the size, distance, angle, and shooting time for each part’s photos are relatively unified. There will be 2000-3000 photos that are taken from one freight train according to the number of cars that it drives. All of these photos will be examined, and fault judgments will be made in 10 minutes by 4 freight train surveyors in a detecting office. If any fault is found, then the surveyors are to report it without delay. If the fault is severe enough to endanger the running safety of the freight train, then the freight train should be stopped, and outdoor surveyors will be sent for further detection to confirm the fault and to handle it. Full-automatic inspection attempts to use computer vision partly or completely instead of the work of the four freight train surveyors, to reduce their labor intensity, improve the detection quality and efficiency, and better ensure the security and celerity of the railway transport.
Figure 2. The basic procedure of inspection on freight cars
Manuscript received August 1, 2013.
This work was supported by Wuhan Huamu Science and Technology Company.
Regardless of whether the half-automatic inspection with manual work or full-automatic inspection with computer vision is used, their basic procedures are the same one shown in Fig. 2. For different components, one part might correspond to different fault regions and types, and the component type in the current parts photo should be recognized first. Next, one or more potential fault regions are located, and a fault judgment will be performed with these potential fault regions. The bottleneck problems mentioned above are the component classification and the locating of potential fault regions, which can be divided into the following three aspects: A. Classifying Precisely and Locating Quickly
Because the railway transportation in China is developing very quickly, many different ages and types of freight cars, with different component types, run at the same time. New components with new fault regions and types are used every year. Before freight train surveyors in offices were using TFDS to detect faults manually, they were outside surveyors who have been inspecting and repairing all types of freight car faults for more than five years. These surveyors were very familiar with all the potential fault regions in every type of freight car and its components. As a result, component classification and the locating of potential fault regions in the current parts photos can be accomplished quickly and precisely with a single glance at the photo, which ensures that thousands of photos can be inspected in 10 minutes. Fig. 3 shows five types of components in the wheel parts; it can been observed that different types of components might correspond to different locations and that there could be different numbers of potential fault regions, while the faults and their judgment methods could be the same. If computer vision can classify components quickly and can locate potential fault regions as precisely as human do, then the accuracy of fault detection will improve greatly with a decrease of the missing recognition rate and the false acceptance rate.
B. Robustness to All Kinds of Interference
The relative unified shooting conditions of the TFDS guarantees that there will be no large geometric transformations (e.g., translation, rotation, scaling) with the components in the photos. However, after running in the open for a long time, factors such as noise, all types of spots, strong reflected light, articulations and occlusions make the details of the photos from the same component of the same part different from one another, and no identical photos can be found, although they retain a general similarity. The trained surveyors have strong adaptability to such nonlinear deformations, which are much more challenging for computer vision than for geometric transformations [3]. Fig. 4 shows several common nonlinear deformations types applied to wheel parts.
C. Easy to Extend
Humans have an excellent capacity for extensible learning. If there is a new component with a new potential fault region, then the surveyors can quickly master it within a short training time. While for a computer vision system that has been operated in the field, such a change could mean that the system should be ended and sent back to its developer for updates and re-debugging before operating it again, which poses an obstacle to popularizing a full-automatic inspection system for freight trains. In fact, most of the faults in a new potential fault region that correspond to a new component are old and detectable faults. If the method for component classification and potential fault region locating can be extended to be compatible with a new component type and a new potential fault region, then the fault can be judged by the available judging program. Thus, the method of components classification and potential fault region locating in a full-automatic inspection system of a freight train should also be good at extensible learning, to quickly adapt to a freight train’s component upgrading.
(a) (b) (c) (d) (e) Figure 3. The component’s type and its corresponding potential fault regions. Among which there are square frames with potential fault regions; the
red lines are salient hand-sketches that will be discussed later. (a) Wheel component I; (b) wheel component II; (c) wheel component III; (d) wheel component IV; (e) wheel component V.
(a) (b) (c) (d) (e)
In summary, component classification and potential fault region locating in the full-automatic inspection system of a freight train require a computer vision method with the ability of classifying quickly and locating precisely, addressing anti-nonlinear deformations, and being able to perform extensible learning. Inspired by these requirements, this paper specifically optimizes the three elements of a shape-matching [4]-[5] model, including the scene map, the shape template, and the matching. Based on our optimized shape-matching model, we set up a new procedure for component classifications and potential fault region locating in a full-automatic inspection system for freight trains, which has been applied successfully on more than 10 parts of freight train cars in the railway for more than 2 years. The experiments using random noise and salt noise added to wheel parts repeatedly prove that our method has a robust ability to address anti-nonlinear deformations. In addition, our shape-template drawing and learning method is simple and convenient and can be adjusted by various detecting offices according to the actual situation of the passing freight cars. Thus, our method has an excellent capability for extensible learning.
This paper is organized as follows. Section II presents related studies. Section III introduces our optimization of a shape-matching model. Section IV describes the results of our experiments. Section V offers our discussion and conclusions.
II.RELATED STUDIES
Shape matching, which uses object regions or boundary information to retrieve and locate an object, is in best agreement with how the human eye recognizes and distinguishes objects. Thus, this problem has been widely studied by many scholars in the fields of image processing and computer vision for a long time. There are mainly two categories of shape matching: edge-based methods [6] and region-based methods [3]. Edge matching traditionally requires explicit edge correspondence, while edge detection is a difficult classification decision that is also sensitive to noise and illumination changes. Region matching gives edge matching with no need for point-to-point edge correspondence and is more robust to local-shape distortions and occlusions. However, many important shape details are absent, and it is difficult to extract a shape reliably and to represent or match shapes precisely when complex shapes are present. Because regions have closed boundaries, they do not adapt easily when matching open image curves.
Geometric transformations (e.g., translation, rotation, scaling) and nonlinear deformations (noise, articulation and occlusions) are the main problems that make shape matching difficult. Currently, many studies focus on how to improve the invariant ability of shape templates with geometric transformations, while there is less research on nonlinear deformations. Deformable template [7] achieves invariance to location, rotation, and moderate scale changes by a parameterized transformation that is applied to the prototype to deform it; this technique is
widely used in the representation and recognition of handwritten digits [8], vehicle segmentation and classification [9], and object tracking [10]. Wang [3] proposed a novel shape descriptor by computing the height functions of the sample points of a given contour, which is not only invariant to geometric transformations but also insensitive to nonlinear deformations because of noise and occlusion. Ferrari [11] used grouped edge fragments as intermediate representations. These grouped curves have more specificity and fewer potential matches than individual edge fragments yet are still relatively easy to match, and they occur often enough to survive occlusions and detection failures. Wang [6] avoids point-to-point edge correspondence by matching shapes in an over-segmentation map, which leads the system to be robust to small shape variations and spatial shifts.
Unlike edge matching between edges or region matching between regions, in this paper, out shape template is a hand-sketch and our matching is conducted between the hand-sketch and a region in a discrete-point sampling map (DPSM) [12]-[13] that is obtained by sparse sampling [14], which brings robust and efficiency to the classification and locating while sacrificing a small amount of accuracy of the locating. Traditionally, sparse sampling in shape matching is performed with a shape template, which reduces the search space but also decreases the overall accuracy of the shape description and adds a risk of aliasing [6]. Our sparse sampling is conducted on scene maps, and the DPSM using this approach corresponds more to the intuitive impression of an initial image in human brains, which can automatically accentuate the basic information and reject the abundant details such as noise, texture and uneven illumination conditions. Matching between a hand-sketch and a region combines the advantages of local edge representations and global region robustness and has sufficient shape description accuracy for classification, which not only can be robust to small shape variations and spatial shifts but also can have strong toleration for nonlinear deformations.
judgment error statistically, using the minimum classification error criterion. Learning based on structural salience can be easily conducted with a small number of samples, while the correcting rate of classification is less than probabilistic salience. Probabilistic salience can make a better correcting rate of classification with a large number of learning samples in every class. In this paper, we define a criterion function that is based on structural salience and that has values from 0 to 1, which makes salience measurement values from different shape templates clear compared. With our method, the shape templates that have a better discriminating ability can be selected simply and efficiently, which can satisfy the demand for extensible learning.
If there are serious geometrical transformations with objects of interest, such as rotation, scaling and translation, it is difficult to find point-to-point edge correspondences. Thus, some complex algorithms, such as dynamic programming [3], binary search tree structure of weak classifiers [5], and generic probabilistic algorithms based on random sampling [4] are used to improve the accuracy of the matching. For shapes that have small distortions and spatial shifts, the difficulty of finding high quality point-to-point shape correspondences decreases, which makes shape matching easier. For example, Chamfer matching [17] and Hausdorff-distance [18] matching compute edge correspondences that are purely based on the Euclidean distance between the edge points. However, these approaches are that they rely on the completeness and accuracy of edge detection, which cannot be guaranteed for factors such as unknown objects that occur, occlusions, movement, background changes and noise interference. The method proposed in this paper is based on a DPSM. If there is a region in a specific map that could contain a specific shape template (or a hand-sketch), then the initial image could contain this shape template with a high probability, and the similarity calculated by the density is higher, which greatly accelerates the process of classification and locating, while accommodating to some of the nonlinear deformations.
In conclusion, there are three main factors that should be considered with a shape-matching model: the stability of the scene maps, the discrimination of the shape templates, and the difficulty of matching. Our method uses the DPSM from sparse sampling as an intermediate representation, to enhance the stability of the scene maps, uses the criterion function based on feature salience to select a better shape-template group, and matches hand-sketches with regions in DPSMs to reduce the difficulty of the matching calculation. Our method can be used broadly in applications where there are abundant nonlinear deformations but small geometrical transformations, such as all kinds of automatic assembly line inspection, machine part detection, and vehicle-type classification.
III.OPTIMIZATION METHODS
A. Sparse Sampling
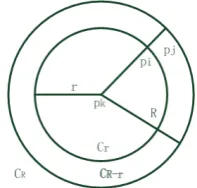
The discrete-point sampling model is defined in [13] as Fig.5 and formula (1), (2) shows.
1 1 1
( )
j R r i r i r
k P C j P C i P C i
R r r r
U P g g g
C ∈ − C ∈ C ∈ ε
−
⎞ ⎞
⎛ ⎛
=⎜ − ⎟ ⎜ + ⎟
⎝
∑
∑
⎠ ⎝∑
⎠(1)
1 ( )
( )
0 ( )
k k
k
U p T p
U p ξ ξ > ⎧
=⎨
≤ ⎩
(2)
here are three parameters in the discrete-point sampling model: the sampling radius r, the external circle radius R, and the Weber-Fechner ration ξ. The sampling radius r has an effect on three factors: the density of the discrete points in a DPSM, the map’s ability to describe the detailed information that is contained in the initial gray images, and the difficulty of subsequent matching or grouping based on the map. When we increase the sampling radius r, the discrete-point sampling map will become sparser and will have less detailed information and sampling time, and it will become more difficult to match or grouping. The external circle radius R determines how strongly the curvilinear structures can be enhanced in a DPSM, with an effect on its sampling time and its ability to suppress interference from noise and texture. The larger its value is, the farther away from the real edge is the discrete points that are generated and the more salient is the curvilinear structure that is gathered by these points, which is more beneficial for curve shape matching and curvilinear structure detection. Meanwhile, formula (1) can be perceived as a mean filter, and the external radius R can be perceived as the window’s size. The larger its value, the better is its inhibiting ability toward interfering noise and textures, and the larger the amount of time that is needed for calculating the discrete points. The sampling time grows linearly with the external circle radius R, while the number of sampling points does not, which means that the effect of filtering is enhanced. Taking all of these factors into account, including the salient level of the curvilinear structures, the difficulty of the shape matching, and its sampling time, we use r=2 and R=15 in this paper for calculating a DPSM, in which the subsequent shape matching is mainly conducted. The Weber-Fechner ratio ξ affects the describing ability of the details in an initial image by a DPSM and its inhibiting ability toward interfering noise and textures. These two abilities restrict each other. The larger the value of ξ is, the weaker its ability is for describing the details in the initial images with a better inhibition ability. In practice, there is no need to select a Weber-Fechner ratio ξ that corresponds to the human
eyes exactly. If the entire photograph is too dark to identify the details, then ξ can be decreased to increase the detailed information, which is contrary to the physiological properties of the human eye. If the photograph has too many details and contains a substantial amount of noise, then ξ can be increased to reduce unnecessary information. By experimentation, we choose ξ=0.05 for all of the subsequent applications in this paper, which corresponds to the human eye in a circumstance that has a very high or very low brightness. B. Shape Matching
Shape matching will be conducted with hand-sketches in DPSMs from sparse sampling, and similarities are calculated among them by density estimations [33]. The introduction of prior shape information helps to detect objects in the presence of strong occlusions and, at the same time, helps to reject undesired contours, while it has a stronger immunity to noise and blurring. Meanwhile, DPSMs are quite fit for performing density estimation with hand-sketches. If there is a belt-shaped region that has clustered discrete points in the map can contain a hand-sketched shape, this shape is more likely to exist in its initial image. We define a similarity operator for performing density estimation with hand-sketches in DPSMs, as formula (4) shows.
1
( )
Mk k
S p
N
M
M
λ
=
=
∑
= (4)In formula (4), M is the total number of points in a hand-sketch, pk is the present point in the hand-sketch, and N is the total number of points in the hand-sketch that have responses with the belt-shaped region in the DPSM. The response is defined by the density function S, as follows:
8
1
( ) 1
( ) 2
( )
0
k k
k
I p
or C p
S p
else
=
≥
⎧
=
⎨
⎩
(5)where I(Pk)=1 means that there is a pixel that corresponds to pk in the DPSM, and C8(pk)≥2 means that
there are two pixels that are located at 8 connected directions around the position that corresponds to pk. Both of these two situations can be considered to have corresponding points with pk in the DPSM.
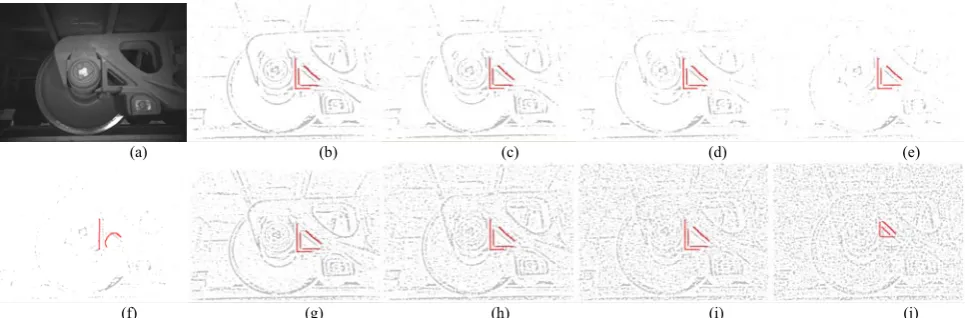
By this definition, our method avoids the requirement of explicit point to point correspondence by edge matching and has a strong immunity to small deformations and noise. To prove this concept, we add random noise and salt noise at different levels in Fig. 3 (a) and test our shape-matching method by recording the similarity λ. The effects of random noise and salt noise with DPSMs are shown in Fig. 6 (b)-(j). Only when the noise-signal ratio is decreased to less than 15 dB from these two types of noise will the shape matching fail, which means that our shape matching method has a strong anti-noise ability.
In this paper, a hand-sketch’s data are stored as follows: the absolute coordinate of the starting point (4 Bytes) + the extended direction of the starting point (2 Byte) + the extended lengths of the starting point (2 Byte) + the relative coordinates of the sequence of the hand-sketch (4Byte × (M-1), where M is the total number of points in the hand-sketch). When a hand-sketch is drawn, its starting point must be selected carefully because its extended direction and the extended length is a necessary matching requirement, then a large number of unrelated areas can be excluded and the matching speed improves significantly.
By setting up the corresponding relationship between the shape-matching position and the potential fault region position, the potential fault region of one category of component is also located, and the results of matching and locating are shown in Fig. 3.
C. Template Optimization
As mentioned above, the difficulty of shape matching is decreased in DPSMs, while a higher discrimination of the shape template is required. Different hand-sketch’s feature salience should be measured, to allow a group of better hand-sketches to be selected for matching. Every hand-sketch can be perceived as an observer that (a) (b) (c) (d) (e)
(f) (g) (h) (i) (j) Figure 6. Shape matching test with different lever of noise. (a) Initial image (1400×1024); (b) no noise added, λ=0.970827; (c) random noise 22 dB, λ= 0.935170; (d) random noise 18 dB, λ= 0.760130; (e) random noise 15 dB, λ=0.350081; (f) random noise 14 dB, matching failed; (g) salt noise 21 dB, λ=
determines a matching feature t. In this section, the method of hand-sketch selection based on the matching feature t’s structural salience will be set up.
1. Structural salience measurement for bi-object classification with one template’s matching features
If there are two types of objects, called
ω
i andω
j, and the goal of the template’s matching feature t is to distinguish them, then a structural salience measurementt ij
S
forω
i andω
j with feature t is defined in formula (6), as follows:2 2 2
( )
1
,0
1,0
1
b
i j
i j
m m a
C t
ij
S
e
σ σa
b
⎛ − ⎞
⎜ ⎟
− ⎜ ⎟
+ +
⎝ ⎠
= −
< <
< <
(6)In formula (6),
m
i andm
j are the mean values thatcorrespond to the template’s matching feature t, and
σ
i2and
σ
j2 are the variances of t. Formula (6) indicates that the larger the value between the class variances and the smaller the within-class variances, the larger theS
ijt , which means that the more salient the feature t is, the higher the ability is to distinguishω
i andω
j. The role of the natural logarithm e in this formula (6) is to adjustt ij
S
between 0 and 1, which makes it more convenient to compare features with different value ranges. The ‘a’ is a proportional adjustment coefficient, and the ‘b’ is an exponential adjustment coefficient, and with their cooperation, the different values ofS
ijt can be adjusted to be easily distinguished. C is a notably small constant to keep the denominator from being 0. By experiments we found that when a=0.3,b=0.7, the value discrimination ofS
ijt is larger; thus, we use a=0.3,b=0.7, and C=0.0000001 in our method.2. Structural salience measurement for multiple object classifications with one template’s matching features
If there are n categories of objects, and the goal of the template’s matching feature t is to distinguish
ω
i from the other n-1 categories, then a structural salience measurement tii
S
forω
i with feature t is defined as formula (7) shows:1
1
S ,
1
n
t t
i ij
j
S
j i
n
==
≠
−
∑
(7)Formula (7) indicates that the larger the ti
i
S
, the more salient the feature t is, and the higher the ability is to distinguishω
i from the other n-1 categories.3. Salient feature group T for multiple objects
If there are several templates, and all of the matching features
t t
1,
2,"
,
t
k can distinguishω
i fromthe other n-1 categories, then every structural salience measurement ti
i
S
witht
i forω
i is calculated, and we take the feature that corresponds tomax(
tk)
i i
S
=
S
tobe the better feature for
ω
i, which is written ast
i. If thismethod is used for every category of object to select a better matching feature, then a more salient feature group T for multiple objects can be obtained. Formula (8) shows this construct:
{
1, ,
2 n}
T
=
t t
"
t
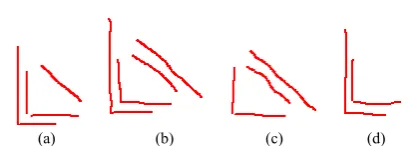
(8) 4.Example of hand-sketch template optimization
(a) (b) (c) (d) Figure 7. Four hand-sketches of wheel component type I with the structural salience measurements. (a) Hand-sketch I, S1t1=0.994; (b) hand-sketch II, S1t2=0.944; (c) hand-sketch III, S1t3=0.765; (d) hand-sketch IV, S1t4=0.860 It can be perceived that among these four hand-sketches, S1t1from hand-sketch I is the highest, and hand-hand-sketch I can best distinguish wheel type I from the other wheel types in theory. All of these results are based on 1000
wheel part images, with five types randomly taken from a TFDS station, with each type having 200 images.
(a) (b) (c) (d) (e) Figure 8. A salient hand-sketch group for the wheel part’s five component
types. (a) Wheel component I’s hand-sketch, S1=0.994; (b) wheel component II’s sketch, S2=0.881; (c) wheel component III’s hand-sketch, S3=0.684; (d) wheel component IV’s hand-hand-sketch, S4=0.626; (e) wheel component V’s hand-sketch, S5=0.486. The image database is the
The problem of component classifications and potential fault region locating with one TFDS image can be solved by shape matching that is based on hand-sketch templates, while the key point is how to improve these hand-sketch templates’ qualities, which make them perform better at distinguishing the present category of components from other categories.
In this paper, we take the wheel component I in Fig. 3 (a) as an example to illustrate our detailed method. For a special component type, more than one hand-sketch can be drawn, as Fig. 7 shows, and formula (7) is used to calculate the structural salience measurement for this component type. The hand-sketch with the highest ti
i
S
is chosen as the shape template, and the accuracy of the component classifications and potential fault region locating can be improved by this way.We use the same method with every wheel’s type, and a salient hand-sketch group can be obtained, as Fig. 8 shows. Based on this salient hand-sketch group, a shape-template library is established, and the similarity λi of every hand-sketch is calculated with every testing image, using formula (4). The type of wheel component and its potential fault region in the present image are determined by the hand-sketch with the highest similarity λi.
IV.EXPERIMENTS AND RESULTS
In this section, we will compare our method with several classical template matching methods, and we will test its performances in classifying and locating, addressing noise. We will use four experiments, including matching comparison, classification test, anti-noise test and extensibility test. Our test environment utilizes an Intel Core i5-2540 2.60GHz CPU,4 GB RAM, and
VC++2010.
Fig. 9 shows the calculated results for the similarity λi using the five types of hand-sketches of the wheel components in Fig. 8. It can be perceived that these five types of hand-sketches have a strong discriminative ability, which can classify wheel components by directly comparing their similarity λi.
Using the method proposed in section 3 of this paper, we conduct a classification test with 7382 wheel part images from 143 freight cars passing through a TFDS station on a single day. The matching area is restricted to a 256×128 region around the absolute coordinate of each hand-sketch’s starting point, which not only decreases significantly the computational complexities of generating DPSMs and shape matching but also provides some adaptation for geometric transformations from varying the speed, camera vibration and different shooting times.
The test results are recorded in table II, where the total classification accuracy is 99.39%, and the average time for each image is no more than 40 ms, which means that 25 frames per second can be achieved. From the analysis of table II, we can see that, with the five templates in Fig. 10, the recall and accuracy rate of the components of types I, II, and III, which hold 90% of all of the types of
TABLEII
CLASSIFICATION RESULTS OF A WHEEL PART BASED ON OUR METHOD Detected
Real Type I Type II Type III Type IV Type V Real Sum Recall (%) Proportion (%)
Type I 5004 0 3 5 0 5012 99.84 68.01
Type II 0 1398 0 0 1 1399 99.93 18.98
Type III 0 0 216 0 0 216 100.00 2.93
Type IV 0 1 0 226 2 229 98.69 3.11
Type V 0 19 3 11 480 513 93.58 6.96
Detected Sum 5004 1418 222 242 483 7369 100.00
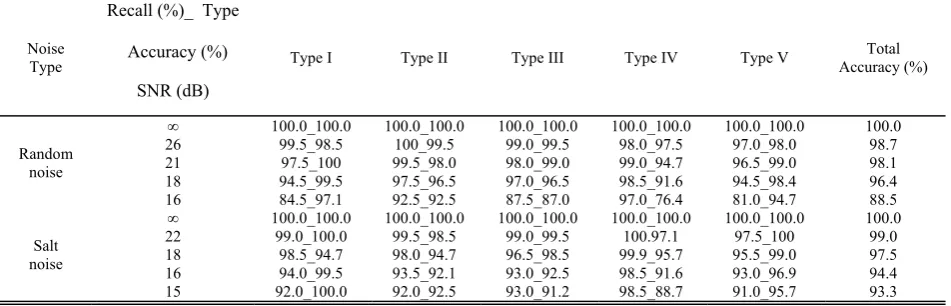
Accuracy (%) 100.00 98.59 97.30 93.39 99.38 99.39 TABLEIII
CLASSIFICATION RESULTS WITH RANDOM NOISE AND SALT NOISE
Noise Type
Recall (%)_ Type
Accuracy (%)
SNR (dB)
Type I Type II Type III Type IV Type V Accuracy (%) Total
Random noise
∞ 100.0_100.0 100.0_100.0 100.0_100.0 100.0_100.0 100.0_100.0 100.0
26 99.5_98.5 100_99.5 99.0_99.5 98.0_97.5 97.0_98.0 98.7
21 97.5_100 99.5_98.0 98.0_99.0 99.0_94.7 96.5_99.0 98.1 18 94.5_99.5 97.5_96.5 97.0_96.5 98.5_91.6 94.5_98.4 96.4 16 84.5_97.1 92.5_92.5 87.5_87.0 97.0_76.4 81.0_94.7 88.5 Salt
noise
∞ 100.0_100.0 100.0_100.0 100.0_100.0 100.0_100.0 100.0_100.0 100.0
22 99.0_100.0 99.5_98.5 99.0_99.5 100.97.1 97.5_100 99.0
18 98.5_94.7 98.0_94.7 96.5_98.5 99.9_95.7 95.5_99.0 97.5 16 94.0_99.5 93.5_92.1 93.0_92.5 98.5_91.6 93.0_96.9 94.4 15 92.0_100.0 92.0_92.5 93.0_91.2 98.5_88.7 91.0_95.7 93.3
0 0.2 0.4 0.6 0.8 1 1.2
1 326394 125 156 187 218 249 280 311 342 373 404 435 466 497 528 559 590 621 652 683 714 745 776 807 838 869 900 931 962 993
components, are above 99.8%, while the recall and accuracy rate of the components of types IV and V, which hold 10% of all of the types of components, are lower. In the future, the accuracy of these two components can be further improved by drawing supplementary distinguishable sketches of component types IV and V and calculating the combined similarity with one component’s two hand-sketch templates.
To further prove our method’s robustness to noise, we choose another five categories of components in the wheel parts, with 200 images each, which can be classified correctly without adding noise. Random noise and salt noise with different signal-to-noise ratios are placed into these images individually, and the anti-noise ability is checked by calculating the recall and accuracy rates. The test results in table III show that our method has a very strong anti-interference ability with random noise and salt noise, especially with salt noise, which means that our method can have excellent performance with many types of interference as shown in Fig. 4. Our field tests also have proven this conclusion.
V.DISCUSSION AND CONCLUSIONS
The whole automation of freight car fault detection requires computer vision for the ability to classify quickly and perform locating precisely, to address anti-nonlinear deformations and to accomplish extensible learning, similar to what human inspectors are capable of. Traditional methods mainly include region matching and edge matching. When regions have closed boundaries, they do not adapt easily when matching open-image curves. To avoid explicit edge correspondence, edge matching introduces complex methods, such as edge grouping or segmentation averaging, to adjust the possible corresponding areas into a more appropriate level and to perform distance calculations or dynamic searches. Many researchers focus on how to improve the robustness of a template with geometric transformations, while seldom analyzing and evaluating its separability. Extensible learning of a new category is not considered sufficiently, and research on nonlinear deformations is relatively non-satisfactory.
In this paper, the three elements of a shape-matching model, including the scene map, the shape template, and the matching, are all optimized to solve the problems mentioned above. For scene maps, this paper establishes a sparse sampling operator that is based on the Weber-Fechner law, which reflects how human eyes perceive brightness differences and change a gray image into a DPSM as an intermediate representation. In a DPSM, large-scale structural features are enhanced as belt-shaped regions, and details of noise and textures are inhibited. Compared with the typically used thresholding segment map and edge map, a DPSM corresponds more to the intuitive impression of an initial image in human brains, which can automatically accentuate the basic information and reject many details regarding noise, texture and uneven illumination. In essence, the sparse sampling in our method is a fixed grid sampling with a local scale parameter. The Weber-Fechner ratio ξ is the
local scale parameter that improves the stability of a DPSM under different illumination and blurs conditions. Fixed grid sampling extracts both edges and their surroundings, which also enhances the stability of the intermediate representations.
For a shape template, this paper selects the template that can best represent its pattern and that differs from other patterns by drawing contours in a learning sample’s DPSM. Our method calculates their feature salience to find better templates , which imitates the initiation and improving procedures in the human brain and improves the accuracy and efficiency of classifying multiple objects.
For matching, our matching is between a hand-sketch and a region. A shape template is placed into a DPSM directly to obtain density estimation. If there is a region in the DPSM that contains the shape template, then the shape template is more likely to be in the initial image, and the calculated density estimation is higher. Our method increases the speed of classification and locating, improves the ability of addressing anti-nonlinear deformations, and is robust to small shape variations and spatial shifts.
For such applications as TFDS, the same component’s edges in a large number of images are distributed in specific areas. These edges are not fixed, are not standard, might not be continuous, and are also with no many geometric transformations caused by scaling or rotation. By artificially selecting the parts that have salient separability in a learning sample’s DPSM, and drawing a component’s contours in these parts as hand-sketches, those hand-sketches can be projected into test sample’s DPSM. Our shape matching is a process of finding regions that might have a hand-sketch, which makes classification very quickly with enough locating precision. The results of anti-noise testing in laboratory and daily operation at several TFDS stations show that our method has a strong ability to survive with nonlinear deformations and has a good extensibility to be used with different parts, which meet application demands for TFDS stations.
ACKNOWLEDGMENT
This work was supported in part by the Natural Science Foundation of China under Grant 60975021.
REFERENCES
[1] Z.H. Liu, D.Y. Xiao and Y.M. Chen, “Displacement fault detection of bearing weight saddle in TFDS based on hough transform and symmetry validation,” in 9th International Conference on Fuzzy Systems and Knowledge Discovery (FSKD),pp. 1404-1408, Chongqing, China, May. 2012.
[2] X.D. Yang, L.J. Ye and J.B. Yuan,“Research of Computer Vision Fault Recognition Algorithm of Center Plate Bolts of Train,” in 1st International Conference on Instrumentation, Measurement, Computer, Communication and Control,pp.978-981, Beijing, China, Oct. 2011. [3] J.W. Wang et al., “Shape matching and classification using
[4] Deng, Lawrence Y., et al. "Real-time hand gesture recognition by shape context based matching and cost matrix." Journal of Networks 6.5 (2011): 697-704. [5] Chu, Jun, and Guimei Zhang. "Match Planar Curve Based
on Affine Invariant." Journal of Software 7.1 (2012): 9-16. [6] H.Z. Wang and J. Oliensis, “Rigid Shape Matching by
Segmentation Averaging,” IEEE Trans. Pattern Anal. Mach. Intell., vol. 32, no. 4, pp. 619-635, Apr. 2010. [7] A.K. Jain, Z. Yu and S. Lakshmanan, “Object matching
using deformable templates,” IEEE Trans. Pattern Anal. Mach. Intell., vol. 18, no. 3, pp. 267-278, Mar.1996. [8] A.K. Jain and D. Zongker, “Representation and
recognition of handwritten digits using deformable templates,” IEEE Trans. Pattern Anal. Mach. Intell., vol. 19, no. 12, pp. 1386-1390, Dec.1997.
[9] Qi X, Ji J, Han X. Vehicle Type Classification by Acoustic Waves with Dimension Reduction Technique[J]. Journal of Computers, 2013, 8(3): 685-692.
[10]Yu Zhong, A.K. Jain and M.P. D. Jolly, “Object tracking using deformable templates,” IEEE Trans. Pattern Anal. Mach. Intell., vol. 22, no. 5, pp. 544-549, May.2000. [11]V. Ferrari, et al., “Groups of Adjacent Contour Segments
for Object Detection,” IEEE Trans. Pattern Anal. Mach. Intell., vol. 30, no. 1, pp. 36-51, Jan.2008.
[12]Zhu, Zongxiao, Guoyou Wang, and Jianguo Liu. "Object detection based on multiscale discrete points sampling and grouping." Sixth International Symposium on Multispectral Image Processing and Pattern Recognition. International Society for Optics and Photonics, YiChang, China,2009. [13]Zhu, Z., et al., “Fast and Robust 2D-Shape Extraction
Using Discrete-Point Sampling and Centerline Grouping in Complex Images”. Image Processing, IEEE Transactions on, 2013. 22(12): p. 4762-4774.
[14]T.V. Pham and A.W.M. Smeulders, “Sparse representation for coarse and fine object recognition,” IEEE Trans. Pattern Anal. Mach. Intell., vol. 28, no. 4, pp. 555-567, Apr. 2006.
[15]Wang H, Dang Y, Ke H, et al. A Method of Target Region Detection Based on Multi-channel Weighted Visual Attention[J]. Journal of Computers, 2013, 8(10): 2478-2482.
[16]Tie Liu, et al., “Learning to Detect a Salient Object,” IEEE Trans. Pattern Anal. and Mach. Intell., vol. 33, no. 2, pp. 353-367, Feb. 2011.
[17]Zhen-Xue Chen, et al., “Automatic License-Plate Location and Recognition Based on Feature Salience,” IEEE Trans. Veh. Techno., vol. 58, no. 7, pp. 3781-3785, Sep. 2009. [18]G. Borgefors, “Hierarchical chamfer matching: a
parametric edge matching algorithm,” IEEE Trans. Pattern Anal. Mach. Intell., vol. 10, no. 6, pp.849-865, Nov.1988.
[19]Dong-Gyu Sim, Oh-Kyu Kwon and Rae-Hong Park, “Object matching algorithms using robust Hausdorff distance measures,” IEEE Trans. on Image Process., vol. 8, no. 3, pp.425-429, Mar.1999.
[20]J.H. Shen, “On the foundations of vision modeling I. Weber's law and Weberized TV restoration,” Physica D Nonlinear Phenomena, vol. 175, no. 3-4, pp. 241-251, Feb. 2003.
[21]A.M. Peter and A. Rangarajan, “Maximum Likelihood Wavelet Density Estimation With Applications to Image and Shape Matching,” IEEE Trans. on Image Process., vol. 17, no. 4, pp. 458-468, Apr. 2008.
Zongxiao Zhu received the BS degree and the MS degree in
electrical and electronic engineering from Xi’an Jiaotong University, Xi’an, China in 2000 and 2003, respectively. He is currently pursuing the Ph.D. degree in control science and engineering at the Institute for Pattern Recognition and Artificial Intelligence, Huazhong University of Science & Technology, Wuhan China.
From 2003 to 2004, he was an engineer with SuZhou Shihlin Electric&Engineering Co., where he was in charge of designing small power converters (on the market in 2004). Since 2004, he has been a faculty of College of computer Science, South-Central University for Nationality (SCUN), Wuhan, China. In 2007, he founded the Information Processing Laboratory for Minority Language (IPLML) in SCUN and began to manage a multidisciplinary research team aiming at using information technology to salvage, protect and broadcast endangered minority cultures. His research interests include image processing, object detection, and endangered minority culture’s protection with information technology.
Mr. Zhu is a member ACM and a member of Chinese computer federation (CCF).
Guoyou Wang received BS degree in Electronic Engineering