International Journal in Physical & Applied Sciences (Impact Factor- 3.960)
THE PRE-DOSE EFFECT IN NATURAL ROCKS WITH HIGH-LEVEL OF PHOSPHATE
N Al-Hammad 1, 2*, C.Soliman1, 2, 3,A. Al-Muqrin 1, 2, and E Al-Mogait 1, 2
1
Department of Physics, Faculty of Science, Princess Nora University, Riyadh, Kingdom of Saudi Arabia.
2
Deanship of scientific Research Princess Nora University, Riyadh, Kingdom of Saudi Arabia. 3
Department of Physics, Faculty of Science, Ain shams University, Cairo, Egypt.
Abstract-In the present investigation we have investigated sensitization of a natural phosphate sample, as a function of pre-gamma dose and post-irradiation annealing treatment at a test dose of
1Gy. The sensitization stabilized for pre-doses higher than 1kGy.Apre-gamma dose of 1kGy followed
by 450oC post-irradiation annealing treatment yielded the maximum sensitization factor of 22.The
sensitization of the thermal annealing treatment was estimated to be 2.33.The position and shape of
the thermo luminescence glow curves in unsensitized and sensitized samples were different.
1.Introduction
Natural minerals play an important and emerging role in modern science and technology. Most of
these exhibit thermoluminescence (TL) characteristics and facilitates to understand various damage
and safety processes during irradiation accidents[1]. Thermal and radiation treatments have a
profound influence on the thermoluminescence properties of the most of the TL sensitive
phosphors. The pre-dose feature has been effectively utilized in various applications; (i)
archaeological dating, (ii) retrospective dosimetry, (iii) authenticity testing, (iv) firing temperature
measurements etc [2-4].
By the pre-dose, one mean the change of sensitivity, namely the response to a given test dose, by a
heavier irradiation, followed by a thermal activation. Charitids et al. [5] studied the dependence of
the TL dose response on the pre-dose delivered to the sample.Chen et al [6] and Charitids et al. [7]
showed the pre-dose conditions, also the authors showed the effect of high pre-dose on
superlinearity. Since many minerals such as phosphate, phosphate and quartz invaluable in the
industry because of their combination of physical and thermal properties. The pre-dose effect first
study on quartz [5-12] and then expanded to other materials [13-15]. The pre-dosed TL signal has
been useful in case of applications involving low dose equivalent dose measurements, few tens of
mGy to a few Gy. This happens due to early onset of saturation in case of R-canters, reservoir
centers. So the growth curve, sensitization with dose, initiates linearly with an increase in
dose up to a few grays and saturates thereafter. The simulation results also showed that the
pre-dose technique can reproduce the paleopre-dose received by the sample accurately in the low pre-dose
region of 0–2 Gy[16]. The nature of the thermal activation curve (TAC), essentially, reflects the
distribution in activation energy of the reservoir traps, R. As the activation temperature is increased
more and more holes get transferred to the L canters, luminescence centers. The thermal treatment
involved in the pre-dose treatment has been reported to introduce pure thermal sensitization also
apart from it charge transferring role [17]. The sensitization process gets reversed with UV
stimulation but is restored back with subsequent thermal activation. This phenomenon is termed as
UV reversal [18].
Phosphors owe their practical importance to their property of absorbing incident energy and
converting it into visible radiations [19]. The study of absorption and emission characteristics of a
phosphor enables the understanding of electronic energy levels in the crystal and, in turn, the design
of new phosphors of practical relevance .TLD badges, which carry specially tuned phosphormaterial,
International Journal in Physical & Applied Sciences (Impact Factor- 3.960)
the ideal characteristics of a good TLD phosphor [20, 21]. Phosphates and halo-phosphates, used for
luminescence applications, were also explored for their suitability as TLD materials [22, 23]. Schipper
et al [24] studied trapping of electrons in the X-ray storage phosphor, Ba3 (PO4)2: Eu, La. Seshagiri et
al [25] studied the thermally stimulated luminescence (TSL) and electron paramagnetic resonance
(EPR) properties of calcium chlorophosphates. The possible mechanism of TSL glow is proposed by
correlating the spectral characteristics and the thermal stability of the radical ions. TL of mixed rare
earth phosphate powder was studied by Michel et al [26], who observed that the TL emission
spectra of the phosphor mainly composed of characteristic line transition of rare earth ions. Calcium
phosphate crystals also are candidate materials for TLD applications [27].
The purpose of the present paper is to study the TL sensitization characteristics of natural
phosphate. The fundamental features of the sensitization procedure can be divided into three parts:
Part 1.Study of the activation temperature.
Part2. Study of the activation dose.
Part3. Study of the annealing time.
2. Experimental
phosphate in powder form (particle size 100 µm) was provided by Astronomy and Geophysics
Research Institute, King Abdulaziz City for Science and Technology (KACST) in Riyadh and originated
from Hazm Al Jalamid area, in the northern region of Saudi Arabia. Its chemical formula is (P2O3).
The sample was washed with 1N hydrochloric acid; after that distilled water was used to remove the
HCl and inorganic impurities. The sample was then allowed to dry .Magnetic particles were removed
using Franz Magnetic Separator. After washing, drying and removal of magnetic particles, the
phosphate sample was encapsulated in plastic capsules and kept in dark untilmeasurements were
achieved.
TL measurements were monitored using a Harshaw 3500 TLD reader. Light pulses were detected by
the photomultiplier tube provided with a narrow band blue filter plus Schoot BG39 glass filters of
blue- violet transmittance band. A linear heating rate of 5οCs-1was chosen; heating the sample from
room temperature up to 400oC. The incandescent background was measured then subtracted from
the data. To minimize the statistical error, five aliquots each of 7 mg were used for each
measurement. All irradiations and measurements were performed in King Saud University, Saudi
3. Results and discussion
3.1. Natural TL
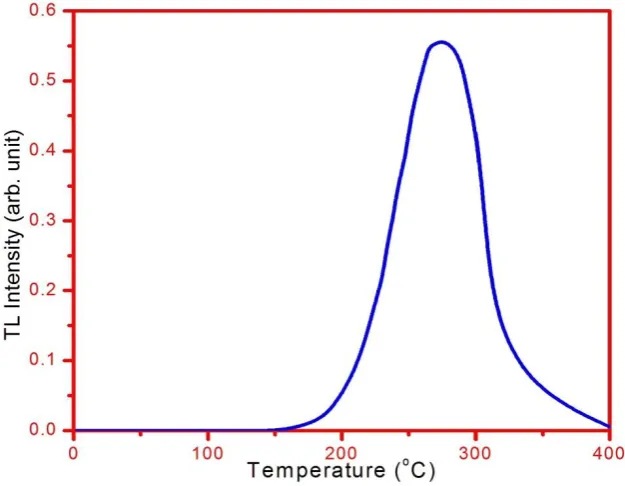
The phosphate showed a strong natural TL signal during the first cycle of heating to 400C
(Fig. 1). With a heating rate of 5Cs-1, the glow curve showed one peak at 275C.
Fig. 1. The TL glow curve of natural phosphate.
3.2. Sensitization
The sensitization of TL, is the change of sensitivity of a sample to a given test dose, resulting from its
exposure to a prior irradiation followed by a thermal annealing. The effect was first observed by
Cameron [28].
The investigated material was first fired at 1000C for 9 h to ensure that the deep traps are emptied,
and then Fleming's sensitization technique [29] was achieved. The fundamental features of the
sensitization procedure can be divided into three steps:
i) Study of the activation temperature, ii)-Study of the activation dose, iii) - Study of the annealing
time.
i)The activation temperature was studied in the following way:
a) Fired aliquots (at 1000C for 9 h) ideally of equal weight were given a test dose of 0.01Gy to
measure So.
International Journal in Physical & Applied Sciences (Impact Factor- 3.960)
c) The previous aliquots were then heated at a certain temperature beginning at 250 oC and ending
by 700 oC.
d) After each heating, when cooled a test dose (1Gy) was given to measure S. The sensitivity factor
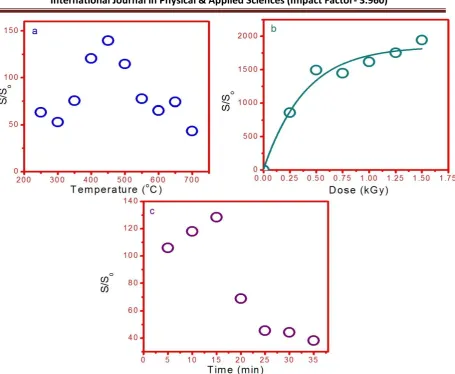
S/Sowas then calculated at different temperatures in the above mentioned range (Fig.2a). For the
investigated material, 450 oC became the purification temperature for pre-dose thermal activation.
ii).The activation dose was studied in the following way:-
a) A series of aliquots of fired phosphate, were given a single pre-dose of gamma radiation in the
range from 0.25kGy to 1.5kGy.
b) The aliquots were then heated to the activation temperature 450 oC.
c)When cooled, a test dose (1Gy) is applied to the previous heated aliquots which give sensitivity S
and the ratio S/Soshows a plateau at the pre-dose of 1kGy. Fig. 2b shows the variations of the ratio
S/Sowith the pre-dose.
iii)The effect of annealing time on sensitivity is studied as follow: Powder aliquots of fired phosphate
were given a dose of 1kGy and heated at 450C to different time intervals. The aliquots were then
removed and air-cooled. A test dose of1Gy was then applied, after which they were measured for TL
sensitivity. The effect of this treatment is to reduce the possibility of R center saturation and
maximize the sensitizing effect of the -ray dose [18]. The results indicate that TL enhancement is
Fig. 2. Variation of S/So as a function of: (a) activation temperature, (b) activation dose, and (c)
annealing time. For each of them the test dose was 1Gy.
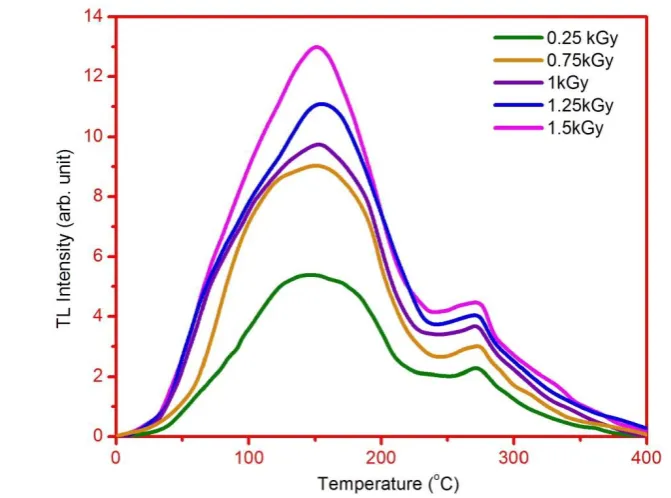
Fig. 3 showsthe variations of the glow curve with the pre-dose, it must be noticed that all the glow
curves have themain peak at 150oC and other high temperature peak at 275oC.
The previous steps can be summarized as follows: A pre-dose of 1kGy, to fired phosphate followed
by thermal activation at 450C for a period of 15min, and cooling in air is the optimized condition for
TL sensitivity enhancement. This procedure increases the sensitivity ratio S/Soby values depend upon
the test dose i.e. for a test dose of 1Gy S/So~3.6 and for a test dose of 1000Gy S/So = 56.2 .This result
can be explained by Chen [30]. He argued that the measured response to a test-dose is a
monotonically increasing function of the concentration of trapped holes in center following the large
International Journal in Physical & Applied Sciences (Impact Factor- 3.960)
Fig. 3: The variations of the glow curve with the pre-dose.
3.3 Glow curves
The glow curves of unsensitized and sensitized phosphate (Figs. 4& 5) can be explained by using the
models [18,30] as follows: unsensitized phosphate annealed at 350oC (Fig.4) and exposed to
different doses (0.1 -1000) Gy, phosphate exposed to low doses can be considered to have one
trapping state; at 150C and one recombination center. The consideration discussed here follows the
filling of the active trap 150C in the absence of the competitors, and assumes that the resulting TL
intensity is proportional to this filling. Qualitatively, at low doses the filling is linear(Fig.6a) .This is
observed in glow curves of small applied doses .At a certain dose 10Gy, the competing trap
275Cappeared,hence lesselectrons are made available to the active trap 150C. This causes a lower
filling of this trap .The transition region from linear to thesublinear would, however, appear science
this transition obviously occurs continuously. This describes thelinear –sublinear dose response
curve of unsensitizedphosphate.
TL glow curves of sensitized phosphate arepresented in Fig. 5. It is clearly indicate that
sensitizedphosphate have 4 peaks at 75oC,110oC, 150oC and 275oC.The growth of these peaks are
nearly equivalent. It is observed that the TL sensitivityofphosphate is drastically increased after
sensitization. It is also noticedthat, though the TL intensity of unsensitized and
sensitizedphosphateincreases with increase in gamma dose there is no shift in peaktemperature.
first-Fig.4 .Variation of glow curves of unsensitized phosphate with the 𝛾- dose radiation.
3.4. TL Response
TL response curves of unsensitized and sensitized phosphate exposedto different doses of gamma
rays are given in Fig. 6. The area under glow curves has been used for measuring the TL intensities.
On exposing the unsensitized phosphate to doses ranging from 0.1Gy to 1000Gy, TL dose response
of unsensitised (Fig. 5a) involved two behaviors: linear (Y = 0.3585X + 4.808) in the range 0.01 – 10
Gy thensublinear (Y= 2.4897X0.459)in the range 50–1000 Gy. Where Y corresponds to the TL intensity
and X is the given dose in Gy. The sensitized mica (Fig.5b) was found to display two linearbehavior:
International Journal in Physical & Applied Sciences (Impact Factor- 3.960)
Fig.5. Variation of glow curves of sensitized phosphate with the -radiation.
Fig.6. Growth curves of phosphate as a function of gamma dose. (a)-unsensitized
sample, (b)-sensitized sample.
3.5. Storage effects
Thereafter, they were irradiated with dose identical to that before and read out immediately after
irradiation. The stable TL signal for the aliquots exposed to 1Gy was stored in dark was found to
be~20%after a delay period of 14days (Fig.7).
Fig.7 TL fading of sensitized phosphate as a function of time at room temperature. 4. Conclusion
In this work, the sensitization characteristics of phosphatehave been studied. It is found that the
sensitization is greatlydependent on pre-dose, temperature and the duration of theheat-treatment.
A pre-dose of 1 kGy followed by heat treatmentat 450o C for 15 min yields the maximum
sensitization factor forphosphate sample. The behavior of TL glow curves priorand after sensitization
has been investigated. TL response curvesof unsensitized and sensitized phosphate showed different
behaviorwhich has been explained. The comparisonof TL glow curves and response curves of
unsensitized and sensitizedphosphate indicates that sensitization has greatly enhancedthe TL
sensitivity of phosphate.Fading study showed that the stable TL signal for the aliquots exposed to
1Gy stored in dark was found to be 20%after a delay period of 14 days.Post irradiation annealing
should be studied to reduce the fading, which will be helpful in radiationdosimetry and other
material science technology.
Acknowledgment
The authors are indebted to the Deanship of Scientific Research at Princess Nora University, for
International Journal in Physical & Applied Sciences (Impact Factor- 3.960)
References
[1] M. Singh, N. Kaur, L. Singh, Nucl. Instr. And Meth. B,276(2012) 19–24.
[2] K. Bailiff , Radiat. Meas., 23 (1994) 471.
[3] S.-H. Li, G. M. Yin, Quaternary Sci. Rev., 20 (2001) 865.
[4] D.K. Koul, K.S.V. Nambi, A.K. Singhvi, C.L. Bhat, P.K. Gupta, Appl. Radiat. Isot., 47
(1996) 191.
[5]C. Chartidis, G. Kities, C. Furetta, S. Charalambous, radiat. Prot. Dosim. 84(1999)95.
[6]R.Chen, X.H. Yang, S.W.S. Mckeevr, J.Phys.D:Appl.Phys.21(1988)1452.
[7]C. Chartidis, G. Kities, C. Furetta, S. Charalambous, Nucl. Instr. And Meth. B 168(2000)404.
[8]X.H. Yang, S.W.S. Mckeever, J.Phys.D:Appl.Phys.23 (1990)237.
[9]I.K. Bailiff, Radiat. Meas.23 (1994) 471.
[10]V.Pagonis. G. Kitis, R. Chen, Radiat. Meas.37 (2003) 267.
[11]R.M. Bailey, Radiat. Meas. 33(2001) 17.
[12]R. Chen, S.W.S. Mckeevr, Theory of Therrmoluminescence and Related Phenomena, World
Scientific Publishing Co. Pvt. Ltd. (1997) chapter 4.
[13]C. Soliman, Radiat. Eff. Defects Solids 158(2003) 667.
[14]C. Soliman, Nucl. Instr. And Meth. B 263(2007)429-435.
[15]Z P Lai and A Murray, Radiat. Meas. 41(2006) 836.
[16] V. Pagonis, E. Balsamo, C. Barnold, K. Duling, S. McCole, Radiat. Meas. 43 (2008) 1343.
[17] D.K. Koul, G.S. Polymeris, N.C. Tsirliganis, G. Kitis, Nucl. Instr.And Meth. B, 268 (2010)
493.
[18] J. Zimmerman, J. Phys. C: Solid State Phys., 4 (1971)3265.
[19] K. Madhukumar, H. Kvarma, M. Komath, T. S. Elias, V. Padmanabhan, C. M. K. Nair,
Bull. Mater. Sci.30 (2007) 527–534.
[20]A. F.McKinlay,Thermoluminescencedosimetry (Medicalphysics handbook), New York:
Taylor and Francis (1981).
[21]S. W. S.Mckeever,Thermoluminescence of solids, Cambridge: Cambridge University
Press,(1985).
[22]A. M.Band,S. J. Dhoble, R. B.Pode and B.TDeshmukh,Proc. nat. conf. on luminescence
[24]W. J.Schipper, J. J.Hamelink,E. M. Langeveld and G.Blasse ,Phys. D: Appl. Phys.
26(1993) 1487.
[25]T. K. Seshagiri, V. Natarajan andM. D.Sastry,Thermoluminescenceand its applications
(Eds) KVR Murthy et al, New Delhi: Tata McGraw-Hill (1992).
[26]P. I.Michel, J. B.Guilhot and D.Huguen, Opt. Mater. 17(2001) 409.
[27] H.Ohtaki,Y. Fukuda andN.Takeuchi,Radiat. Prot. Dosim.47 (1993)119.
[28] J. R. Cameron, Health Phys. 10 (1964) 25.
[29] S. J. Fleming, Archaeometry, 15 (1973) 13.