Physical Sciences
The Effects of Fission Gas and Radiation Collision on UO
2
Melting:
A Molecular Dynamics Simulation
Xiangyu Wang†, Bin Wu†, Fei Gao‡,*, Xin Li†, Xin Sun‡, Mohammed A. Khaleel‡, Ademola V. Akinlalu†, Fallon Laliberte†, Lauren Boldon†, and Emily Liu†,*
†Department of Mechanical, Aerospace & Nuclear Engineering, Rensselaer Polytechnic Institute, Troy, NY 12180, USA. ‡ Fundamental Science
Directory, Pacific Northwest National Laboratory, P. O. Box 999, Richland, WA 99352, USA
* Corresponding authors. E-mail: [email protected] and [email protected] and [email protected]
The melting point of Uranium Dioxide (UO2) has previously been evaluated through molecular dynamics (MD) simulations by
employing the empirical interaction potential. The interaction potential is analyzed in terms of the pure UO2 lattice, fission gas atoms
(Xenon), and radiation collisions. A preliminary study of the melting point of UO2 is presented in this paper in order to analyze the
effects of fission gas atoms and radiation collision. Utilizing molecular dynamics simulation with a two-phase method, the melting point for pure UO2 and UO2 with fission gas was observed to be 3175 K ± 12.5 K and 3150 K ± 12.5 K, respectively, as the temperature
increased from 2800 K to 3400 K. The calculated melting point for UO2 using two-phase method was close to experimental
measurements observed for the melting point. From the study of the relationship between melting point and fission gas density, the melting point of UO2 decreased while the density of Xe increased. The two-phase method also demonstrated a decrease in the melting
point of approximately 15 K/Xe gas atom. This may result from a reduction in the nucleation barrier due to the presence of Xenon. From the study of the relationship between melting point and defects generated by various primary knock-on atoms (PKAs) for different Xe concentrations, there was no direct relationship determined between the melting point of UO2 and the number of defects generated by
PKAs. However, the creation of point defects may indirectly influence the melting point, especially in the case where both fission gas and radiation collisions are included. Journal of Nature and Science, 1(7):e133, 2015.
Uranium dioxide, melting point, molecular dynamics, radiation, fission gas
1. Introduction
Uranium dioxide (UO2), the most widely used nuclear fuel, has been the subject of many studies over the years. The melting point of UO2 is
of great importance for studying the thermal properties of UO2 and is crucial for safety and reliability management of nuclear fuels in
reactors. With the development of the new generation of nuclear reactors, UO2 is exposed to high temperatures and pressures and an
intensive radiation environment. These factors increase the difficulty in experimentally evaluating the thermodynamic properties of UO2.
Computational simulation methods provide an alternative method to experimentation and allow one to study what is presently experimentally impossible.
In early work in MD simulations with different potential functions, the thermo physical properties were studied by Yamada et al. [1],
Basak et al. [2], and Arima et al. [3]. Motoyama et al. [4] studied the thermal conductivity of UO2 by using non-equilibrium molecular
dynamics simulation. Inoue [5] presented work on the thermal conductivity of uranium-plutonium oxide fuel for fast reactors. Using equilibrium and non-equilibrium MD simulations, Arima et al [6] [7] have studied thermal conductivity of stoichiometric and
non-stoichiometric UO2. Watanabe [8] et al. examined the thermal transport in off-stoichiometric UO2. Watanabe et al [9] also studied
thermal conductivity in different system sizes and in polycrystalline UO2. Ramirez et al. [10] and Terentyev [11] utilized MD simulation to
calculate the heat and oxygen diffusion in UO2. Ichinomiya [12] et al. examined the migration process of oxygen defects in UO2, and
Govers [13] [14] et al. compared different interatomic potentials for UO2 through computer simulation techniques. Some prior work has shed
light on the melting point of UO2, in particular: Arima et al. [15]
and Yakub et al. [1] evaluated the melting point in UO2 and the
melting phase transitions in stoichiometric UO2. Govers [13] [14]
et al. reviewed the melting points of UO2 in terms of different
interatomic potential function. However, there is a lack of research
concerning the calculation methods for the melting point of UO2.
In the present study, MD simulations were performed using the interatomic potentials developed by Yakub et al. [16] to study
the melting point of UO2. To facilitate a real simulation of the
environment in which the UO2 fuel exists, the present study
investigated the effect of radiation and the existence of fission gas (Xenon) atoms. Furthermore, the melting process was studied as a function of simulation time to account for the volume change in the
UO2 fuel. All the simulations were performed using the two-phase
model for comparison.
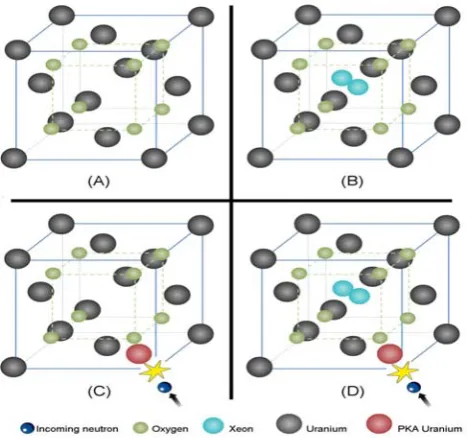
Figure 1. Script picture of four different systems that were
investigated: (A) pure UO2 lattice, (B) Xenon fission gas atoms
(blue atoms) in the UO2 lattice, (C) radiation process within the
UO2 lattice, such that the incoming neutron interacts with the
lattice, resulting in the primary knock-on uranium atom (red atom), and (D) both fission gas atoms and the radiation process occurring
2. Molecular dynamics simulation approach 2.1 Interatomic potential function
In the present study, the rigid ion model interaction potential function developed by Yakub et al. [16] was employed for the U-U, U-O and O-O interactions. The potential energy is comprised of a short-range contribution and a Coulomb energy contribution. The
short-range interionic potential is described by:
where represents the short range overlap repulsion of closed electronic shells, is the energy of covalent bonding which is
only attributed the U-O interaction, is the pair potential energy of the van der Waals attraction, and is the distance between
ions. , , , , , and are all fitting parameters. The values for those fitting parameters used in Eq. (1) are listed
in Table 1.
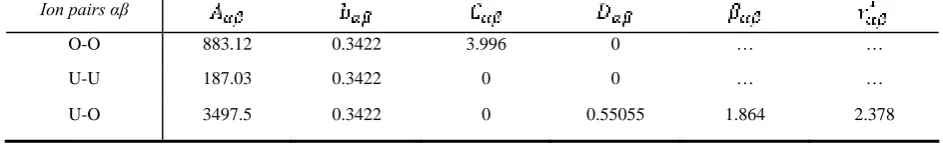
Table 1. The parameters used in the short-range interionic potential – Eq. (2) [16]. Ion pairs αβ
O-O 883.12 0.3422 3.996 0 … …
U-U 187.03 0.3422 0 0 … …
U-O 3497.5 0.3422 0 0.55055 1.864 2.378
The columbic interaction energies were calculated via Particle-Particle-Particle-Mesh (PPPM) method. The uranium and oxygen atoms have the fractional charges +2.2208 and -1.1104, respectively.
The inter-atomic potential for Xenon in UO2 was taken from Geng [17]. The Lennard-Jones model is employed for both Xe-Xe and
Xe-O interactions which is described by:
The Born-Meyer function for the potential was adopted for the Xe-U pair with the improved parameters shown in Table 2:
Table 2. The parameters used for the potentials.
Xe-Xe (LJ) Xe-O (LJ) Xe-U (BM) Xe-U (BM-fitted)
0.017 0.0099 2787 4887.7
4.29 2.50 0.41426 0.415
Since the radiation induced energetic recoil effects the simulation, the Ziegler–Biersack–Littmark (ZBL) potential was utilized to account for the short-range high-energy scattering interactions between atoms.
2.2. Molecular dynamics simulation technique for melting point
The MD simulations were carried out utilizing the LAMMPS program developed by Sandia National Laboratory [18]. The melting
point of UO2 was evaluated in terms of pure UO2, UO2 with fission gas (Xe atoms), UO2 with high energy radiation (recoil uranium atom),
and UO2 with fission gas and radiation together. The dependency of melting on the simulation time was also studied. The two-phase MD
simulation method was adopted from Arima [15] et. al.
Using the two-phase method, a solid UO2 crystalline lattice was placed next to a liquid amorphous UO2 lattice at the initial state. Solid
UO2 and liquid UO2 were equilibrated for 40,000 steps (10 picoseconds) at 300K and 4000K respectively. Figure 2 shows the system at the
initial state of two 6*6*6 UO2 unit cells for two-phase method. The subsequent MD calculations followed the same procedure to one phase
method simulation. MD simulations are performed for a series of temperatures with an isothermal-isobaric (NPT) ensemble. When the UO2
lattice reached the equilibrium state, the lattice parameter was obtained from the volume of the system. Based on the change of lattice
Figure 2. Configuration of the supercell at the initial state of two phase method with 12*6*6 unit cells. The 6*6*6 lattice at the left side was equilibrated at 300K and the right side was equilibrate at 4000K, respectively. (large green ball: uranium atoms; small white ball: Oxygen atoms). The picture was drawn by VMD.
Typical fission gas bubble size and density found in D. Schwen’s work [19] were employed for the configuration of the UO2 lattice
with fission gas. The properties of the bubble atoms are summarized in Table 1. Schwen described how the bubble population corresponds to a burn up of 0.01 FIMA or 0.1 MWd/kgU. Due to the available computational power in the present study, two Xe atoms were randomly
placed at the center of a 6*6*6 UO2 lattice to simulate a more real environment in which to study the impact of fission gas on the UO2
melting point. Figure 3 shows the right half of super cell at the initial state with two Xe atoms at the center of the lattice.
Table 3 Properties of the fission gas atoms in UO2 lattice
Definition Value
Bubble density
Bubble radius 1nm
Xenon density in bubbles 20 (4.2g/ )
Figure 3 Configuration of the supercell with fission gas atoms (Xe) at the initial state for the solid 6*6*6 unit cells (large green ball: Uranium atoms; small white ball: Oxygen atoms; large pink ball: Xenon atoms.)
The radiation collision process is created by a primary knock-on atom (PKA) of uranium. In order to study the influence of various PKA energies on the melting point, a series of cascades were executed with the PKA carrying the initial kinetic energy of 3.4 KeV, 17 KeV, 34 KeV, and 68 KeV at the direction of <100>.
As to the study of melting point of UO2 with four different environments, the temperatures were varied at intervals of 25 K for two
phase method. So the errors involving in the calculations are supposed to be 25K for one phase method and 12.5K for two phase method.
3. Results and discussion
3.1 Melting Point of Pure UO2 and UO2 with Xenon
Two-phase method calculations for the melting point were performed in the NTP ensembles with a 12*6*6 UO2 super-cell, which
is composed of two contiguous 6*6*6 lattices. The results of the calculated melting point are shown in Figure 4. The two-phase method is
performed for two different simulation environments: pure UO2 lattice and UO2 lattice with Xe atoms. By employing the two-phase method,
the melting point for the pure UO2 was found to be 3175K ± 12.5 K and for UO2 with Xe atoms as 3150 K ± 12.5 K, respectively. For
comparison, one-phase method results using the same assumptions for a 6*6*6 solid lattice structure are also included in Figure 4. All the calculated results were much lower than the results from one phase method and much closer to the experimental results. The difference could
result from the initial state of the UO2 lattice. The UO2 lattice of the two-phase method was composed of two different regions including a
solid crystalline structure and liquid amorphous UO2 lattice, while the one-phase structure only incorporated the solid lattice structure. The
disorder of the amorphous structure next to the solid crystalline UO2 may account for the increase in the melting process of the solid structure
one phase method, because there is no amorphous phase in the initial lattice of one phase method, a higher melting point is obtained and differs significantly from the experimental two-phase method shown in Figure 4.
Figure 4. Lattice parameter versus temperature for one-phase method and two-phase method. Molecular dynamics simulation performed for
two different scenarios: (1) pure UO2; (2) UO2 with Xe. The experimental data for the solid phase was recommended by Fink 20; the liquid
phase was given by Christensen 21.
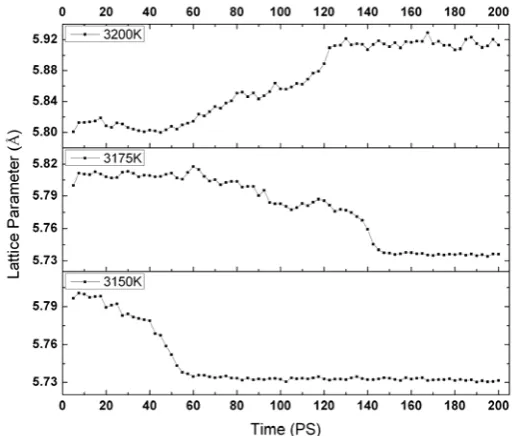
3.2 Dependence of Melting Point on Simulation Time
The dependence of the melting point on simulation time was investigated from 0 to 100 picoseconds for the two-phase method. The melting points are plotted as a function of the simulation time in Figures 5 and 6, which account for two different kinds of simulation
environments: pure UO2 lattice and UO2 lattice with Xe. From Figure 5, the UO2 lattice begins to melt at approximately 120 picoseconds at
3200K. At 3175K the lattice parameter gradually decreases, because the amorphous lattice near the solid lattice at the initial state is returning
to its solid state. In Figure 6, the UO2 lattice is able to melt at 3175K. The presence of Xe atoms results in melting at 85 picoseconds and 80
picoseconds for 3175K and 3200K, respectively. This verifies the assumption that Xe is a trigger for the melting of UO2 lattice.
Figure 6. Lattice parameter versus simulation time for UO2 and Xe through two phase method.
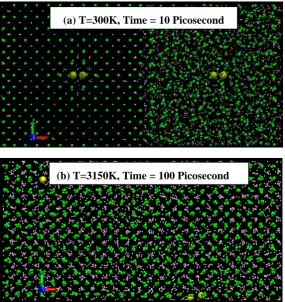
The atom view of the two-phase method for the Xe involved UO2 lattice is shown in Figure 7 and Figure 8. Figure 7(a) illustrates
the UO2 lattice at 10 picoseconds and 300K, while Figure 7 depicts the UO2 lattice at 100 picoseconds and 3150K. Figure 8 shows the UO2
lattice at 10 picoseconds and 300K, while Figure 8 represents the UO2 lattice at 100 picoseconds and 3175K. From Figure 7 it can be
observed that the right half of the lattice went through a transformation from the amorphous phase at the initial state to the crystal phase at the final state. This transformation suggests that the whole system tends to be in a solid state rather than a liquid state. From Figure 8, it could
be observed that the liquid phase is moving into the solid phase. This means that the UO2 lattice prefers to be at the liquid state, which is a
symbol of the melting state.
Figure 7. Atom view of the initial state and final state of two 6*6*6 UO2 lattice with two Xe atoms in each of them. The upper figure (a) is the initial state of UO2 lattice equilibrated at 300K. The lower figure (b) is the final state of UO2 lattice at 3150K, a temperature that is not enough for the lattice to melt.
(a) T=300K, Time = 10 Picosecond
Figure 8. Atom view of the initial state (before melting) and final state (after melting) of two 6*6*6 UO2 lattice with two Xe atoms in each of them. The upper figure (a) is the initial state of UO2 lattice equilibrated at 300K. The lower figure (b) is the final state of UO2 lattice at 3175K, a temperature that is enough for the lattice to melt.
3.3 Dependence of Melting Point on Xenon Concentration
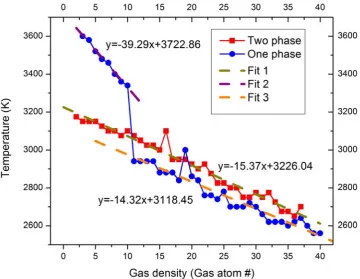
The dependence of melting point was investigated upon the fission gas density from 2 to 40 Xenons in a 6*6*6 UO2 supercell. The
bubble population corresponds to a burnup of 0.01 FIMA or 0.1 MWd/kgU to 0.2 FIMA or 2 MWd/kgU. The melting points were plotted as a function of the number of fission gas atoms in Figure 9. Once again, the one-phase method results were included for comparison with the two-phase results.
Figure 9. The melting point of UO2 as a function of fission gas Xe density. The red square line and blue circle line represent the calculated results using two phase method and one phase method, respectively. The green scattered line denotes the linear fit of the results from
(a) T=300K, Time = 10 Picosecond
two-phase method from all gas density range. The purple scattered line denotes the linear fit of the results of the one-phase method from 2 to 12 fission gas atoms, and the orange scattered line denotes the linear fit of the results of one-phase melting method from 13 to 40 fission gas atoms.
The relationship between melting point and fission gas density was generally, inversely proportional. Both one-phase and two-phase methods presented a descending trend of melting point as the fission gas density increased. For the two-phase method, the melting
point of UO2 started at approximately 3200 K and continuously decreased to 2700 K. The results obtained from the one-phase method need
to be separated into two individual ranges. While the number of gas atoms was less than 12, the melting of UO2 decreased at a rapid rate.
After the gas atom number exceeded 12, the rate of decrease of melting point from the one-phase method was very close to the rate of two-phase method. The values of the fitting parameters are shown in the Table 4.
From the linear fitting of the relationship between melting point and fission gas atom density, the melting point of pure UO2 was
found to be 3226.04K for the two-phase method and 3118.45K for the one-phase method when more than 11 fission gas atoms are present in the lattice. These two results are close to the experimental results. The gradient of the fitting could be interpreted as the melting point descent rate when the fission gas density is increasing. The two-phase method and one-phase method resulted in melting point descend rates of 15.37
K/Xe atom and 14.32 K/Xe atom, respectively. This means that for each additional Xe atom added to the UO2 lattice at an equal burnup of
0.005 FIMA, the melting point of UO2 decreased by roughly 15K. The decrease in the melting point may result due to Xenon effects on the
nucleation barrier.
Table 4. Values of the fitting parameters for Figure 9
Function Melting Point Melting Point Descend Rate
Two phase method Y=-5.37x+3226.04 3226.04K 15.37 K / Xe atom
One phase method (1) Y=-9.29x+3722.86 3722.86K 39.29 K / Xe atom
One phase method (2) Y=-4.32+3118.45 3118.45K 14.32 K / Xe atom
3.4 Dependence of Melting Point on Xenon and PKA
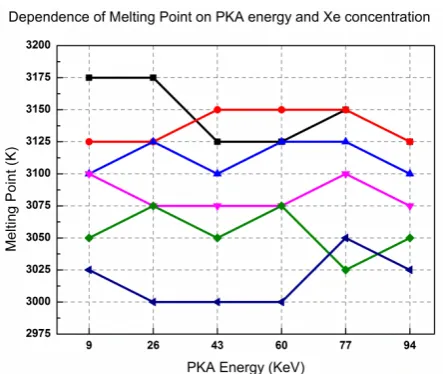
The dependence of melting point was investigated for different fission gas densities and different number of defects generated by various PKAs. As shown in Figure 10, the melting points were plotted as a function of the number of fission gas atoms and PKA energies
(corresponding to the number of defects in UO2.) The fission gas population corresponds to a range of 0 FIMA to 0.05 FIMA. The energy of
PKA ranges from 9 KeV to 94 KeV.
In this simulation, the UO2 system was created with different numbers of defects for various PKAs. Then the two-phase method
was applied to evaluate the melting point of UO2 for different configurations. From Figure 10 one can observe that the melting point of UO2
was inversely related to Xe’s concentration. However the increased PKA energyhad almost no effect on the change of the melting point of
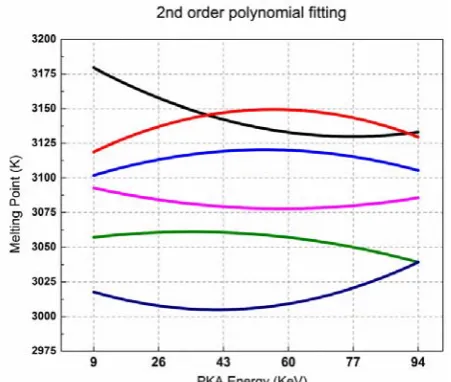
the whole system. Figure 11 is the 2nd order fitting of the results from Figure 100. This figure indicates that the melting point of UO2 is
increased with the increase of PKA energy at a Xe concentration of 0 FIMA, 0.03 FIMA, and 0.05 FIMA, while the melting point of UO2 is
decreased with the increase of PKA energy at Xe concentrations of 0.01 FIMA, 0.02 FIMA, and 0.04 FIMA. This means that the relationship
between the melting point of UO2 and the number of defects generated by various PKA energies is weak.
Prior research into the effects of Xenon concentration utilizing direct methods, such as the two-phase method, have demonstrated a resulting nucleation barrier issue. Zhang and Maginn [25] concluded that direct methods may have significant limitations when analyzing the effects of concentration on melting point due to the nucleation barrier. The radiation collision effects observed in Figure 10 are likely to affect the melting point indirectly, as the newly created point defects may ultimately influence the melting point.
Figure 11. Second order polynomial fitting of the results of Figure 10. Black, red, blue, purple, green and dark blue lines represent the number of displaced oxygen atoms with initial Xe concentration correspond to burnup of 0 FIMA, 0.01 FIMA, 0.02 FIMA, 0.03 FIMA, 0.04 FIMA, and 0.05 FIMA.
4. Conclusions
The MD simulation conducted in this paper utilizes the two-phase method to demonstrate how the melting point of the UO2 lattice
decreases due to the existence of fission gas atoms and radiation collision interactions. It is unclear whether the point defects created by radiation collisions affect the melting point. Furthermore, the concentration of Xenon may also influence the melting point via the effects on the nucleation barrier. Simulations were also performed to analyze the dependence of melting point on the simulation time. It was observed that the presence of Xenon induces the melting process. For several of the cases analyzed in this paper, both one-phase and two-phase results are shown for comparison. In the one-phase method, the initial lattice calculation contains only a solid phase, whereas the initial lattice calculation for the two-phase method contains both the solid phase and liquid phase. As a result, the two-phase method provides results that are significantly closer to the experimental data. Since there are additional explanations that may explain some of the relationships between the melting point and Xenon presence and density, PKAs, and simulation time, it is necessary to provide additional study into the possible effects on the nucleation barrier, non-equilibrium point defects, and the inaccuracies in both one-phase and two-phase methods.
Acknowledgements
The financial support by the U.S. Department of Energy under NERI-C Award No. DE-FG07-07ID14889 and U.S. Nuclear Regulatory Commission under Award No. NRC-38-08-950 are greatly acknowledged. F. Gao, X. Sun, and M. A. Khaleel were supported by the US Department of Energy’s Nuclear Energy Advanced Modeling and Simulation (NEAMS) Program at Pacific Northwest National Laboratory, which is operated by Battelle Memorial Institute for the US Department of Energy.
[1] K. Yamada, K. Kurosaki, M. Uno, S. Yamanaka, Journal of Alloys and Compounds, 307 (2000) 10-16. [2] C.B. Basak, A.K. Sengupta, H.S. Kamath, Journal of Alloys and Compounds, 360 (2003) 210-216. [3] T. Arima, S. Yamasaki, Y. Inagaki, K. Idemitsu, Journal of Alloys and Compounds, 400 (2005) 43-50. [4] S. Motoyama, Y. Ichikawa, Y. Hiwatari, A. Oe, Physical Review B, 60 (1999) 292.
[5] M. Inoue, Journal of Nuclear Materials, 282 (2000) 186-195.
[6] T. Arima, S. Yamasaki, K. Idemitsu, Y. Inagaki, J. Nucl. Mater., 376 (2008) 139-145.
[7] T. Arima, S. Yamasaki, Y. Inagaki, K. Idemitsu, Journal of Alloys and Compounds, 415 (2006) 43-50.
[8] T. Watanabe, S.G. Srivilliputhur, P.K. Schelling, J.S. Tulenko, S.B. Sinnott, S.R. Phillpot, Journal of the American Ceramic Society, 92 (2009) 850-856. [9] T. Watanabe, S.B. Sinnott, J.S. Tulenko, R.W. Grimes, P.K. Schelling, S.R. Phillpot, J. Nucl. Mater., 375 (2008) 388-396.
[10] J.C. Ramirez, M. Stan, P. Cristea, Journal of Nuclear Materials, 359 (2006) 174-184. [11] D. Terentyev, Computational Materials Science, 40 (2007) 319-326.
[12] T. Ichinomiya, B.P. Uberuaga, K.E. Sickafus, Y. Nishiura, M. Itakura, Y. Chen, Y. Kaneta, M. Kinoshita, J. Nucl. Mater., 384 (2009) 315-321. [13] K. Govers, S. Lemehov, M. Hou, M. Verwerft, J. Nucl. Mater., 366 (2007) 161-177.
[14] K. Govers, S. Lemehov, M. Hou, M. Verwerft, J. Nucl. Mater., 376 (2008) 66-77.
[15] T. Arima, K. Idemitsu, Y. Inagaki, Y. Tsujita, M. Kinoshita, E. Yakub, Journal of Nuclear Materials, 389 (2009) 149-154. [16] E. Yakub, C. Ronchi, D. Staicu, J. Chem. Phys., 127 (2007) 094508
[17] H.Y. Geng, Y. Chen, Y. Kaneta, M. Kinoshita, Journal of Alloys and Compounds, 457 (2008) 465-471. [18] S.J. Plimpton, J. Comp. Phys. , 117 (1995) 1.
[19] D. Schwen, M. Huang, P. Bellon, R.S. Averback, Journal of Nuclear Materials, 392 (2009) 35-39.
[20] International Nuclear Safety Centre (INSC), Material Properties Database,Argonne National Laboratory, Illinois, USA, http://www.insc.anl.gov/matprop/. [21] J.K. Fink, Journal of Nuclear Materials, 279 (2000) 1-18.
[22] W.D. Drotning, in: Proceedings of the 8th Symposium on Thermophysical Properties, National Bureau of Standard, Gaithersburg, Maryland, June 15–18, 1981.
[23] J.A. Christensen, J. Am. Ceram. Soc., 46 (1963) 607.
[24] D.G.M. J.H. Harding, P.E. Potter, Commission of European Communities Report EUR 12402, (1989).