Parameter Optimization of Kernel-based
One-class Classifier on Imbalance Learning
Ling Zhuang and Honghua Dai
School of Engineering and Information Technology, Deakin University 221 Burwood Highway, Burwood, VIC 3125, Australia
Email:flzhu, [email protected]
Abstract— Compared with conventional two-class learning
schemes, one-class classification simply uses a single class in the classifier training phase. Applying one-class classification to learn from unbalanced data set is regarded as the recognition based learning and has shown to have the potential of achieving better performance. Similar to two-class learning, parameter selection is a significant issue, especially when the classifier is sensitive to the parameters. For one-class learning scheme with the kernel function, such as one-class Support Vector Machine and Support Vector Data Description, besides the parameters involved in the kernel, there is another one-class specific parameter: the rejection rate v. In this paper, we proposed a general
framework to involve the majority class in solving the parameter selection problem. In this framework, we first use the minority target class for training in the one-class classification stage; then we use both minority and majority class for estimating the generalization performance of the constructed classifier. This generalization performance is set as the optimization criteria. We employed the Grid search and Experiment Design search to attain various parameter settings. Experiments on UCI and Reuters text data show that the parameter optimized one-class classifiers outperform all the standard one-class learning schemes we examined.
Index Terms— one-class classification framework, imbalance
learning, one-class Support Vector Machine, Support Vector Data Description(SVDD)
I. INTRODUCTION
One-class classification problem becomes of special importance in recent machine learning research. In the original one-class learning, it is assumed that only the target class information is available. In other words, in the inductive process, there is no information of the outlier class. The boundary between the target class and its “outsiders” has to be estimated from data of the only available objects.
One-class classification is practically significant in ap-plications where only a single class of data objects are easy to obtain. Objects from the other classes could be too difficult or expensive to be made available. In recent years, applying one-class classification to imbalance data becomes a new strategy. A few works has been done on modeling the minority class in an unbalanced data set
This paper is based on “Parameter Estimation of One-Class SVM on Imbalance Text Classification” by Ling Zhuang and Honghua Dai, which appeared in the Proceedings of the 19th Canadian Conference on Artificial Intelligence.
with one-class classifiers [1], [2]. Empirical results in [2] show that on heavily-unbalanced data, one-class classifier achieves much better performance than the conventional two-class ones. Researchers claimed that by discarding the distractive majorities, the “space” where minority data resides could be better determined [2]. Therefore, it tackled the problem of performance imbalance, that is, the conventional classifier tends to have high accuracy rate on majority class while performs poorly on the minorities.
Obviously, one-class learning only requires the target class for classifier training, the redundant data from the irrelevant classes, such as those non-related topics for a document filtering system, is unwanted. Even when these information are available, they are still discarded and wasted. However, are they really useless? Will these be helpful in other aspects? In this paper, a general learning framework for applying one-class classification to unbalanced data is proposed. The aim of this research is to investigate the possibilities of utilizing both target and outlier class in one-class learning for unbalanced data set. Although the majority instances are not involved in the classifier training procedure, it could be employed in optimizing the parameters of one-class classifiers.
The remainder of this paper is structured as follows. Section II briefly introduces the basic definitions of the kernel-based one-class classifiers: one-class Support Vec-tor Machine(OC-SVM) and Support VecVec-tor Data Descrip-tion(SVDD). Section III presents the relevant works done previously. We will propose the one-class classification framework step by step in Section IV. Empirical results on UCI and Reuters data set are presented in Section V. Finally, we conclude the paper with the major contribu-tions of our work and future research direccontribu-tions.
II. BACKGROUND
In this section, we will briefly introduce the standard one-class SVM and SVDD as an important background knowledge for this paper. We will first give a brief review on the basic definition of both algorithms. Then we will discuss about the parameters involved in the learning procedure.
A. One-class SVM
from. As stated in [3], one-class SVM aims to solve this problem:
Suppose a data set is drawn from an underlying probability distributionP. Estimate a “simple” subsetS in the input space such that the proba-bility that a test point drawn fromPlies outside ofSequals some priori specified value between 0 and 1.
The solution to this problem is to estimate a function f that is positive on S and negative on the complement. In other words, in [3], they developed an algorithm which returns a functionf that takes the value+1in a “small” region capturing most of the training data points and 1 elsewhere. Their strategy could be summarized into two steps:
Map the data into a feature space corresponding to an appropriate kernel function.
Separate the mapped vectors from origin with max-imum margin.
Let x i
(i = 1;2;:::;l) denote the training examples labeled as the positive class, and : X ! H be a kernel map which transforms the data into an inner product spaceH. The problem of separating the data set from the origin is essentially the problem of optimizing the following quadratic programming:
min 1 2 jjwjj 2 + 1 vl l X i=1 i
s:t: (w(x i
)
i ;
i=1;2;:::;l; i
0 (1)
If w and solve this problem, then the decision function f(x) = sign((w(x)) ) will be positive for most training pointsx
i. B. SVDD
SVDD [4] is a data domain description method which aims to obtain a boundary around a target data set. In its simplest form, the description is learned from the target class without outliers available. It offers the ability to map the data into a new, high dimensional feature space and more flexible descriptions could be achieved by this mapping.
For a data set containing l data objects x i
(i =
1;2;:::;l), SVDD tries to find a sphere with minimum volume containing all the data objects. This sphere is described by a sphere center a and radius R. When all training objects are demanded to be strictly inside the sphere, the radius
F(R ;a)=R 2
(2) needs to be minimized with the constraints:
j(x i a)j 2 R 2 (3) However, to represent the data better and make the method more robust, some remote objects are allowed
to be ignored and put outside the sphere. By introducing slack variables"
i, the minimization problem becomes
F(R ;a;" i
)=R 2 +C X " i (4) with constraints: jx i aj 2 R 2 +" i (8" i 0) (5)
The parameterCgives the tradeoff between the volume of description and the errors. Note that if the distance from an objectx
i to the center
ais larger than R 2
, the larger distance would be penalized. Generally speaking, with small value ofC, objects outside the sphere are penalized gently and thus it allows a tighter description around the target.
Incorporating constraints( 5) into equation( 4) by in-troducing Lagrange multipliers and constructing the La-grangian, a quadratic programming problem is eventually derived for minimization of this error:
L= X i i (x i x i ) X i;j i j (x i x j ) (6) with constrains: 0 i C (7) X i i
=1 (8)
a= X i i x i (9)
For objects satisfying the equality of constraint( 5), i.e., the object is located at or outside the boundary, the Lagrange multiplier will become unequal0(
i
>0). The upper bound in inequality( 7), the value ofC limits the influence of these objects on the final solution. Appar-ently, as discussed above,C is a significant parameter in SVDD.
Whether a test point z is within the sphere is deter-mined by calculating the distance of z to the center a. If the distance is smaller than the radius R, then z is accepted. Otherwise,z is considered as an outlier.
Note that in formula( 6), objectsx only appear in the form of inner products with other objects y. Hence, the inner products of objects(x
i x
j
) can be replaced by a kernel functionK(x
i ;x
j
). This implicitly maps the data into another feature space and by choosing an appropriate kernel function, a flexible description could be obtained.
C. Parameter Estimation in One-Class Classifiers
two learning schemes are strongly related. In this section, we will analyze these parameters: one is related to the kernel function, the other is the rejection rate of one-class learning.
First of all, both one-class SVM and SVDD map the original data into the feature space using a kernel function. A kernel function, which is first introduced in linear learning machines, transforms the data into the feature space where the linear machine could classify them. A kernel function is normally represented as an implicit computation of inner products, such that for all x;z 2X,K(x;z)=((x)(z))whereis a mapping from X to an feature space F.
Some common kernel functions include linear, sigmoid, polynomial and Gaussian kernels. The Gaussian kernel, which is given by
k(x;y)=e jjx yjj
2 =s
(10) has been popular for practical use. We employ the Gaussian kernel for simplicity and efficiency.
The width parameter s is the first needs to be taken into account. In SVDD, the width parameter sregulates the number of support vectors. When increasing s, the volume of the closed region is enlarged and the number of support vector is decreased. The aim of SVDD is to reduce the volume covered by the boundary, but this comes at the price of overfitting. These two conditions are contradictory and a trade-off is definitely necessary. The width parametersplays an important role to control the balance.
Another parameter appears in one-class SVM is the rejection rate v 2 (0;1℄. This user specified parameter determines the ratio of points considered to be “outliers” in the target class. In one-class SVM, it is an upper bound on the fraction of training points outside the estimated region. It is also a lower bound on the fraction of support vectors. In SVDD, although v is not given explicitly, it is implicitly related to parameter C. As discussed in Section II-B, C is the penalize rate of rejected objects. With smaller C, it allows more objects to be assigned outside the sphere, which indicates a larger rejection rate v. This parameter influences the size of region the learning scheme covers in both one-class SVM and SVDD. The smaller value v is, the bigger size the estimated region will be. The ideal solution is to find a smaller region covers more fraction of the training points. Hence, similar as the width parameter s, v also determines the trade-off between the covered region and possible overfitting problem.
In SVDD, the error on the target class could be esti-mated by the number of support objects if applying leave-one-out method on the training data. Thus, the value ofs could be determined on the basis of the rejection ratev. This is due to the fact that the increasing ofsdecrease the number of support vectors. Given the expected rejection rate, if the estimation error is too large, then the number of support vectors needs to be decreased, which results in the increase of width parameter s, However, as stated
in [6], this sometimes leads to poor results and created a lot of confusion. Hence, we do not consider this factor in our paper.
III. RELATED WORK
does have potential to be superior to the normal classifier on imbalance data. However, in their work, they only considered the linear kernel for SVMs and the parameter selection issue is hardly mentioned.
Other recognition-based learning include autoassocia-tor, which is based on the feedforward neural networks [7] and rule induction learning [8]. In the autoassociator, only the positive instances are considered as the input and by examining on several synthetic domains and associating the analysis with the real-world data, [7] concludes that the autoassociator is more accurate than Multi-layer Perceptrons(MLP) in domains that require particularly strong specialization coming from the negative class or particularly weak specialization coming from the positive class. These observations suggested that the one-class learning strategy is useful in certain conditions. The recognition-based rule learning algorithm presented in [8] is to induce rules from the minority class in the first stage, then the majority examples are participating in the procedure of “refining” the learned rules. Experiments with varying parameter values shows that compared to other learning schemes, such as C5.0 with data sampling, it achieves reasonably better results in fraud detection.
Parameter selection has been an important research issue appeared in many works. A selection criteria is required such that the parameters are optimized based on it. In [9], a generalization performance estimation method for one-class SVM is proposed. This method is an extended version of the -estimate approach, which is used to estimate the generalization performance of standard SVM. They analyzed the connection between one-class SVM and standard SVM and derived the es-timation method from the existing one. By setting this as the objection function, [10] employed the generic algorithm to optimize the training model, i.e., select the est parameter setting of the kernel and v. For SVDD, a parameter estimation method based on the consis-tency measurement is proposed in [11]. This criteria is employed to optimize the hyperparameter K, which indicates the classifier complexity. For SVDD with the Gaussian kernel,K is exactly the width parameters[6]. Generally speaking, the more complex the model, the more flexible the boundary and the tighter it will fit the target data. However, this also comes at the price of overfitting. Thus, there should be a trade-off between increasing the complexity and avoiding the overfitting. Classifer consistency is therefore introduced such that the complexity will be increased until the classifier becomes inconsistent. Consistency of the classifier is defined based on the estimated number of rejected target examples. Once it exceeds a certain threshold, the classifier is called inconsistent. This threshold is heavily related to the rejection rate v, which is user-specified. Apparently, they only considered the kernel parameters, but left the rejection ratev determined by the users.
IV. ONE-CLASSCLASSIFICATIONFRAMEWORK A. Motivation
Imbalance classification could be distinguished into two cases. The first one is novelty detection. In this case, the majority class is well-sampled according to a certain probability distribution. But it is impossible to sample the minority due to their randomness. Conversely, in the other situation, we are able to sample the minority class. However, the size of majorities are so huge that it is unlikely to draw a proper distribution from it. For example, in a document filtering system, when we are targeting to extract articles related to a specific topic “football”, we first select all those ones about “football” to constitute the positive class and regard those ones not on “football”, i.e, “non-football” as the negative. However, the number of “non-football” articles is definitely much larger than the “football” ones, since they could include anything else, such as traveling, cooking, movies etc. The definition of “non-football” is an ambiguous concept and instances belong to it are extremely difficult to sample due to their diversities.
Normal classifiers generally perform poorly on im-balance datasets, whether the class distribution fits in category one or two. Most of classifiers are designed to generalize from training data and output the simplest hypothesis that best fits the data. This is based on the principle of Occam’s razor. With imbalance data, the simplest hypothesis is often the one that classifies almost all instances as the majority class. This is a very com-mon situation when applying most normal classification algorithms to imbalance data. One-class classification has been proven to have the potential of being superior to the normal classifiers in this situation empirically and theoretically in [2]. In one-class imbalance classification, the minority class is specifically targeted. As mentioned in Section II-A, a functionf is estimated to be positive on the minority instances and negative on the others. How-ever, this approach is not appropriate for class distribution meets category 1. Note that in this category, the minority class could not be well-sampled. This problem is beyond the scope of this paper and we will only consider the imbalance data described in category 2, especially on text data.
could be employed when estimating the performance of constructed classifier. By further tuning the parameters with the assistance of majority class, the hypothesis is optimized. We will present this framework in the next section.
B. Description of the Framework
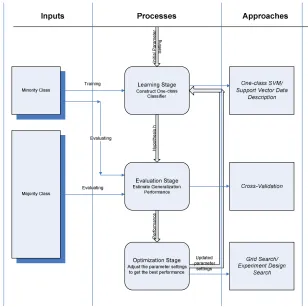
The one-class classification framework we proposed is divided into three stages:
1) Learning Stage; 2) Evaluation Stage; 3) Optimization Stage.
Figure 1 illustrates the detailed procedure. In the first stage, to construct the classifier, an initial parameter setting needs to be given. Generally this initial set-ting is chosen randomly. The classifier is trained from the minorities, i.e., the target class in the training set. Based upon the hypothesis the first step produces, the generalization performance of this classifier is estimated utilizing both minority and majority data. This makes the evaluation stage. Finally at the optimization stage, using the generalization performance as the optimization criteria, the parameter settings are adjusted as necessary to achieve better results. The whole process is iterating until stopping at a certain criteria where the best parameter setting is selected.
1) Learning Stage: This is the step where the one-class one-classifier is constructed using the minority one-class. The purpose of our research is to improve the classifica-tion accuracy on minorities in imbalance learning. Thus, classifier which is capable of describing the minority data is needed. By neglecting the distracting majorities, one-class one-classifier is the most suitable learning methods for this purpose. As shown in Figure 1, after this stage, a hypothesis is produced and will be estimated in the next step.
2) Evaluation Stage: Generalization performance es-timation of a classifier is one of the important tasks in learning theory. There are several generic perfor-mance estimators, including training error, hold-out test-ing, bootstrap, cross-validation and leave-one-out. The most popular method is cross-validation. Among the various versions of cross-validation estimator, the leave-one-out estimator is shown to be almost unbiased [12]. The leave-one-out estimator is described as follows: From the training instances S = ((x
1 ;y
1
);:::;(x n
;y n
)), the first instance is removed. The remaining instances S
1 =
((x 2
;y 2
);:::;(x n
;y n
))are used for training, producing a classification ruleh
1 L
. This rule is tested on the held out instance(x
1 ;y
1
). This process is repeated for all training examples. The generalization performance is measured by these test results.
However, leave-one-out is very expensive to run, es-pecially in cases with huge amount of training data. Hence, cross-validation is another option. An k-fold cross validation works as follows: firstly, we divide the training data into k equal-sized sections S
1 ;S
2 ;:::;S
k. For each section S
i, the training model is built based upon the
k 1 sections (S 1
;:::;S i 1
;S i+1
;:::;S k
) and tested on the left-outS
i. Apparently, leave-one-out estimator is the situation whenkequals to n.
We employed both 10-fold cross-validation and leave-one-out estimator when estimating the generalization per-formance. However, to estimate the performance on ma-jority outlier class, there is no need to use these strategies. Note that majority instances are not involved in the training procedure. Thus, the one-class classifier is first constructed on the entire minorities. The majority class then is regarded as the validation set. All the instances in this set are “outliers” for this classifier. According the accuracy rate on negative class could be calculated. This estimation is a fast process since the classifier only needs to be constructed once.
The overall performance is measured upon the accuracy of both positive and negative classes. In our experiment, we employed geometric mean as introduced in Section V-B.
3) Optimization Stage: Grid search is a straightforward approach. In grid search, a uniform grid is defined in the parameter space. Then points in each of the grid are evaluated and the global optimum is found in this space. The coarseness of the grid determines the quality of the solution and the efficiency of the search.
Grid search has been widely used in SVM parameter selection. Although lots of effort has been spent in pa-rameter search for SVM, grid search is still regarded as the most reliable approach. The only problem is its high computational demands. Even moderately high resolution searches can result in a large number of evaluations and unacceptably long run times. In this paper, we will also employ grid search as the basic search method.
The idea of parameter selection based on design of ex-periments(DOE) was first proposed in [13]. This approach basically is to start with a very coarse grid covering the whole search space and iteratively refine both the grid resolution and search boundaries, keeping the number of samples at each iteration roughly constant.
A combination of three-level experiment design with the two-level experiment design constitutes the sampling pattern in our experiment design search method. The three-level design is also written as a3
k
factorial design. It means thatk factors are considered, each at 3 levels. Similarly, the two-level design is to consider k factors at 2 levels. In a two parameter space, if each parameter is considered as one factor, this approach will produce thirteen solutions(3
2 +2
2
=13). Please note that when we select the points, we first discretize each parameter space by dividing it into three or two equal-length sections. In this paper, the middle point of each section is chosen as the representative for each level.
Figure 1. Framework of Applying One-Class Classifiers to Imbalance Data
TABLE I. UCI DATASETDESCRIPTION
Dataset Positive Insts. Negative Insts. Ratio Attribute
Segment1 330 1980 1:6 19
Glass7 29 185 1:6 9
Letter26 734 19266 1:26 16
Abalone19 32 4145 1:130 8
could be adjusted accordingly. If the new search space could center around the best point without going outside the original boundary, that is the best choice. Otherwise, the new search range will start from or end to the closest original bound and then extend to the other half section. This process is repeated as many times desired or once the points in the refined search space could not improve the previous performance any more.
V. EXPERIMENTALRESULTS A. Data Set
Four UCI datasets are used first to evaluate the performance of different search algorithms. They are abalone(19), letter(26), glass(7) and segment(1). The label in the parentheses indicates the target class we chose
TABLE II.
REUTERS-21578 MODAPTEDATASETDESCRIPTION
Data set #+Training Ration(+:-) Money-fx 475 1:19.2
Grain 371 1:24.9
Crude 330 1:28.1
Trade 369 1:25.2
Interest 347 1:26.7
Ship 197 1:47.8
Wheat 212 1:44.3
Corn 181 1:52.1
as the positive class. Table I summarizes the details of each data set in terms of the number of positive, negative instances, positive-to-negative ratio and the number of attributes.All the attributes in these four data sets are continuous variables and scaled to either[ 1;1℄or[0;1℄. The first two data sets are slightly imbalanced with the ratio 1 : 6 and the last data set(abalone) is the most imbalanced one with a very high ratio1:130.
TABLE III.
SEARCHALGORITHMCOMPARISON(G-METRIC)
Dataset Grid Search EDS Segment 0.799 0.921 Glass 0.722 0.781 Letter 0.866 0.909 Abalone 0.583 0.635
and converted the documents to high-dimensional vectors using TFIDF weighting scheme. In order to reduce the size of the term set, we discarded terms which appear in less than 5 documents and the total number of terms extracted finally is 6362. We have chosen 8 frequent topic categories for evaluation in the experiments. They are all mildly imbalanced and Table II summarizes their details. It lists, for each specific topic, the number of positive doc-uments(#+Training) and the positive-to-negative instance ratio in the training set.
B. Evaluation Measurement
The geometric means suggested by Kubat et. al. [14] is employed to evaluate classifiers on highly imbalanced datasets. The calculation of geometric means is as fol-lows:
g= p
a P
a
N (11)
wherea
P indicates the sensitivity metrics and a
N the specificity. Sensitivity is defined as the accuracy on the positive instances(true positives/(true positives + false negatives)), and specificity is defined as the accuracy on the negative instances(true negatives/(true negatives + false positives)). Geometric mean is high when both a
P and a
Nare high and when the difference between a
P and a
Nis small. By optimizing this measurement, it is ensured that the accuracy on each of the class is maximized while keeping them balanced.
Another popular evaluation measurement we employed is F
1 measure. The calculation is defined based on the precision and recall:
F 1
=
2reallpreision
reall+preision
C. Test Environment
One-class SVM is included in the LIBSVM software package [15]. Based on the library provided, we imple-mented the proposed framework in Java. The data descrip-tion toolbox [6] provides SVDD funcdescrip-tion. To connect the established Java framework with this MatLab toolbox, we employed JMatLink to call the proper function in MatLab from Java. All the experiments are done on Pentium III(800MHz) with 256M memory Linux machines.
D. Results
1) Search Algorithm Comparison: First of all, we compared the accuracy of parameter search algorithms on
TABLE IV.
SEARCHALGORITHMCOMPARISON(RECALL ONP/NCLASS)
Dataset Grid Search EDS
P N P N
Segment 0.667 0.957 0.94 0.903 Glass 0.552 0.946 0.724 0.843 Letter 0.869 0.863 0.895 0.924 Abalone 0.438 0.777 0.594 0.679
the small UCI data sets. Table III lists the geometric mean accuracy rates. Table IV gives more details of the search performance by listing the accuracy rate on positive and negative class respectively. From Table III, we could see that the experiment design search achieves the best overall performance. Table IV shows the more detailed statistics. We find that apparently, experiment design search did improve the accuracy rate on positive minority class compared to grid search. However, the accuracy rate on negative majority class of experiment design search is slightly worse than the grid search. From the definition of experiment design search, we could see that the advantage of it is that it could sample the parameter space in a better way. By increasing the grid resolution in each iteration, the search space is refined.
2) With/Without Outliers: The second series of exper-iments we did is to compare the one-class SVM classi-fication performance with and without the outliers in the estimation stage. In the situation without the outliers, we discard the negative class and keep the positive only for both training and generalization performance estimation. In fact, this is the standard one-class classification. Ta-ble V lists the comparison results. Interestingly, a common phenomenon is that without the majority instances, one-class SVM does achieve excellent performance on the positive minority class. However, this is accompanied by very poor recall rate on negative class. On data set Seg-ment, this effect is relatively small. But on the other three, especially with the experiment design search, performance on negative majorities decreases dramatically without the outliers.
When there is no outliers available, the one-class classifier will have a bias towards the target class. This could easily cause the overfitting problem. Some other works have proposed approaches which generate artifi-cial outliers to fix this. In imbalance learning, although accuracy on minority could possibly be more important, majority still should not be neglected. Both of them need to be taken into consideration. By involving the majorities in the estimation stage, a more balanced results could be achieved. From Table V, we could see that once the negative instances are added during estimation, although the accuracy decreases slightly on positive, the performance on majorities is improved.
TABLE V.
COMPARISON(RECALL ONP/NCLASS)WITH AND WITHOUT THE NEGATIVE INSTANCES
Dataset GS With GS Without EDS With EDS Without
P N P N P N P N
Segment 0.667 0.957 0.667 0.957 0.94 0.903 0.913 0.897 Glass 0.552 0.946 0.758 0.551 0.724 0.843 0.828 0.741 Letter 0.869 0.863 0.932 0.513 0.895 0.924 0.990 0.192 Abalone 0.438 0.777 0.688 0.551 0.594 0.679 0.75 0.458
TABLE VI.
COMPARISONWITHSTANDARDONE-CLASSCLASSIFIERS
Dataset OC OS NN NB NN2 P P-OC P-S
Money 0.514 0.563 0.642 0.493 0.468 0.484 0.550 0.585 Grain 0.585 0.523 0.473 0.382 0.333 0.402 0.742 0.48 Crude 0.544 0.474 0.534 0.457 0.392 0.398 0.715 0.7 Trade 0.597 0.423 0.569 0.483 0.441 0.557 0.634 0.709 Interest 0.485 0.465 0.487 0.394 0.295 0.454 0.609 0.592 Ship 0.539 0.402 0.361 0.288 0.389 0.370 0.427 0.445 Wheat 0.474 0.389 0.404 0.288 0.566 0.262 0.647 0.545 Corn 0.298 0.356 0.324 0.254 0.168 0.230 0.542 0.571 Average 0.505 0.449 0.474 0.380 0.380 0.395 0.608 0.578
for one-class SVM, leave-one-out estimation is employed; for SVDD, 10-fold cross-validation is used.
To the best of our knowledge, [1] is the first work to apply one-class SVM on document classification. How-ever, they discarded the negative class information and in their experiments, they only considered the impact of various document representation on classification perfor-mance, nor the parameter selection in one-class SVM. Table VI shows the comparison results of the Parameter Optimized One-Class SVM(P-OC) and Parameter Op-timized SVDD(P-S) with one-class SVM(OC), Outlier-SVM(OS), Neural Networks(NN), Naive Bayes(NB), Nearest Neighbour(NN2), Prototype Algorithm(P). The evaluation measurement is F
1 measure. The algorithms we compared with are under these settings: the stan-dard One-class SVM(RBF kernel, binary document rep-resentation), Outlier-SVM(Linear kernel, binary docu-ment representation), Neural Networks, one-class Naive Bayes, one-class Nearest Neighbour(Hadamard document representation) and Prototype Algorithm(tf-idf document representation). According to [1], the listed F1 results are the best among various document representations and parameter settings.
As shown in Table VI, in most cases, the parameter optimized approaches, either one-class SVM or SVDD, achieve much better results than the stand-alone one-class classifiers. The last row of Table VI presents the average F1 accuracy for each learning method on these eight data sets. The parameter optimized one-class SVM beats all the other schemes. The optimized SVDD is slightly worse. The standard one-class SVM with the default settings performs the best compared with the other one-class learning approaches. However, by further optimizing its parameters, the average accuracy is increased about 10%. This further indicates the significance of parameter selection.
4) Time Complexity: There are two major factors af-fecting the running time of the proposed approach. The first is the size of training set. In one-class learning, only the minority positive instances are used in the training procedure. Hence, the number of positive instances will influence the construction time of classifier. The larger size positive minority class is, the longer running time it will have.
Another factor which has huge impact on the time com-plexity is the parameter search algorithm. It is conflicting with the algorithm complexity and the time complexity. The more refined grid the algorithm defines, the more likely that a better setting will be found. However, this comes at the price of longer running time. Therefore, a search algorithm which could find a relatively better parameter setting quickly is the suboptimal solution.
Grid search is an exhaustive search which makes it very inefficient. However, it is also the safest solution for this problem. In the grid search, the resolution of the parameter space determines the running time. In our experiments, the parameter ranges are v 2 (0;1) and log(s) 2 [ 15;3℄. For a very coarse grid of 1018, the parameter settings need to be tested is 180. The grid resolution in this case is0:11=0:1. Please note here this is the size of one grid in the parameter space. One point in this grid is selected randomly to represent it for estimation purpose.
VI. CONCLUSION
In this paper, we proposed a general parameter opti-mization framework for one-class classification on im-balance data. In this framework, only minority class is engaged in training the classifier but both majority and minority instances are utilized in estimating the general-ization performance of constructed classifier. Using the generalization performance as optimization criteria , the classifier is constructed with the best parameter settings. Empirical results prove that this framework with the one-class SVM and SVDD both achieve much better accuracy results than the standard OC-SVM and other one-class learning schemes. In particular, the parameter optimized one-class SVM ranked the top among all the learning schemes. From another series of test which is designed to compare the performance with or without the majorities in the estimation stage, we find that by including the majorities, the learning scheme is able to obtain more balanced results on positive and negative classes.
One possible future research is to examine other one-class one-classification algorithms within this framework. Al-though in this paper we only considered one-class SVM and SVDD with Gaussian kernel, it is possible to be extended to other kernel functions and other one-class learning schemes. Another important issue is the param-eter search algorithms. Perhaps a better way to search for the best setting is to let the classification performance converge to an optimal value rather than do a exhaustive search.
ACKNOWLEDGMENT
The authors would like to thank Dr. Xiaoshu Hang and John Casey for discussions and comments which helped improve the paper.
REFERENCES
[1] L. M. Manevitz and M. Yousef, “One-class svms for document classification,” Journal of Machine Learning
Research, vol. 2, pp. 139–154, 2001.
[2] B. Raskutti and A. Kowalczyk, “Extreme re-balancing for svms: a case study,” SIGKDD Explorations, vol. 6, pp. 60–69, 2004.
[3] B. Scholkopt, J. C. Platt, J. Shawe-Taylor, A. J. Smola, and R. C. Williamson, “Estimating the support of a high-dimensional distribution,” Neural Computation, vol. 13, pp. 1443–1471, 2001.
[4] R. P. D. David M.J. Tax, “Support vector domain descrip-tion,” Pattern Recognition Letters, vol. 20, pp. 1191–1199, 1999.
[5] D. M. J. Tax, “One-class classification,” Ph.D. dissertation, Delft University of Technology, 2001.
[6] D. Tax, “Ddtools, the data description toolbox for matlab,” Augustus 2005, version 1.4.1.
[7] N. Japkowicz, “Supervised versus unsupervised binary-learning by feedforward neural networks,” Machine
Learn-ing, vol. 42, no. 1/2, pp. 97–122, 2001.
[8] J. Zhang, E. Bloedorn, L. Rosen, and D. Venese, “Learning rules from highly unbalanced data sets,” in Proceedings of
the IVth IEEE International Conference on Data Mining (ICDM’04), 2004, pp. 571–574.
[9] Q.-A. Tran, X. Li, and H. Duan, “Efficient performance estimate for one-class support vector machine,” Pattern
Recognition Letters, vol. 26, pp. 1174–1182, 2005.
[10] Q.-A. Tran, Q. Zhang, and X. Li, “Evolving training model method for one-class svm,” in Proceeding of 2003 IEEE
International Conference on Systems, Man and Cybernet-ics (SMC 2003), 2003.
[11] D. Tax and K. M” uller, “A consistency-based model selection for one-class classification,” in Proceedings of
the International Conference on Pattern Recognition 2004.
IEEE Computer Society, Los Alamitos, CA, 2004, pp. 363–366.
[12] A. Lunts and V. Brailovskiy, “Evaluation of attributes obtained in statistical decision rules,” Engineering
Cyber-netics , pp. 98–109, 1967.
[13] C. Staelin, “Parameter selection for support vector ma-chines,” Hewlett-Packard Company, Tech. Rep. HPL-2002-354R1, 2003.
[14] M. Kubat and S. Matwin, “Addressing the curse of im-balanced training sets: one-sided selection,” in Proc. 14th
International Conference on Machine Learning. Morgan Kaufmann, 1997, pp. 179–186.
[15] C.-C. Chang and C.-J. Lin, LIBSVM: a library for
support vector machines, 2001, software available at
http://www.csie.ntu.edu.tw/ cjlin/libsvm.
Ling Zhuang is currently a Ph.D. candidate in the School of
Engineering and Information Technology, Deakin University, Australia. She received her B.S. degree in C.S. in 2001 from Nanjing University of Information Science and Technology of China. Her current research interests focus on text learning, web mining and imbalance learning.
Honghua Dai completed his undergraduate study in 1978 at
Nanjing University specialized in computational mathematics, received his M.S degree in C.S in 1986 from the Graduate School of the University of Science and Technology of China, and the PhD in C.S. in 1994 from RMIT University, Australia. He is currently a senior lecture at the School of Engineering and Information Technology, Deakin University, Australia. His current research interests are in the area of machine learning and data mining, specialized in causal discovery, data mining for software engineering, data mining inspired by computational immunology, data translation and reliability issue in knowledge discovery.