A stochastic model for a single grade system with backup resource of
manpower
T. Roja Mary,
aand K.P. Uma
b,∗aDepartment of Mathematics, Sree Sakthi Engineering College, Coimbatore, Tamil Nadu, India. b,Department of Mathematics, Hindusthan College of Engineering and Technology, Coimbatore, Tamil Nadu, India.
Abstract
In this paper, an organization with single grade subjected to exodus of personnel due to policy decisions taken by it, is considered. In order to avoid the crisis of the organization reaching a breakdown point, a suitable univariate policy recruitment based on shock model approach and cumulative damage process is suggested. A mathematical model is constructed and a performance measure namely the mean time to recruit-ment is obtained. The analytical results are numerically illustrated and the influences of nodal parameters on the performance measures are studied and relevant conclusions are presented.
Keywords: Single grade system, Univariate policy of recruitment, shock model.
2010 MSC:90B70, 91B40, 91D35. 2012 MJM. All rights reserved.c
1
Introduction
Frequent wastage or exit of personnel is common in many administrative and production oriented orga-nization. Whenever the organization announces revised policies regarding sales target, revision of wages, incentives and perquisites, the exodus is possible. Reduction in the total strength of marketing personnel adversely affects the sales turnover in the organization. As the recruitment involves several costs, it is usual that the organization has the natural reluctance to go in for frequent recruitments. Once the total amount of wastage crosses a certain threshold level, the organization reaches an uneconomic status which otherwise be called the breakdown point and recruitment is done at this point of time. The time to attain the breakdown point is an important characteristic for the management of the organization. Many models could be seen in, Barthlomew [1] and Barthlomew and Forbes [2].Many researchers [3] [4] and[6] have considered the problem of time to recruitment in a marketing organization under different conditions. Srinivasan and Saavithri [5] have considered a single grade system under univariate policy of recruitment with the assumption that sur-vival times follow geometric process and the threshold level as a non-negative constant. They have obtained mean time to recruitment and the long run average cost. Uma.et.al [7] have studied the work of Srinivasan and Saavithri [5] by considering the threshold level of the organization as continuous random variable fol-lowing exponential distribution and having SCBZ property. Recently, Vijaysankar et.al [8] have constructed a stochastic model by assuming the threshold with two components namely the level of wastage which can be allowed and the manpower which is available from what is known as backup resource. The threshold can be treated now as the total of the maximum allowable attrition and the maximum available backup resource. The backup resource is similar to the manpower inventory on hand which can be utilized whenever it be-comes necessary. The present paper studies the problem of time to recruitment for a single grade system with survival times follow geometric process and the threshold level has two components.
∗Corresponding author.
2
Model Description
Consider a single grade organization with univariate policy of recruitment which takes decisions at ran-dom epoch. At every decision making epoch a ranran-dom number of persons quit the organization. There is an associated loss of manhours to the organization if a person quits. The loss of manhours at any decision forms a sequence of independent and identically distributed random variables. The survival time process is a geometric process and it is independent of process of loss of manhour. There is a threshold level for the level of wastage and also a resource backup available. If the total loss of manhours crosses the sum of the threshold and the resource backup available the break down occurs. The process that generates the loss of manhours and the threshold put together with the backup are linearly independent. Recruitment takes place only at decision points and time of recruitment is negligible. . The recruitment is made whenever the cumulative loss of manhours exceeds its threshold.
3
Notations
Sn: survival time after(n−1)thdecision.
Xn: the loss of manhours at thenthdecision.
Tn: the cumulative loss of manhours in the firstndecisions.
K(·): distribution function ofSnwith mean λ
an−1, a>1.
G(·): distribution function ofXn, n=1, 2, 3, . . . . Gn(·): distribution function ofTn.
T: The threshold of manpower depletion andT=Y1+Y2.
(i)Y1=the maximum allowable attrition.
(ii)Y2=the maximum available backup resource. F(·): distribution function ofT.
W: time to recruitment under the given recruitment policy.
4
Results
In this section the expected time to recruitment is derived.
By assumption the recruitment is made whenever the cumulative loss of manhours exceeds the threshold T. Accordingly the time to recruitmentW =S1, ifT1>T. IfT1≤Tthen no recruitment is made till the next decision. IfT2exceedsTthen recruitment is made andW =S1+S2, otherwise no recruitment. In general, if Tk >Tthen recruitment is made andW =S1+S2+...+Skand ifTk≤Tno recruitment is made till the next decision.
Consequently,
W=
∞
∑
i=0i
∑
j=0Sj+1χ(Ti ≤T≤Ti+1), (1.1)
where
χ(e) =
(
1, if the eventehappens
The expected time to recruitmentE(W)is given by
E(W) =
∞
∑
i=0i
∑
j=0E(Sj+1)P(Ti≤T≤Ti+1) (1.3)
=
∞
∑
i=0i
∑
j=0
λ
aj
P(0≤T−Ti<Ti+1−Ti)
=
∞
∑
i=0i
∑
j=0λ aj Z ∞ 0 Z ∞ 0
Z t+s
t
dF(u)dG(s)dGi(t). (1.4)
Assume that the loss of manhours at theithdecisionXi, follows exponential distribution with parameter
θ1. Then the cumulative loss of manhoursTifollows gamma distribution with parameterθ1andi. Hence dGi(t) =θ1iti−1 e
−θ1t
(i−1)!dt, i=1, 2, 3, . . . ,
LetY1∼exp(θ2)andY2∼exp(θ3). Since the p.d.f ofTis the convolution ofT1+T2and it is given by
f(u) = θ2θ3
θ2−θ3
h
e−θ3u−e−θ2ui.
Now the time to recruitment in equation (1.4) becomes
E(W) =
∞
∑
i=0i
∑
j=0λ aj Z ∞ 0 Z ∞ 0
Z t+s
t
θ2θ3
θ2−θ3
h
e−θ3u−e−θ2uidudG(s)dGi(t)
=
∞
∑
i=0
aλ
a−1 1−
1 ai+1
Z ∞
0
Z ∞
0
Z t+s
t
θ2θ3
θ2−θ3
h
e−θ3u−e−θ2uidudG(s)dGi(t)
=
∞
∑
i=0
aλ
a−1 1−
1 ai+1
θ2θ3
θ2−θ3
Z ∞
0
Z ∞
0
Z t+s
t
h
e−θ3u−e−θ2uidudG(s)dGi(t)
On simplification, the time to recruitment is
E(W) = aλθ2θ3
(a−1)(θ2−θ3)
a(θ3+θ1)−θ1−θ3) aθ3(θ1+θ3)−θ1θ3
−a(θ2+θ1)−θ2−θ1) aθ2(θ1+θ2)−θ1θ2
.
5
Numerical Illustration
The value ofE(W) can be determined numerically using the above expression when the values of the various parameters are given. The changes inE(W)consequent to the changes in each of these parameters when other parameters are kept fixed are also possible.
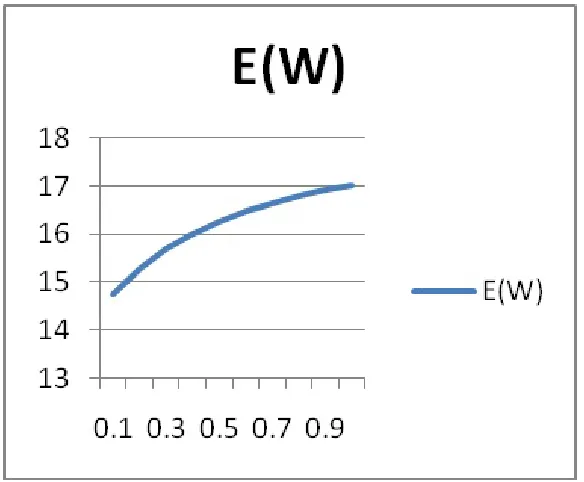
Effect of loss of manhours on performance measure:
θ1 E(W) 0.1 14.7429 0.2 15.2800 0.3 15.6848 0.4 16.0000 0.5 16.2517 0.6 16.4571 0.7 16.6277 0.8 16.7714 0.9 16.8941 1.0 17.0000 Table 1.1
Figure 1: Figure 1.11
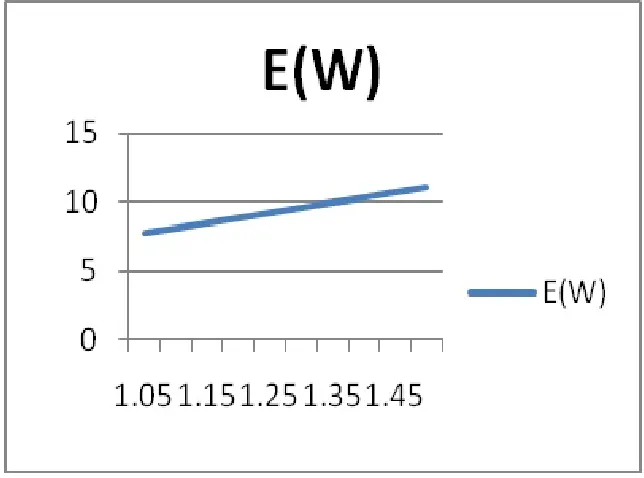
Effect ofλon performance measure
λ E(W)
1.05 7.7400 1.10 8.1086 1.15 8.4771 1.20 8.8457 1.25 9.2143 1.30 9.5829 1.35 9.9514 1.40 10.3200 1.45 10.6886 1.50 11.0571
Table 1.2
Figure 2: Figure 1.21
Effect ofaon performance measure
a E(W)
2 7.3714 3 5.5851 4 4.9825 5 4.6793 6 4.4967 7 4.3746 8 4.2873 9 4.2217 10 4.1706
Table 1.3
Figure 3: Figure 1.31
6
Conclusion
From the above tables we observe the following :
Case(i): If the value of the parameterθ1 increases, the mean loss of manhours decreases and hence the expected time to recruitment increases as shown in Table 1.1 and Figure 1.11.
Case(ii): If the value ofλincreases ,the expected time to recruitmentE(W)also increase as shown in Table
1.2 and Figure 1.21.
Case(iii): Asaincreases the mean survival time λ
ai−1 decreases and hence the expected time to recruitment decreases as in Table 1.3 and Figure1.31.
References
[1] D.J. Bartholomew,Stochastic Model for Social Process, 2nd Edition, John Wiley and Sons, New York, 1973.
[2] D.J. Bartholomew and A.F.Forbes, Statistical Techniques for Manpower Planning, John Wiley, Chichester, 1979.
[3] R. Sathyamoorthi and R. Elangovan, A shock model approach to determine the expected time to recruit-ment ,Journal of Decision and Mathematical Sciences, 2(1-3)(1998), 67-68.
[4] R. Sathyamoorthi and S. Parthasarathy, On the expected time to recruitment in a two grade marketing organization,IAPQR Transactions, 27(1)( 2002), 77-80.
[5] A. Srinivasan and V. Saavithri, Cost analysis on univariate policies of recruitment,International Journal of Management and Systems, 18(3)(2002), 249-264.
[6] A. Srinivasan and K. Kasturri, Expected ttime for recruitment with correlated inter-decision times of exits when threshold distribution has SCBZ property,Acta Ciencia Indica, XXXI M.(1)(2005), 277-283.
[8] N. Vijayasankar, R. Elangovan and R. Sathiyamoorthi, Determination of expected time to recruitment when backup resource of manpower exists,Ultra Scientist, 25(1)B(2013), 61-68.
Received: January 30, 2014;Accepted: March 5, 2014.
UNIVERSITY PRESS