Deep Tweets Analyzer Model for Twitter Mood
Visualization and Prediction Based Deep Learning
Approach
Maha Alghalibi
1*, Adil Al-Azzawi
2, Kai Lawonn
11 University of Koblenz-landau, Computational Visualistics Dept., Koblenz-Germany. 2 University of Missouri-Columbia, EECS Dept., USA.
* Corresponding author. Tel.: 015779114824; email: [email protected] Manuscript submitted September 3, 2018; accepted November 22, 2018. doi: 10.17706/ijcce.2019.8.1.1-17
Abstract: In many of today’s big data analytics applications, it might need to analyze social media feeds as well as to visualize users’ opinions. This will provide a viable alternative source to establish new metrics in our digital life. Social interaction with people in Twitter is open-ended, making media analysis in Twitter easier in comparison with other social media. That is because the interaction in those media is often different since most of them are private. This work is therefore devoted to focus merely on design and implementation a Deep model for Twitter opinion (Mood) visualization based Deep Learning network. It is concerned with Natural Language Processing (NLP)-based sentiment analysis and Deep Learning framework for Twitter’s opinion mining visualization and classification. The utilized methodology is based on applying sentiment analysis NLP on a large number of tweets in order to visualize the predicted mood scoring of the tweet and thus to exploit public tweeting for knowledge discovery. This will moreover serve for fake news detection. The pertinent mechanism involves several consecutive steps, namely: dataset collection stage, the pre-processing stage, NLP stage, sentiment analysis stage, and prediction and classification stage using Deep Learning Model. The U.S. Airlines Sentiment Analysis Twitter dataset has been utilized which is already provided with Data for Everyone. The presented system is monitoring Twitter streams from both the media and the public. It is capable to visualize and extract meaningful data from tweets in real-time and store them into a Deep model for analysis. It is convenient for a wide application spectrum involving: big data analytics solutions, predicting e-commerce customer’s behavior, improving marketing strategy, getting market competitive advantages, besides visualization in various data mining applications.
Key words: Deep learning, data mining and web mining, visualization in social networks, NLP and sentiment analysis, machine learning.
1.
Introduction
decision-making. Data mining is hereby an inter-disciplinary subfield of Computer Science representing a process of examining large pre-existing databases to generate new information. It is the practice of discovering patterns in large data sets involving methods of machine learning, statistics, and database systems [2]. ‘Web mining’ is the application of data mining techniques to extract knowledge from the World Wide Web through discovering pertinent patterns. Web mining can thus be divided into three different types – Web usage mining, Web content mining and Web structure mining [2], [3]. Visualization in social networks denotes presenting the conceptual data to intensify person’s realization and open out the concealed relations along with the data. Visualization of web information has thus become unavoidable for end users to get their preferred information easily, rapidly, and correctly from the extremely huge Web [4]. Natural-language processing (NLP) is the area of computer science and artificial intelligence that is concerned with the interactions between computers and human languages. In particular, this implies how to program computers to fruitfully process large amounts of natural language data. Challenges in natural-language processing frequently involve speech recognition, natural-language understanding, and natural-language generation [2], [5]. Sentiment analysis (or sentimental analysis or opinion mining) is a term frequently used to turn up at a dual verdict: users like or dislike something, or the product is good or bad, or someone is either with or against something. Sentiment analysis is the use of NLP, text analysis, and statistics to recognize the ‘emotional attitude’ pertinent to text into affirmative (positive), unenthusiastic (negative), or impartial (don’t-care/neutral)) classes [4]-[8]. Machine learning is an artificial intelligence procedure that replicates/simulates the manner in which the brain of human being functions, aiming to furnish computers with intelligence. It is widely exploited in systems seeking knowledge discovery and applying data mining that are referred to as knowledge-based systems and expert systems. Comprehensively revised techniques for machine learning often incorporate artificial neural network (ANN). The support vector machine (SVM), is a new statistical machine learning and data mining tool [3], [5].
This paper is keen to unveil the most relevant sides concerning NLP-based sentiment analysis for Twitter’s opinion mining. It utilizes data mining approach of text-feature extraction, and classification, to analyze and visualize Twitter’s opinion.
2.
Related Works
between the geographic area and emotion using Twitter data. They have used data from Geo-Twitter to analyze the reasons underlying the occurrence of local criminal activity. The Location-based Social Networks (LBSNs) data has been used to model and understand human-mobile behavior patterns of local criminal activities [6]. Haddia et al. (2013) have done a pretty good job in articulating the role of text pre-processing in sentiment analysis for mining online opinion. Through experimental results they demonstrated, with appropriate feature selection and representation, that sentiment analysis accuracies in this area using support vector machines (SVM) may be significantly improved [7]. Molla et al. (2014) presented their work about network-based visualization of users’ opinion mining and sentiment analysis on Twitter. They developed a free and open source system that can take the opinion of users in raw text format and produce easy-to-interpret visualization of opinion mining and sentiment analysis result on a social network. Public machine learning library called LingPipe Library has been utilized to classify the sentiments of users’ opinion into positive, negative and neutral classes [8]. Krebs et al. (2017) introduced their work (based on convolutional and recurrent neural networks) regarding social emotion mining techniques to predict users’ reactions in Facebook posts. They proposed and evaluated alternative methods for predicting these reactions to user posts on public pages of firms/companies (like supermarket chains) [9]. Lasty, Mohata and Dhande (2015) have elaborated ‘two’ effective techniques to mine the big data, one with Apache Hadoop Map Reduce and the second with visualization based technique named as Visual Web Mining (VWM). They found out that VWM is effective for visualizing and gleaning the front end insight of big data, whereas Apache Hadoop and other similar technologies are efficient to support back-end concerns such as storage and processing [10].
3.
Background Theory
substitutes the fully connected layers in CNNs by full convolution layers and assigns class labels to each individual pixel in the image instead of one label per image block.
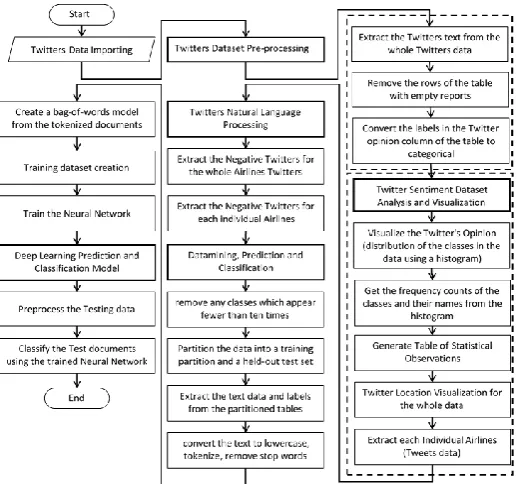
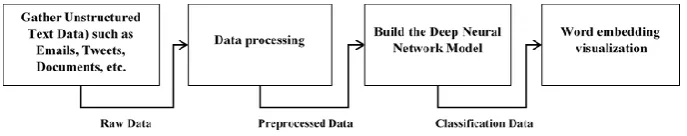
Text mining using Deep Learning is initially process many documents that are gathered. In other words, text mining using Deep Learning approaches and tool that is mainly used to extract the information or features form the document and process them [21].The main stage of the text mining using Deep Learning approaches is the text analysis or the pre-processing step. In this step, some techniques are repeatedly used until some relevant information is extracted from the process documents in this stage [22]. Deep Learning approaches or tools organize the document or data structure from the databases once whereas text Deep Learning approach extract some information from the semi-structured and structured dataset such as e-mails, text, HTML files etc. [21]. However, use Deep Learning tools and approaches are the best option to organize and handle the online data [15]. A high-level general approach for text mining using Deep Learning is illustrated in Fig. 1.
Fig. 1. A high level of text mining general approach using deep learning approach.
Opinion Mining Based Classification Approaches
3.1.
In general, opinion mining approaches as it has been shown in a high-level abstraction and general approach in Fig. 1, the opinion mining using machine learning consists of many tasks and functions such as opinion clustering, opinion concept/entity extraction, opinion summarization, and opinion classification.
One of the most important approaches for text mining using machine learning tools is the text classification. Text classification which is also known as a text categorization. Text classification is defined as the task of automatically defining the unlabeled documents into predefined classes [23]. Option classification approach as a task of machine learning should clearly predefine the mathematical model. In addition to the mathematical model, in this case, we should pre-define the feature extraction model that is mainly used for extracting the feature vector that is used later to feed the machine learning model [24].
Convolutional Neural Network Based Opinion Classification Approach
3.2.
Convolutional Neural Network (CNN) is a function 𝑔 that denoted by that mapping data 𝑥, to another output vector that denoted by 𝑦 . Then, the function 𝑔 is the intensive combination of a sequence of simpler functions 𝑓𝑙, which we call computational blocks, or layers that dented by 𝑔 = 𝑓1… 𝑓𝐿. Assume the network input is 𝑥0= 𝑥, and the network outputs are 𝑥1, 𝑥2, . . . , 𝑥𝐿. . Where each output is deeply computed from the previous output 𝑥𝑙− 1 by applying the function 𝑓𝑙 with the parameters of 𝑤𝑙 as is denoted in (1) [25].
𝑥𝑙 = 𝑓𝑙(𝑥𝑙− 1; 𝑤𝑙) (1)
denoted by for all tested image [25].
𝑦̂ = 𝑓(𝑥) (2)
If 𝑦 is the true label of data, CNN performance of true label 𝑦 of data 𝑥 is measured by a loss function which assigns a penalty to classification errors [25].
Convolutional layer convolves the result of previous layer with a set of learnable filters [26] as shown in Fig. 2, where the weights specify the convolution filter. Each filter is sliding across the width and height of the input volume, producing a 2-dimensional activation map of that filter. The filters have the same depth as in the input [27], [28]. The size of the output can be controlled by three hyper parameters which are the depth, stride and zero-padding. The Depth of the convolutional layer it is basically the number of filters that is applied to the input data. While the stride number of convolutional filters allows the filter jumps while sliding over the data size dimensions. Finally, the zero-padding: padding zeros around the borders of the input to preserve its size. Fig. 2 shows the processing example with it.
Fig. 2. Convolutional neural network (deep learning) structure [28].
Pooling layer reduces the size of their input and allows multi-scale analysis. Max-pooling and average-pooling are the most popular pooling operators (Fig. 2). These operators compute the maximum or the average value within a small spatial block [27]. Pooling with filters size of 2 × 2 with a stride of 2 are considered ideal [29]. Fig. 2 illustrates max pooling operation with 2 × 2 filters. Also, it shows an example of max 2 × 2 pooling layer that it is used to reduce the spatial size of the representation to reduce the number of parameters and computation in the network.
Fully-connected layer connects to all the neurons of the previous layer (Fig. 2) [29]. Fully connected layers are typically used as last layer of the network and perform the classification. A sample of CNN is depicted in Fig. 2 which shows all the two previously demonstrated layers.
Mathematical Opinion Mining Classification Model
3.3.
The mathematical definition of the opinion mining and classification model relies on the demonstration of documents to get the ability to correctly execute a categorization task. Moreover, text classification may define as it given in (3) [24]:
𝑥 = (𝑥1, 𝑥2, … , 𝑥𝑛) (3)
example. The training set examples has input with associated labels or target output. Basically, the training examples are in the form of the attribute vectors, which means that the input is a subset of 𝑅𝑛 [24].
For example, consider an input 𝑋 = (𝑥1, 𝑥2, … , 𝑥𝑛) where 𝑋 belongs to an n-dimensional vector space
𝑅𝑛 and 𝑥1, 𝑥2, … , 𝑥𝑛 are the components of the vector 𝑋. In this case, is assigned to the positive class whereas the function of,𝑓(𝑥) ≥ 0 and to the negative class if 𝑓(𝑥) < 0 as it given in (4) [24].
Output = {Postive, if 𝑓(𝑥) ≥ 0Negative, if 𝑓(𝑥) < 0 (4)
In this case, the function 𝑓(𝑥) presents as a decision function where each vector has a target attribute. In other word, the target label will be defied in 𝑌 ∈ *−1, +1+, where𝑖 = 1, … , 𝑛, and -1, +1 are the negative and positive classes [24].
Typical model for machine learning learns the mapping function which implies as 𝑋 ⇒ 𝑌, in this case can be represented by a set of possible learned mapping such as it given in (5) [30]
𝑂𝑋 ⇒ 𝑓(𝑋, 𝛼) (5)
where 𝛼 is a set of parameters that associated with the function 𝑓(𝑥). For instant, a given input of 𝑋 and a parameter 𝛼 that should be chosen in some who, the machine learning model gives always the approximately same output [30]. The number of classes gives an indication about the classification model construction. For example, in case of having two classes, the goal here is to construct a binary classifier, which is constructed from the training samples. However, the predictor-target value pairs for training the machine has a small probability of misclassifying or classification error) on a testing sample which the predictor-target value pairs for testing the machine [31]. For instant, as an example the document classification problem 𝑋 which is presented as a feature vector. This feature vector consists of a frequency of distinct (distribution) keywords, and 𝑌 which presented as a user define category (label) of this document [30], [32].
The fully connected layer of the CNN structure can be trained by a technique known as Supervised Learning. In this technique, input samples are presented to the network together with a set of desired responses at the output layer. The differences (errors) between the desired and actual response for each node in the output layer, are found. Weight changes in the network are determined according to a certain learning algorithm. The objective is to create the input-output model with correct mapping such that for unseen inputs, their outputs can be predicted successfully [33]. Learning, or training is a process in which the parameters of the network are changed to make differences between the actual output and the desired output as small as possible [34]. The weights are initialized in a random manner and changed in the direction that reduces error. The change in weights is given in (6).
∆𝑤 = −𝜂𝜕𝑤𝜕𝐸 (6)
where 𝜂 is the learning rate that indicates the relative size of change in weights? The output result for neuron j from the input units 𝑥𝑖 = (𝑥1, 𝑥2, . . . , 𝑥𝑁) is given in (7):
𝑛𝑒𝑡𝑗 = ∑𝑛𝑖=1𝑤𝑗𝑖𝑥𝑖+ 𝑤𝑗0= ∑𝑖=0𝑛 𝑤𝑗𝑖𝑥𝑖 = 〈𝑤𝑗, 𝑥〉 (7)
is the number of input units. 𝑤𝑗𝑖 Refers to the input-hidden weights at the hidden unit 𝑗. The output of neuron 𝑗 obtained by applying the activation function 𝑓 on the net output 𝑛𝑒𝑡𝑗 is obtained in (8):
𝑦𝑖= 𝑓(𝑛𝑒𝑡𝑗) (8)
For the hidden units, the outputs to the neuron 𝑘 of the output layer are derived from (10):
𝑛𝑒𝑡𝑘= ∑𝑛𝑗=1𝑣𝑘𝑖𝑦𝑗+ 𝑣𝑘0= 〈𝑣𝑘, 𝑦〉 (9)
where subscript 𝑘 denotes the index unit of the output layer and 𝑝 is the number of the hidden units.
𝑧𝑘= 𝑓(𝑛𝑒𝑡𝑘) (10)
4.
Propose System
Twitter is a good starting point for social media opinion analysis because people openly share their opinions to the public. This is very different from Facebook, where social interactions are often private. In this Paper, we propose such an Opinion-Ming approach that illustrated in Fig. 3 base Deep Learning. The propose system has three main parts. The first one is the twitters dataset preprocessing based on the Natural Language Processing (NLP) tools. Second ally, Twitters dataset visualization. Finally, Datamining approaches for twitters opinion mining prediction and classification based Deep Learning Approach.
Fig. 3. Opinion-mining based deep learning propose approach.
4.1.
Twitters Dataset Pre-processing Based Natural Language Processing
Twitter opinion column of the table to categorical the twitters opinion in the whole data. Three different steps are implemented in this step. Then, we remove words from the bag-of-words model that do not appear more than two times in total. After that, we remove any documents containing no words from the bag-of-words model and remove the corresponding entries in labels.
4.2.
Twitter Sentiment Dataset Analysis and Visualization
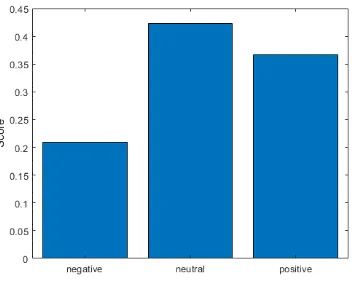
In this step, we visualize the Twitter's Opinion based on the distribution of the classes in the data using a histogram. Which is very common analyses way that can be performed on a large number of tweets is sentiment analysis. Sentiment analysis is scored based on the words contained in a tweet. Sentiment analysis provides a convenient way to take the pulse of the tweeting public. The sentiment distributions are nearly identical between the two brands, but we can see that tweets mentioning both have clearly skewed to the negative.
4.3.
Deep Learning Prediction and Classification
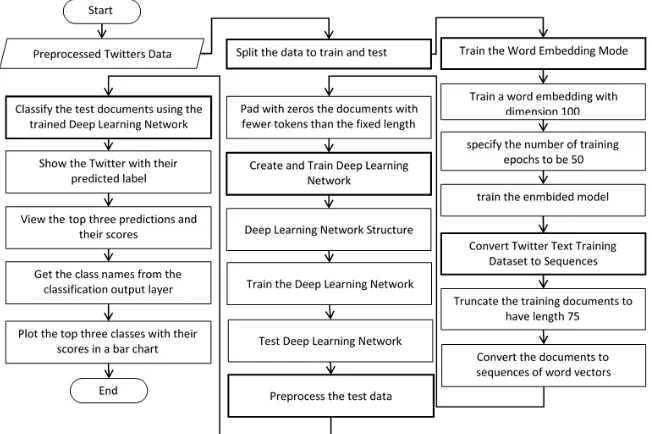
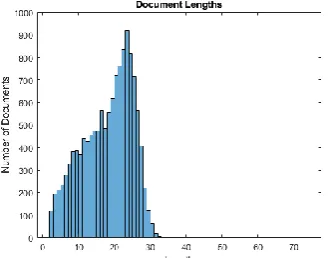
Datamining approaches are using in this step for Twitters opinion mining production and classification. In this task, we use some datamining techniques such as dimensionality reduction and feature selection as well as supervised learning classification framework. To implant that, some significant steps are implemented such as: Preprocess the training data. Erase the punctuation, convert the text to lowercase, and then tokenize. Do not stem or remove words, as these steps can lead to a worse word-embedding fit. Word embedding’s map words in a vocabulary to numeric vectors. These embedding’s can capture semantic details of the words so that similar words have similar vectors. They also model relationships between words through vector arithmetic. For example, the relationship "king is to queen as man is to woman" is described by the equation king – man + woman = queen. The input the documents into the deep Learning network, convert the documents into sequences of word vectors. In this case, when training the network, the software creates mini-batches of sequences of the same length by padding, truncating, or splitting the input data. The training Options function provides options to pad and truncate input sequences; however, these options are not well suited for sequences of word vectors. Instead, you must pad and truncate the sequences manually. If you left-pad and truncate the sequences of word vectors, then the training might improve. The first conversion step is to choose a target length, and then truncate documents that are longer than it and left-pad documents that are shorter than it. For best results, the target length should be short without discarding large amounts of data. To find a suitable target length, view a histogram of the training document lengths. Most of the training documents have fewer than 75 tokens. Truncate the training documents to have length 75.
The anonymous function inputted to documents function takes string array input and outputs the first 75 elements. Convert the documents to sequences of word vectors. To convert the training documents into a cell array of sequences, use the example function doc2sequence, shown at the end of this example. The columns of each sequence are the word vectors. If you have Parallel Computing Toolbox™ installed, then the function loops through the documents in parallel. Otherwise, the function loops through the documents in series and can take a few minutes to run. Pad with zeros the documents with fewer tokens than the fixed length. To pad sequences of word vectors for Deep Learning network model, you must left-pad the sequences. The sequence padding option for Deep Learning network model, by default, right-pads the sequences, so you must do this manually.
4.4.
Create and Train the Deep Learning Network
Define the Deep Learning network architecture. To input sequence data into the network, include a sequence input layer and set the input size to be the dimension of the word embedding. Next, include a Deep Learning Network layer and specify the output size to be 180. To use the Deep Learning Network layer for a sequence-to-label classification problem, set the output mode to be 'last'. Finally, add a fully connected layer with the same size as the number of classes, a SoftMax layer, and a classification layer. The Deep Learning structure model is described in Table 1.
Table 1. Architecture of the CNN Training/Testing Model for the Final Classification Approach
Layer Number Layer Type Parameter
Kernel No. Dimension
Layer 1 Sequence Input - 100
Layer 2 LSTM - 100
Layer 3 Fully Connected - 3
Layer 4 SoftMax - -
Layer 4 Classification Output - Crossentropyex
The general flowchart of the Deep Learning Model that has been used in our approach is illustrated below in Fig. 4:
Fig. 4. Deep learning twitter opinion mining classification approach.
5.
Experimental Results
about actual and predicted classifications done by a detection system. Performance of such systems is commonly evaluated using the data in the matrix. Each column of the matrix represents the instances in a predicted class, while each row represents the instances in an actual class. The confusion matrix shows the classes which are correctly classified and the classes that are misclassified. Confusion matrix is used to evaluate these parameters [35].
5.1.
Airlines Statistical Observation and Visualization
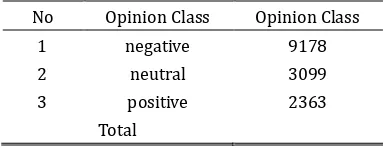
The first experimental result is to visualize the whole Twitters opinion based on the classes (mood) distribution for whole dataset. Fig. 5 and Table 2 show the sentiment analysis (opinion histogram) and the statistical measurement for the whole Airlines Twitters dataset based on the observation using the statistical measurement for each mood class.
Fig. 5. Whole airlines twitters opinion statistical observation.
Table 2. Whole Airlines Statistical Oservation
No Opinion Class Opinion Class
1 negative 9178
2 neutral 3099
3 positive 2363
Total
5.2.
The Whole Twitters Dataset Visualization:
In this experimental result, we visualized the (Twitters location) for the whole Dataset as an indication for the twitter opinion locations based on the word cloud visualization. Fig. 6 shows the word cloud visualization of each twitters mood location. Extract each individual Airlines Tweets: In this experimental, we also extract the statistical observation of each individual Airlines.
Fig. 7. Sentiment analysis (opinion histogram) of the Twitters mood for each individual airlines.
Fig. 7 show the sentiment analysis (opinion histogram) of the Twitters mood based on the Twitter opinion for each individual Airlines.
5.3.
Negative Reasons Observation of the Whole Airlines
In this experimental result, we extract and visualized the negative reasons for whole Airlines. Table 3 shows the negative reasons observation and sentiment analysis for the whole dataset. We extract and visualized the negative reasons for each individual Airlines. Table 5 shows the (statistical observation and the sentiment analysis) for each individual Airlines in the whole dataset.
Table 3. Negative Reason Observation for Whole Airlines
No Negative Reason Counted No.
1 Late Flight 1665
2 Damaged Luggage 74
3 Longlines 178
4 Customer Service Issue 2910
5 Can not Tell 1190
6 Flight Attendant
Complaints 481
7 Cancelled Flight 847
8 Flight Booking Problems 529
9 Bad Flight 580
10 Lost Luggage 724
Table 4. Training Setting Parameter
Training Parameter Setting Value
Momentum 0.9000
Initial Learnning Rate 0.0100
Learnning Rate Schedule Setting DropRateFactor 0.2
DropPeriod 5
Training Parameter Setting Value
MaxEpochs 20
MiniBatchSize 32
Verbose 1
Verbose Frequency 50
Validation Data Frequency 50
Validation Patience 5
Shuffle 1
Sequence Padding Value 0
Table 5. Statistical Observation of Each Airlines
Airlines Name Statistical Observation Airlines Name Statistical Observation
Virgin America
Negative 181
US_Airways
Negative 2263
Neutral 171 Neutral 381
positive 152 positive 269
Delta
Negative 955
United
Negative 2633
Neutral 723 Neutral 697
positive 544 positive 492
Southwest
Negative 1186
American
Negative 1960
Neutral 664 Neutral 463
positive 570 positive 336
5.4.
Deep Twitters Opinion Mining Training Model
The performance of the opinion mining detection and classification system using Deep Learning Approach can be evaluated using various parameters. By default, train Network uses a GPU if one is available (requires Parallel Computing Toolbox™ and a CUDA® enabled GPU with compute capability 3.0 or higher). Otherwise, it uses the CPU. To specify the execution environment manually, use the 'Execution Environment' name-value pair argument of training Options. Training on a CPU can take significantly longer than training on a GPU.
To train the Deep Learning network first, we have to input the documents into a Deep Learning Network structure (LSTM network), by converting the documents into sequences of word vectors. Then when training the Deep Learning Network (LSTM Network), the model creates mini-batches of sequences of the same length by padding, truncating, or splitting the input data. The training options function provides options to pad and truncate input sequences; however, these options are not well suited for sequences of word vectors. Instead, of that there is must pad and truncate the sequences manually. The training setting parameters that are used in our Deep Learning model is shown in Table 4.
The first step of training the Deep Twitter Opinion Mining prediction is to choose the data (Twitter text) target length, and then truncate documents that are longer than it and left-pad documents that are shorter than it. For best results, the target length should be short without discarding large amounts of data. To find a suitable target length, view a histogram of the training document lengths as is shown in Fig. 8.
Fig. 9. Overall performance results of the deep opinion mining approach (training accuracy).
The overall training progress of the Deep Twitter opinion-mining approach using Deep Learning approach and the loss function plot are shown in Fig. 8 and Fig. 9.
Fig. 10. Predict visualization of the deep twitter opinion mining prediction model.
Fig. 11. Overall performance results of the opinion mining approach (lost function).
5.5.
Deep Twitters Opinion Mining Visualization and Prediction Model
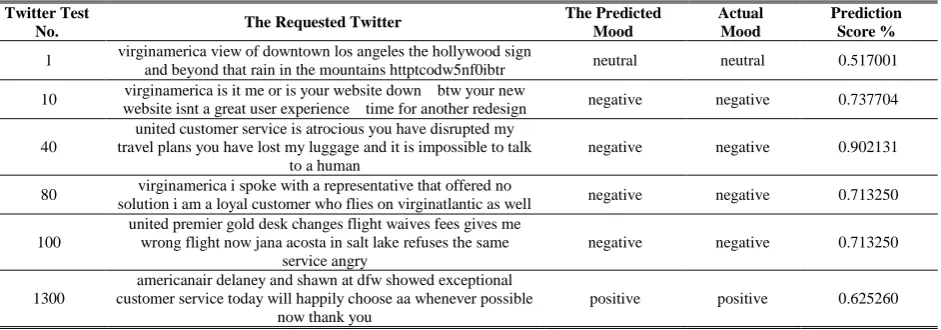
(Twitters text data), we use the trained parameters to predict each Twitter mood using the Deep Learning test model. In term of visualize the Twitter Opinion prediction or (Mood) we visualize the top three predictions and their scores for each Twitter in the testing data. Sort the prediction scores and select the top three values and visualize them. Fig. 10 shows as example of the first tweets in the testing dataset as well as the corresponding visualized cores of each predicted mood (opinion). An example of the overall Deep Twitter Opinion Mining prediction outcome is shown in Table 6 and the predicted mood visualization is shown in Fig. 11.
Table 6. Overall Tested Samples of the Mood Predict Visualization Results
Twitter Test
No. The Requested Twitter
The Predicted Mood Actual Mood Prediction Score %
1 virginamerica view of downtown los angeles the hollywood sign
and beyond that rain in the mountains httptcodw5nf0ibtr neutral neutral 0.517001
10 website isnt a great user experience time for another redesign virginamerica is it me or is your website down btw your new negative negative 0.737704
40
united customer service is atrocious you have disrupted my travel plans you have lost my luggage and it is impossible to talk
to a human
negative negative 0.902131
80 virginamerica i spoke with a representative that offered no
solution i am a loyal customer who flies on virginatlantic as well negative negative 0.713250
100
united premier gold desk changes flight waives fees gives me wrong flight now jana acosta in salt lake refuses the same
service angry
negative negative 0.713250
1300
americanair delaney and shawn at dfw showed exceptional customer service today will happily choose aa whenever possible
now thank you
positive positive 0.625260
6.
Conclusion
Social media has become an important part of modern life, and Twitter is again a center of focus in recent events. Whatever your opinion of social media these days, there is no denying it is now an integral part of our digital life. Twitter is a good starting point for social media analysis because people openly share their opinions to general public. This is very different from Facebook where social interactions are often private. In this paper, we propose a Deep Learning framework for Twitter opinion mining prediction and classification approach. Also, we used the Deep Learning model for Twitter Opinion abstraction and visualization scheme. The main contribution of this work is to propose such a new visualization model for Twitter mood prediction based on Deep Learning approach. The propose system visualizes the top three predictions and their scores for each Twitter in the testing data after the Deep Learning model is trained using the trained dataset that has randomly selected from the original dataset. Then the propose system is sorting the prediction scores and select the top three values and visualize it as a main predicted Twitter mood (opinion).
Acknowledgment
This work was partially supported by Ministry of Higher Education and Scientific Research (MHESR), Iraq, University of Koblenz Landau, Germany, HCED (Higher Committee for Education Development in Iraq).
References
[1] Yao, F., Chang, K. C. C., & Campbell, R. H. (2015). Ushio: Analyzing news media and public trends in Twitter. Proceedings of the 2015 IEEE/ACM 8th Int. Conf. Util. Cloud Compute. UCC 2015 (pp. 424-429). [2] Mohata, P. B. (2015). Web data mining techniques and implementation for handling big data.
International Journal of Computer Science and Mobile Computing, 4(4), 330-334.
for Facebook posts reaction prediction. Cornell University. arXiv: 1712.03249v1 [cs.AI].
[4] Molla, A., Biadgie, Y., & Sohn, K. A. (2014). Network-based visualization of opinion mining and sentiment analysis on twitter. Proceedings of the2014 Int. Conf. IT Converge. Secure, ICITCS 2014 (pp. 2012-2015).
[5] Haddi, E., Liu, X., & Shi, Y. (2013). The role of text pre-processing in sentiment analysis. Procedia Compute. Sci., 17, 26-32.
[6] Kumar, M., & Bala, A. (2016). Analyzing Twitter sentiments through big data. Proceedings of the 10th
Indiacom - 2016 3rd Int. Conf. Compute. Sustain. Glob. Dev. (pp. 262-263).
[7] Algur, S. P., & Patil, R. H. (2018). Sentiment analysis by identifying the speakers polarity in Twitter data . Proceedings of the Int. Conf. Electra. Electron. Commun. Compute. Technol. Optima. Tech. ICEECCOT 2017 (pp. 898-902).
[8] Kitaoka, S., & Hasuike, T. (2018). Where is safe: Analyzing the relationship between the area and emotion using Twitter data. Proceedings of the 2017 IEEE Symp. Ser. Compute. Intel. SSCI 2017 (p. 18). [9] Bhardwaj, A., Vanraj, A., Kumar, Y., Narayan, & Kumar, P. (2016). Big data emerging technologies: A case
study with analyzing twitter data using apache hive. Proceedings of the 2015 2nd Int. Conf. Recent Adv.
Eng. Compute. Sci. RAECS 2015.
[10] Buntain, C., & Golbeck, J. (2017). Automatically identifying fake news in popular twitter threads.
Proceedings of the2nd IEEE Int. Conf. Smart Cloud, Smart Cloud (pp. 208-215).
[11] Nestorov, S. (2000). Data mining techniques for structured and semi structured data. PHD thesis, Stanford University.
[12] Huiqing, L. (2004). DM: Effective use of data mining technologies on biological and clinical data. PHD thesis, University of Singapore.
[13] Choromanska, A. (2014). Selected machine learning reductions .PHD thesis, Colombia University. [14] Smola, A., & Vishwanathan, S. V. N. (2010, October 1). Introduction to Machine Learning. Cambridge,
United Kingdom: Press Syndicate of the University of Cambridge the Pitt Building. [15] Harrington, P. (2012). Machine Learning in Action. United States of America.
[16] Sainath, T. N., Mohamed, A., Kingsbury, B., & Ramabhadran, B. (2013). Deep convolutional neural networks for lvcsr. Proceedings of the IEEE International Conference on Acoustics, Speech and Signal
Processing (pp. 8614-8618).
[17] Abdel-Hamid, O., Mohamed, A., Jiang, H., & Penn, G. (2012). Applying convolutional neural networks concepts to hybrid nn-hmm model for speech recognition. Proceedings of the IEEE International
Conference on Acoustics, Speech and Signal Processing (ICASSP) (pp. 4277-4280).
[18] Sainath, T. N., Kingsbury, B., Mohamed, A., Dahl, G. E., Saon, G., Soltau, H., Beran, T., Aravkin, A. Y., & Ramabhadran, B. (2013). Improvements to deep convolutional neural networks for lvcsr. Proceedings
of the Workshop on Automatic Speech Recognition and Understanding (ASRU) (pp. 315-320).
[19] Chen, L. C., Papandreou, G., Kokkinos, I., Murphy, K., & Yuille, A. L. (2014). Semantic image segmentation with deep convolutional nets and fully connected CRFs. Cornell University. arXiv:1412.7062 [cs.CV]. [20] Long, J., Shelhamer, E., & Darrell, T. (2015). Fully convolutional networks for semantic segmentation.
Proceedings of the IEEE Conference on Computer Vision and Pattern Recognition (pp. 3431-3440).
[21] Shalev, S., & Ben-David, S. (2014). Understanding Machine Learning: From Theory to Algorithms. Cambridge University Press.
[22] Alpaydn, E. (2010). Introduction to Machine Learning, Second Edition. Massachusetts: MIT Press Cambridge.
[24] Aggarwal, C. C. (2015, March 8). Data Mining: The Textbook. New York: IBM T. J. Watson Research Center Yorktown Heights.
[25] Koushik, J. (2016). Understanding convolutional neural networks. ArXiv preprint arXiv: 1605.09081. [26] Vedaldi, A., & Matconvnet, K. L. (2015).Convolutional neural networks for matlab. Proceedings of the
ACM International Conference on Multimedia (pp. 689-692).
[27] Gibian, A. Sky Convolutional Neural Networks. Retrieved from
http://andrew.gibiansky.Com/blog/machine-learning/convolutional neural-networks/
[28]Convolutional neural networks for visual recognition. Retrieved from http://cs231n.github.dio/convolutional-networks/
[29] Iftene, M., Liu, Q., & Wang, Y. (2016). Very high resolution images classification by fine tuning deep convolutional neural networks. Proceedings of the Eighth International Conference on Digital Image
Processing (p. 100332).
[30] Aggarwal, C. C. (2012). A survey of text classification algorithm. Yorktown Heights: IBMT. J. Watson Research Center.
[31] Guduru, N. (2006). Text mining with support vector machine and non-negative matrix factorization algorithm. University of Rhode Island.
[32] Addis, A. (2016). Study and development of novel techniques for hierarchical text categorization. PHD thesis, Department of Electrical and Electronic Engineering, University of Cagliari.
[33] Haykin, S. (2008). Neural networks and learning machines third edition. McMasterThesis, University Hamilton Canada.
[34] Han, J., & Kamber, M. (2006). Data Mining: Concepts and Techniques. University of Illinois at Urbana Champaign, Elsevier Inc.
[35] Mahindrakar, P., & Hanumanthappa, M. (2013). Data mining in healthcare: A survey of techniques and algorithms with its limitations and challenges. Int. Journal of Engineering Research and Applications, (3), 937-941.
Maha Al-Ghalibi was born in 1982 in Basrah, Iraq. She obtained her bachelor degree in 2004 in computer science from Basrah University. In 2012 she did master in computer science from BAMU University, India. Currently, she is a PhD student at the Faculty of Computer Science, Institute of Computational Visualistics, University of Koblenz-Landau. Her primary interests are visual analytic, big data visualization.
![Fig. 2, where the weights specify the convolution filter. Each filter is sliding across the width and height of Convolutional layer convolves the result of previous layer with a set of learnable filters [26] as shown in the input volume, producing a 2-dime](https://thumb-us.123doks.com/thumbv2/123dok_us/1310397.1638613/5.595.109.486.297.433/specify-convolution-sliding-convolutional-convolves-previous-learnable-producing.webp)