Big Data Analytics
Aliet al. Big Data Analytics (2016) 1:2 DOI 10.1186/s41044-016-0002-4
R E V I E W
Open Access
Big data for development:
applications
and techniques
Anwaar Ali
1, Junaid Qadir
1*, Raihan ur Rasool
1,2, Arjuna Sathiaseelan
3, Andrej Zwitter
4and Jon Crowcroft
3*Correspondence: [email protected] 1Information Technology University (ITU)-Punjab, Lahore, Pakistan Full list of author information is available at the end of the article
Abstract
With the explosion of social media sites and proliferation of digital computing devices and Internet access, massive amounts of public data is being generated on a daily basis. Efficient techniques/algorithms to analyze this massive amount of data can provide near real-time information about emerging trends and provide early warning in case of an imminent emergency (such as the outbreak of a viral disease). In addition, careful mining of these data can reveal many useful indicators of socioeconomic and political events, which can help in establishing effective public policies. The focus of this study is to review the application of big data analytics for the purpose of human development. The emerging ability to use big data techniques for development (BD4D) promises to revolutionalize healthcare, education, and agriculture; facilitate the alleviation of poverty; and help to deal with humanitarian crises and violent conflicts. Besides all the benefits, the large-scale deployment of BD4D is beset with several challenges due to the massive size, fast-changing and diverse nature of big data. The most pressing concerns relate to efficient data acquisition and sharing, establishing of context (e.g., geolocation and time) and veracity of a dataset, and ensuring appropriate privacy. In this study, we provide a review of existing BD4D work to study the impact of big data on the development of society. In addition to reviewing the important works, we also highlight important challenges and open issues.
Keywords: Big data, human development, big data analytics
Introduction
In the modern world we are inundated with data, with companies such as Google and Facebook dealing with petabytes of data [1]. Google processes more than 24 petabytes of data per day, while Facebook, a company founded a decade ago, gets more than 10 mil-lion photosper hour. The glut of data, buoyed by fast advancing technology, is increasing exponentially due to increased digitization of all aspects of modern life (using technolo-gies such as the Internet of Things (IoT) [2]–which uses sensors, for example in the shape of wearable devices, to provide data related to human activities and different behavioral patterns). It is estimated that we are generating 2.5 quintillion bytes per day (we note here that a quintillion bytes, or an exabyte, is equal to 1018bytes) [3].
The presence of “big data”, or this massive amount of increasing data, offers both an opportunity as well as a challenge to researchers. A lot of progress has been made in devel-oping the capability to process, store, and analyze big data: In addition to the big data computing capability (in terms of processing and storing big data in a distributed fash-ion on a cluster of computers [4]), the rapid advances in using intelligent data analytics
Aliet al. Big Data Analytics (2016) 1:2 Page 2 of 24
techniques—drawn from the emerging areas of artificial intelligence (AI) and machine learning (ML)—provide the ability to process massive amounts of diverse unstructured data that is now being generated daily to extract valuableactionableknowledge. This pro-vides a great opportunity to researchers to use this data for developing useful knowledge and insights [5].
From the perspective of big data for development (BD4D), an important quandary is gaining access to important people-related data, which is often in the exclusive access of the government in the form of paper documents. Fortunately the emerging trend known as “open data”, which promotes open public sharing of data from various pub-lic and private sector entities in searchable and machine-readable formats is a boon for BD4D research. Governments worldwide (e.g., in USA [6, 7] and the UK [8]) are increas-ingly adopting open data projects to fuel innovation and transparency. In addition, open source platforms have been developed that facilitate the creation and gathering of dig-ital data from mobile platforms (e.g., the Open Data Kit [9]). While open data can be rightly regarded as a subset of all the available big data: the nuance is in the liquidity of big data [10]. Open data also promotes a culture of creativity and public wellbeing as is evident by different hackathons that are being organized to tap the potential of open data in terms of useful mobile applications (e.g., the local government of Rio de Janeiro has created the Rio Operation Center [11, 12] aimed at harnessesing the power of technology and big data to run the city effectively in terms of transport management, natural disaster relief, mass movement and management of slum areas). In a recent report from McKinsey Global Institute [10], the net worth of open data was estimated to be $3 trillion. In this report, the importance of open data is highlighted for seven particular sectors: educa-tion, health, transportaeduca-tion, consumer products, electricity, oil and gas, and consumer finance.
In 2009, the Secretary-General of the United Nations (UN), Ban Ki-moon started the UN Global Pulse (UNGP)initiative, with the explicit goal of harnessing big data tech-nology for human development [13]. The Global Pulse program is aimed at forming a network of innovation centers, called the Pulse Labs, all over the world. Ideally, these Pulse labs will bring together people from different fields of life together to make use of the free and open source computing methods/ software toolkits to analyze data to help the development and humanitarian operations especially in the developing countries. In [14], Kirkpatrick, the director of the UN Global Pulse innovation initiative, presents the case for deploying big data techniques and analytics in the field of human development. It is highlighted that data—especially from mobile phone and social media—can be uti-lized in fighting hunger, disaster and poverty. This report talks about “data philanthropy” where the companies, whose businesses revolve around data, can collaborate with the UN in predicting imminent humanitarian crises and help take possible steps to avoid situa-tions that can lead to disasters. The report also discusses the issues and challenges faced by the UN in terms of data access, user privacy and the integration of big data techniques into the various UN humanitarian systems.
Aliet al. Big Data Analytics (2016) 1:2 Page 3 of 24
modern society [1, 3], big data also has an immense potential for the field of international human development. We will consider questions such as:
1. How to access and use all of the data that is present out there on the isolated servers of the companies and organizations for the development purposes? 2. What particular areas of development can benefit from big data?
3. What are some of the well-known techniques for big data analytics that can be applied in the BD4D context?
Contributions of this Paper: Despite the great potential of BD4D, the research field of BD4D is only nascent. In this study, we have chosen not to approach the problem of BD4D only from a technological viewpoint, since development is a nuanced subject, we have chosen to adopt a multidisciplinary vantage point (integrating technology, economics, social and development sciences). For this paper, we have reviewed existing research lit-erature, official documents, online projects, blogs and technical reports related directly or indirectly to BD4D. Apart from highlighting the immense potential of BD4D, our work also identifies some of the associated challenges and potential lurking harms that must be understood and countered. Our paper is distinct from existing survey papers [5, 12] in that apart from highlighting the particular development areas that can benefit from big data, we also discuss various techniques for big data analytics, while also describing open issues and directions for future work.
Organization of this Paper: In Section “Background: big data techniques”, we present necessary background related to different techniques that are used to analyze, store and process big data. In Section “Big data for development: development areas”, we present the broad spectrum of areas where big data can play a role in human development. In Section “Big data analytics for development”, we discuss big data analytical techniques in the perspective of mobile, living and visual analytics and link these techniques to various human development opportunities. In Section “Challenges, open issues and future work”, we present a discussion on the challenges of using big data for development and identify open issues and future work. Finally, in Section “Conclusions” we conclude our study with a discussion and our stance related to the revolutionary and transformative power of big data in modern society.
Background: big data techniques
Aliet al. Big Data Analytics (2016) 1:2 Page 4 of 24
Machine learning
Machine learning (ML), a sub-field of artificial intelligence (AI), focuses on the task of enabling computational systems to learn from data about how to perform a desired task automatically. Machine learning has many applications including decision making, fore-casting or predicting and it is a key enabling technology in the deployment of data mining and big data techniques in the diverse fields of healthcare, science, engineering, busi-ness and finance. Broadly speaking, ML tasks can be categorized into the following major types:
Supervised learning
In this class of ML, the learning task is to generalize from a training set, which is labeled by a “supervisor” to contain information about the class of an example, so that predic-tions can be made about new, yet unseen, examples. If the output (or prediction) belongs to a continuous set of values then such a problem is calledregression, while if the out-put assumes discrete values then the problem is calledclassification. In the following we briefly present a few classification techniques.
• Naive Bayes Classifiers are based on Baye’s Theorem that assume independence among features given a class [15]. These has been widely used for the Internet traffic classification: e.g., naive Bayesian classification of the Internet traffic [16].
• Decision Trees (DT) define a popularly used intuitive method that can be used for learning and predicting about target features both for quantitative target attributes as well as nominal target attributes. Although, DT do not always perform very
competitively, their main advantage is their intuitive interpretation which is crucial even network operators have to analyze and interpret the classification method and results.
• Support Vector Machines (SVM) is a widely used supervised learning technique that is remarkable for being practical and theoretically sound, simultaneously. The approach of SVM is rooted in the field of statistical learning theory, and is systematic: e.g., training a SVM has a unique solution (since it involves optimization of a concave function).
Unsupervised learning techniques
The basic method in unsupervised learning isclustering. In clustering, the learning task is to categorize, without requiring a labeled training set, examples into ‘clusters’ on the basis of perceived similarity. This clustering is used to find the groups of inputs which have similarity in their characteristics. Intuitively, clustering is akin to unsupervised classifi-cation: while classification in supervised learning assumed the availability of a correctly labeled training set, the unsupervised task of clustering seeks to identify the structure of input data directly.
Reinforcement learning
Aliet al. Big Data Analytics (2016) 1:2 Page 5 of 24
eventual goal of a learner is to discover such an optimal mapping (or policy), from its actions to the rewards/punishments, so that the average long-term reward is maximized.
Deep learning
Deep learning (DL) is an ML technique that comprises deep and complex architectures [17, 18]. These architectures consist of multiple processing layers, each capable of gener-ating non-linear response corresponding to the data input. These layers consist of various small processers running in parallel to process the data provided. These processors are calledneurons. DL has proved to be efficient in pattern recognition, image and natural language processing [19]. DL finds its applications in very broad spectrum of applications ranging from healthcare to the fashion industry [20], with many key technology giants like Google, IBM and Facebook deploying DL techniques to create intelligent products.
Association rule learning
It is a method for discovering interesting relations between variables in large databases. In this, we seek to learn aboutassociationsbetween the features present in examples. Unlike classification (supervised learning), which strictly and discretely tells the class of an example, relations or associations among various variables in an example database are considered in association rule learning. We take an example case mentioned in [21] where a weather dataset is considered. The usual classification problem would be to tell whether, based on the values of given weather features or attributes (like temperature, outlook and wind conditions) in the dataset, a game would be played or not. If, however, we consider association learning perspective then (instead of always telling about the status of the game) different rules among different features or variables can also be considered. As a example a rule can be established that if the outlook is sunny and the game is being played then the day is going to be non windy. This type of learning technique can be particularly important for farmers in planning their activities for the best possible crop productions.
Numeric prediction
Innumeric prediction, we are not interested in predicting the discrete class (or category) to which the example belongs, but the numeric quantity associated with it. As an example consider, once again, the weather dataset mentioned to explain the association learning. Now consider the classification problem where instead of predicting whether (based on the given features) a game will be played or not a numeric quantity, e.g., how long (in minutes) a game is likely to be played, is predicted as an output [21]. The same scenario, again, can be of importance to a farmer where a numeric quantity such as time, how long, or how much rain will fall on a particular day can be predicted.
Data mining, knowledge discovery, and data science
Aliet al. Big Data Analytics (2016) 1:2 Page 6 of 24
mining and ML techniques, is calledknowledge discovery, sometimes collectively called KDD (knowledge discovery in databases). This knowledge can be in the form of brief and concise visual reports, a predicted value or a model of a larger data generating system [22]. Data science is an inderdisciplinary field in which different KDD techniques and processes are studied. Next, we briefly describe the trend of non-relational databases to store unstructured data followed by an introduction to predictive analytics that helps in knowledge discovery from the huge volumes of structured/unstructured data.
New trend in database technology: NoSQL
With the advent of big data and Web 2.0 we now have a huge amount of unstructured data such as word documents, email, blog posts, social- and multimedia data. This unstruc-tured data is different from the strucunstruc-tured data in that it can not be stored in an organized fashion in the conventional relational databases. In order to store and access unstruc-tured data, a different approach and techniques are required. NoSQL (or non-relational) databases have been developed for the same purpose [23]. Companies like Amazon (Dynamo [24]) and Google (Bigtable [25]) adopt this approach for storing and accessing their data. The main advantage, besides storing unstructured data, is that these NoSQL databases are distributed and hence easily scalable, fast and flexible (as compared to their relationalcounterpart). One of the concerns in using NoSQL datases, though, is that they usually do not inherently support the ACID (atomicity, consistency, integrity and dura-bility) set, as supported by the relational databases. One has to manually program these functionality into one’s NoSQL database.
Predictive analytics
Predictive analytics refers to a technology that aims to provide a competitive advantage by predicting some future occurrences or behavior (using data mining and ML techniques) based on past experience (in the form of collected data). Predictive analytics encom-passes data science, machine learning, predictive and statistical modeling and outputs empirical predictions based on given input empirical data [26]. The underlying premise is that future can be predicted on the basis of the past experience. Although, this premise matches our every day intuition, it is problematic philosophically due to the problem of inductionwhich asks the question: ‘can the future be predicted on the basis of the past?’. Notwithstanding the objections, it has been borne out in practice that although we can not deterministically tell the future, in many cases, we can improve our deci-sion making by probabilistically reasoning about future predicted outcomes—though care must be taken to also consider the proverbial ‘black swan’ that may appear unexpectedly to ambush our predictions. Predictive analytics finds its application in various humani-tarian development fields ranging from healthcare to education. As we advance through the text we discuss the applications of predictive analytics in more detail in the upcoming sections.
Crowdsourcing and big data
Aliet al. Big Data Analytics (2016) 1:2 Page 7 of 24
This data can then be harmonized and analyzed in mapping disaster struck regions and to further enable the commencement of search operations. This technique helped dur-ing the 2010 Haiti earthquake [28]. Crowdsourcdur-ing, based on social media, is discussed in [29] in terms of the opportunities that it provides for disaster relief and the challenges that are being faced during this process.
Internet of things
Internet of things (IoT) is a new trendy field fueled by the hype in big data, emergence of network science [30], proliferation of digital communication devices and ubiquitous Internet access to common population. A technical report by McKinsey Global Institute [2], presents the potential of IoT in terms of economic value. According to the study conducted in [2], if all the challenges are overcome, the IoT has a potential to create 3–11$ trillion USD worth of economic value. In IoT, different sensors and actuators are connected via a network to various computing systems providing data for actionable knowledge. In this way IoT, big data and network science are all related.Interoperability, harmony of data from one system with another, is a potential challenge in the way of IoT expansion. IoT finds its application in healthcare monitoring systems. Data from wear-able body sensory devices and hospital health care databases, if made interoperwear-able, could help doctors to make more efficient decisions in diagnosing and monitoring chronic dis-eases. Similarly, with the help of ML techniques and predictive analytics, data that is fed in real-time to computing systems by sensors and actuators can be utilized to revolution-ize the maintenance tasks in industries with a significant reduction in the breakdowns of parts and system downtimes.
Big data for development: development areas
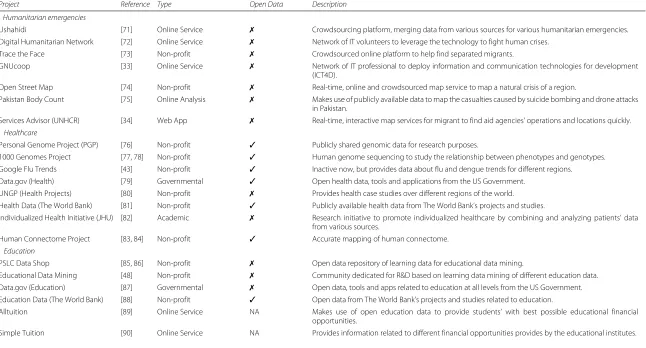
In this section, we will highlight some of the major development areas in which BD4D is applicable. We will first explore the role of BD4D in times of natural disasters and political crises. Besides these humanitarian emergencies, we study how BD4D can be used in the fields of agriculture, healthcare, education and in the alleviation of poverty and hunger. To accompany the information contained in this section, we have also presented a tabulated summary of projects pertaining to these different development areas in Table 1.
Humanitarian emergencies
In this section, we will present two case studies related to natural disasters and politi-cal crises through which we will highlight the important role that can be played by big data. Different issues concerning the acquisition, storage and sharing of data under these emergencies are also considered.
Natural disasters
Ali
et
al.
B
ig
Data
Analytics
(2016) 1:2
Page
8
o
f
2
4
Table 1Big data projects for different development areas and tools for big data analytics
Project Reference Type Open Data Description
Humanitarian emergencies
Ushahidi [71] Online Service ✗ Crowdsourcing platform, merging data from various sources for various humanitarian emergencies. Digital Humanitarian Network [72] Online Service ✗ Network of IT volunteers to leverage the technology to fight human crises.
Trace the Face [73] Non-profit ✗ Crowdsourced online platform to help find separated migrants.
GNUcoop [33] Online Service ✗ Network of IT professional to deploy information and communication technologies for development (ICT4D).
Open Street Map [74] Non-profit ✗ Real-time, online and crowdsourced map service to map a natural crisis of a region.
Pakistan Body Count [75] Online Analysis ✗ Makes use of publicly available data to map the casualties caused by suicide bombing and drone attacks in Pakistan.
Services Advisor (UNHCR) [34] Web App ✗ Real-time, interactive map services for migrant to find aid agencies’ operations and locations quickly.
Healthcare
Personal Genome Project (PGP) [76] Non-profit ✓ Publicly shared genomic data for research purposes.
1000 Genomes Project [77, 78] Non-profit ✓ Human genome sequencing to study the relationship between phenotypes and genotypes. Google Flu Trends [43] Non-profit ✓ Inactive now, but provides data about flu and dengue trends for different regions. Data.gov (Health) [79] Governmental ✓ Open health data, tools and applications from the US Government.
UNGP (Health Projects) [80] Non-profit ✗ Provides health case studies over different regions of the world. Health Data (The World Bank) [81] Non-profit ✓ Publicly available health data from The World Bank’s projects and studies.
Individualized Health Initiative (JHU) [82] Academic ✗ Research initiative to promote individualized healthcare by combining and analyzing patients’ data from various sources.
Human Connectome Project [83, 84] Non-profit ✓ Accurate mapping of human connectome.
Education
PSLC Data Shop [85, 86] Non-profit ✗ Open data repository of learning data for educational data mining.
Educational Data Mining [48] Non-profit ✗ Community dedicated for R&D based on learning data mining of different education data. Data.gov (Education) [87] Governmental ✗ Open data, tools and apps related to education at all levels from the US Government. Education Data (The World Bank) [88] Non-profit ✓ Open data from The World Bank’s projects and studies related to education.
Alltuition [89] Online Service NA Makes use of open education data to provide students’ with best possible educational financial opportunities.
Ali
et
al.
B
ig
Data
Analytics
(2016) 1:2
Page
9
o
f
2
4
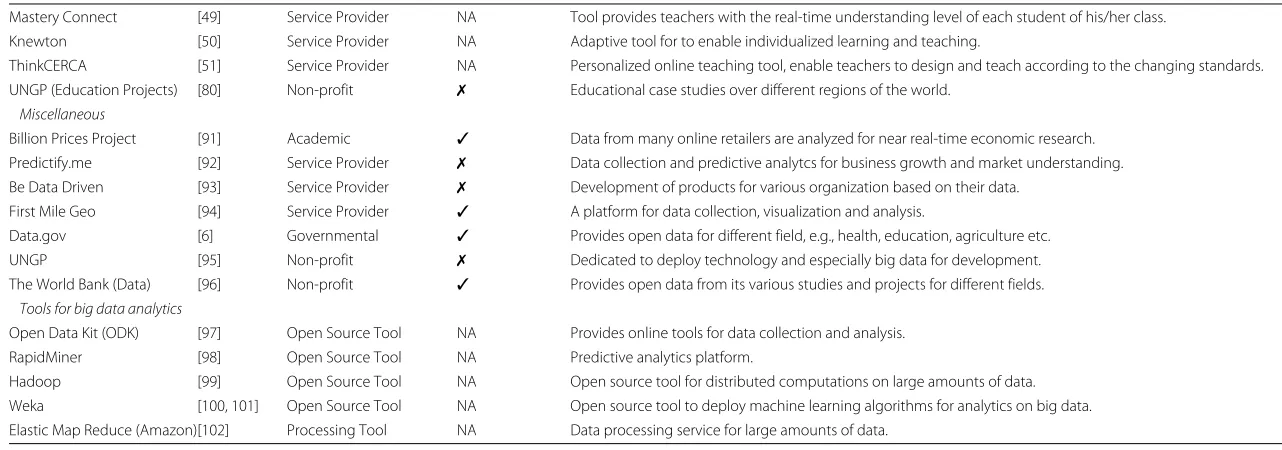
Table 1Big data projects for different development areas and tools for big data analytics(Continued)
Mastery Connect [49] Service Provider NA Tool provides teachers with the real-time understanding level of each student of his/her class. Knewton [50] Service Provider NA Adaptive tool for to enable individualized learning and teaching.
ThinkCERCA [51] Service Provider NA Personalized online teaching tool, enable teachers to design and teach according to the changing standards. UNGP (Education Projects) [80] Non-profit ✗ Educational case studies over different regions of the world.
Miscellaneous
Billion Prices Project [91] Academic ✓ Data from many online retailers are analyzed for near real-time economic research. Predictify.me [92] Service Provider ✗ Data collection and predictive analytcs for business growth and market understanding. Be Data Driven [93] Service Provider ✗ Development of products for various organization based on their data.
First Mile Geo [94] Service Provider ✓ A platform for data collection, visualization and analysis.
Data.gov [6] Governmental ✓ Provides open data for different field, e.g., health, education, agriculture etc. UNGP [95] Non-profit ✗ Dedicated to deploy technology and especially big data for development. The World Bank (Data) [96] Non-profit ✓ Provides open data from its various studies and projects for different fields.
Tools for big data analytics
Open Data Kit (ODK) [97] Open Source Tool NA Provides online tools for data collection and analysis. RapidMiner [98] Open Source Tool NA Predictive analytics platform.
Aliet al. Big Data Analytics (2016) 1:2 Page 10 of 24
of this community thedigital humanitarians. This book introduces the concept of big crisisdata. In its very nature it is not different from the usual big data except that it is created especially in times of crisis and disaster. By employing analytical techniques with the help of ML tools and methods, useful and actionable information can be extracted from this data. The author also outlines various potential challenges and harms that lurk behind the usage of this big crisis data. The most important among these is the credibility of data. With the ubiquitous online connectivity and proliferation of digital communi-cation devices, a fake dataset or trend can be easily generated. The author talks about efficient AI and ML techniques to verify these data.
Migrant crisis
As we write this paper, the ongoing political unrest in Syria, which started in 2011, wors-ens day after day. This situation has displaced a large number of people internally and a staggering number outside the country. The fleeing of people from the troubled areas, leaving their own homes and finding shelter elsewhere, has resulted in mass movement of population—the magnitude of which has not been observed since the end of World War II. Syria’s immediate neighbors—in particular, Lebanon and Jordan—and many countries in Europe are seeing a huge influx of people in search of shelter, better and less troubled lives. In this type of scenario, it is a challenge for the humanitarian organizations to oper-ate efficiently especially in the troubled and war-torn areas. Two major challenges are faced by the helping organizations: (i) ensuring that the right regions get the right type of assistance in time; and (ii) ensuring the coordination within and among organizations during such times. This is important to avoid chaos and mismanagement. In both of these cases, data has a vital role to play.
The United Nations Refugee Agency (UNHCR) in collaboration with non-profit vol-unteer organizations [31–33], formed by people with IT skills to deploy technology for humanitarian purposes, developed an online map, called Services Advisor [34], fueled by the organizational data from UNHCR’sActivityInfo[35]. This map is interactive and can be accessed from a variety of desktop and mobile phone browsers. A user can zoom in to his/ her nearest location and get to know about the number of different organiza-tions, their function, operating times and capacity. In this fashion accurate and real-time information is made available to the refugees so that they can get help quickly and avoid long queues and other similar inconveniences. Through ActivityInfo portal, different aid agencies can crowdsource their information, related to location, services and number of people they are serving, so that coordination can be established among all the working agencies in troubled areas.
Aliet al. Big Data Analytics (2016) 1:2 Page 11 of 24
research on development of models based on data corresponding to various social and political indicators. As an illustrative example, this sort of predictive analytics when done right could have been afforded the ability to develop models that would have predicted the ongoing Syrian ‘migrant crisis’ [36].
Hunger, food and agriculture
Kshetri in [37] surveys recent research literature and official reports/documents to study the factors that help enable the use of big data techniques for development purposes along with the inhibitors in the way of this process. The importance of modern data sources, e.g., social media and cell phone data, is highlighted. In terms of skills, monetary capacity toafforddata, and sometimes cultural and industrial norms for utilizing modern technol-ogy result in nonuniform diffusion of technological innovations and trends throughout the world. This paper presents a case study for agriculture to discuss the opportunities and challenges for deploying big data techniques for the development of farmers.
In the developing countries, the farmers are often less informed about the soil con-ditions, extreme changes in the weather patterns, plantation, topography and access to markets [12, 37, 38]. Data collected from different sensors, satellite imagery and field experts can be analysed and predictive models can be formed. Based on these models the most relevant information can then be sent using cellular network to individual farmers.
Healthcare
Big data analytics in healthcare is bringing a huge cultural change in the way conventional medical diagnosis and treatment operates. Big data can revolutionalize medical diagnosis by integrating data gathered from various medical records of a patient, as well as real-time wearable sensors, to analyze and diagnose the patient’s current health status and provide an early warning sign if the health of a patient is on a dangerous track. Doing this helps in taking preventing measurements to diagnose and treat a potentially harmful disease during early stages. In terms of making treatment more efficient and convenient, it is possible for a person having a smart phone to access medical service providers via a healthcare app [39] to obtain quick and more personalized response from the convenience of one’s home.
Aliet al. Big Data Analytics (2016) 1:2 Page 12 of 24
about the current status of any country’s health and early warning signs of imminent viral epidemic outbreaks. This can be only the first step in this process; the next step is to pro-vide relevant medical assistance, immunization vaccines and related preventive measures to a specific region of the world.
In existing work, practical systems have been built that have used big data technology for building an early warning system for a potential epidemic breakout. As an example, Pervaiz et al. presented a study of comparative analysis of the performance of different algorithms that are deployed on Google Flu Trends [43] to detect an early warning sign of a potential epidemic breakout [44]. A number of other health-related BD4D projects are summarized in Table 1. Among these projects, the ones related to human genome are very important. Sequencing of a human genome creates massive amounts of data that is crucial in understanding the origin and dynamics of various diseases.
Education
The field of education is making a transition to digital era with the use of physical text-books waning and digital versions of study material gaining more popularity. Education is one of the fields that has greatly benefited from the big data analytics [45]. The con-ventional pedagogical practices, students’ learning and study habits, and the way whole educational system is being designed and run are seeing revolutionary changes.
In particular, the practice on online learning and blended learning is gaining popularity. In blended learning, online teaching, learning and assessments are combined with the conventional pedagogical approach.
There are two important interrelated big data related developments in education: learning analytics and educational data mining. Learning analytics (LA) is an emerg-ing cross-disciplinary field that combines data analytics and learnemerg-ing, thus bremerg-ingemerg-ing researchers together from various fields such as computer science, data science and social science [46]. In this field, research is carried out for various purposes that include, but are not limited to, predictive analysis, social network and sentiment analysis, personal-ized learning, and better curriculum designs.Educational data mining (EDM), like LA, is also an emerging and related field. In EDM, data mining and ML techniques are applied to the data representing the student’s interaction with the digital and online educational system—which can be easily stored in massive open online courses (MOOCs) and online tests—to help the students better learn. With the proliferation of digital devices, and the increased consumption of the Internet and social media sites, every Internet user leaves behind adata trail[47], which can be exploited to learn and understand a person’s behavior. In the context of online learning, recording and mining the student’s interac-tion with the learning system has the potential of revealing interesting insights that can be exploited to optimize the student’s learning experience. Many vendors are produc-ing data driven products for educators with user-friendly interfaces to bridge research outputs and real practices [46]. There is a dedicated community namedInternational Educational Data Mining Society[48], whose sole purpose is to provide platform for peo-ple and researchers to publish and develop effective techniques and solutions based on data mining for effective learning and teaching.
Aliet al. Big Data Analytics (2016) 1:2 Page 13 of 24
is collected. Different aspects are analyzed during and at the end of such assessment processes. Data, such as related to students’ answers to different questions, how long a student took to answer a specific question, how often a student has to click other links to understand the question statements can be collected and a finalized, mostly visual, analyt-ical report is presented to the teacher. This renders a teacher to quickly pinpoint students who are struggling with specific topics or questions. In this way anindividualized treat-mentcan be given to such students to address their particular problems so that they can be brought up to the mark.
In a similar manner data from different teachers can be analyzed together. This can give insights in terms of which teacher has the greatest mental harmony with what kind of students. As an example, a teacher might be struggling with shy students while the same type of students show better results with a different teacher. In this way an early and informedinterventioncan be performed so that such cases can be resolved in time. Three of such projects from different vendors can be seen in references [49, 50] and [51].
Big data analytics for development Mobile analytics
Aliet al. Big Data Analytics (2016) 1:2 Page 14 of 24
this analysis can be extended by taking consecutive slices of time. This shows the spread, pattern, and decay of the anomalous behavior in time. Overall, this kind of analysis pro-vides a very detailed and accurate picture of emergency situations, which can be in terms of political turmoil or spread of an epidemic. Analysis of individual call activity pattern is also studied in the same work. This analysis provides information about the mobility of people, which would further help in planning effective transportation strategies.
Another study that combines network science and big data is conducted in [55], for big data driven social-network analysis. In this study, a huge dataset of mobile phone inter-actions between individuals of a certain region is utilized to construct a social network to study the relation between the topology of this network and thetie strengthsbetween users that comprise this social network. Tie strengths are the measure of link weights between individual users. A (non-directional) link exists between two users if there is, at least, one reciprocated call between them. Call duration determines the numerical value of the weights of these links. As a result, the user call data helps to reproduce the structure of a social network where users are nodes and they are connected with different tie strengths. An interesting result of this study is that the removal of strong ties has minimal effect on the integrity of the structure of this social network. However, if the weak links are removed, the structure of the social network collapses. Another interesting finding is that ties with intermediate strengths are basically more useful in spreading information in a social network as opposed to both the strong and weak ties. These insights provide wonderful opportunities in understanding the dynamics of a social network, and to plan effective policies for the population of these networks. Medical awareness campaigns, as an example, can be specially designed so that the links with inter-mediate tie strengths are targeted to spread the information effectively throughout the network.
Mobile analytics can be used for a number of developmental purposes such as urban planning, transport engineering, analysis of social dynamics of a group of people, and even epidemic control. We will briefly consider a few representative example use cases: (i) In [56], the authors have used the CDR information to develop aCenCelltool [56] to aid governments and policy makers in computing reasonably accurate and afford-able census maps by approximating census information using anonymized CDRs using supervised and unsupervised classification techniques; (ii) In [57], the authors have used mobile analytics on CDR to model commuting patterns to help characterize the mobility of the human population and thereby generate commuting matrices; (iii) Finally, in [58], the authors have proposedAlertImpactas a method to analyze the evolution of an epi-demic under various policies by performing mobile analytics on anonymyized CDRs. By using AlertImpact to analyze anonymized CDRs collected during the H1N1 outbreak in Mexico, the authors were able to document 10 % reduction in peak number of individual virus infections due to the government mandates.
Living analytics
Aliet al. Big Data Analytics (2016) 1:2 Page 15 of 24
computational social scienceis inherently based around using the advances in storage and computing capabilities to process readily available big data for advancing our under-standing of social science [59]. Conventional social science techniques, which are mainly based on questionnaires and surveys, suffer from bias, incompleteness or sometimes inac-curate and scarce information. Modern techniques where data from devices, specially cell-phones and other digital communication devices, are collected and different models are formed to study the structure and dynamics of a social network either on individual or collective levels are in contrast with the conventional methods. Intelligent techniques are being devised and deployed to mine useful data from the massive datasets gleaned from cell-phones and other digital devices.
Computational social science represents a paradigm shift from traditional social science in many profound ways: instead of manually gathering data using one-time personalized surveys, the availability of digital data (such as GPS location, email logs) can provide more dynamic visibility into human behavior both at the level of an individual and at the level of society.
The important thing, as mentioned in [59], is to address all the barriers in the way of the development of computational social science. This work [59] describes two types of challenges: One is the approach and the other one is related to infrastructure. The research, or academic, approach in computational social science should be to access and gather data through secure, channelized mechanisms. There should be central-ized data storage facilities under the supervision of technological savvy personnel that understand the threat of security breach in the data. This is opposed to the approach where data is distributed under people with varying technological skills and security protocols.
Mining of data to gain insights into the social patterns of an individual or a group of individuals falls into the realm ofreality mining. A reality mining related research from MIT researchers was published in 2006 [60]. In this study, 100 cell-phones were dis-tributed among students and faculty members. Data related to proximity, location and device usage was collected from these devices over a period of nine months. These were collected mainly from the cell tower logging, providing user location, and Bluetooth, providing information related to proximity. Techniques from information theory were deployed to model individual behaviors, like device usage patterns and mobility. Simi-larly collective models, representing friendship, acquaintance and ethnographic networks were developed based on the information provided by this data. This work also studies the behavioral patterns on an organizational level. These insights are important in predicting possible future behavior, both on individual and collective levels. This helps in developing efficient planning in times of crisis.
Aliet al. Big Data Analytics (2016) 1:2 Page 16 of 24
humans interact with each other. This interaction can be in terms of voice input, facial expressions, or even physiological condition of a human body, where sensing is often done without a subject being consciously aware of it. Different questions are raised in this article, and related literature pool has been reviewed to address these. These ques-tions are related to what data is being collected by which means andwhy is it being collected andhowa proper response can be generated based on the information collected by addressing all of these questions? Addressing these questions provides us with the information about in what format the data is collected? what computing or sensory inter-face was used? In which context (time and location) the data was collected? And based on this information what is the most appropriate response to address the user needs or queries.
Visual analytics
Visual analytics is an interesting branch of big data exploration in which the aim is to support the science of analytical reasoning through interactive visual interfaces. Through information visualization, large amounts of quantitative data can be shown in a limited space [62]. As mentioned in [63], in visual analytics there might not be much a priori infor-mation known about the data or even about the data exploration goals. In inforinfor-mation (or data) exploration the goals are steered and fine-tuned during the process of explo-ration by human interaction. Visual analytics has the power to quickly convey the essence of a massive dataset to a user as contrast to automatic data mining and machine learn-ing tools, which require more technological soundness and knowledge. As an example, as it quite often happens these days, the viral trends on any one of the social media sites, e.g. Twitter or Facebook, can provide one with a good idea of the trend if this outbreak is shown in an animated time-lapsed video. One can track the origin and hubs respon-sible for the spread of the virus. Through these principles, combined with the concepts from the network science, the outbreak of biological viruses can also be analyzed or even prevented beforehand.
In this section, we will focus on four approaches to visualization and visual analyt-ics: data maps, time-series, space-time narratives, and relational graphics. We briefly describe these approaches, as discussed by Tufte in [62], and link them to humanitarian development:
Data maps
Aliet al. Big Data Analytics (2016) 1:2 Page 17 of 24
Time series
In this type of representation, the growth, development, decay or the general trend of a variable is presented against the time lapse. Time can be in various resolutions, ranging from seconds to centuries. The rise and fall of stock market over a period of time, temperature variation of a specific region and, as discussed in [60], a user’s device usage over different times of a day are all examples of time series. Time series are important to analyze trends that arise during a specified period (e.g., dengue mosquitoes that mostly bite during dawn and dusk and during specific months of a year). This type of information provides disaster management authorities a prior information to take preventive steps to avoid large number of casualties during crisis times.
Space-time narrative
In the time-series, as discussed above, if the variable of spaceis also introduced into the analysis then, as a result, we have a multivariate data for visualization. Tufte in [60] mentions that to attain excellence in presenting the information in graphics, one almost always has to deal with a multivariate information. The visualization enables one to easily understand the substance provided in the graphic while being less aware of the complex multivariate nature of the underlying data. An example of this narrative provided in [60] would adequately describe the importance of space-time visualization in development process. The example is related to environmental pollution where the concentration of different pollutants are observed at different times of a day over dif-ferent regions of an area. We end up with difdif-ferent time series each corresponding to a specific pollutant. Slices taken from any one of these time series are basically data maps, similar to the ones discussed before. In short, a slice taken from a time series corresponding to a pollutant reveals the levels of this pollutant over different regions of an area at the specific time the slice is taken from. As a result we have the infor-mation about at what times a pollutant peaks in its concentration and at which place. This helps us to analyze the dynamics of a particular region at a specific time. As an example carbon mono-oxide (variable one: Pollutant) level peaks during traffic rush hours (variable two: Time) specially at the intersection of large roads (variable three: Space).
Relational graphics
Ali
et
al.
B
ig
Data
Analytics
(2016) 1:2
Page
18
of
24
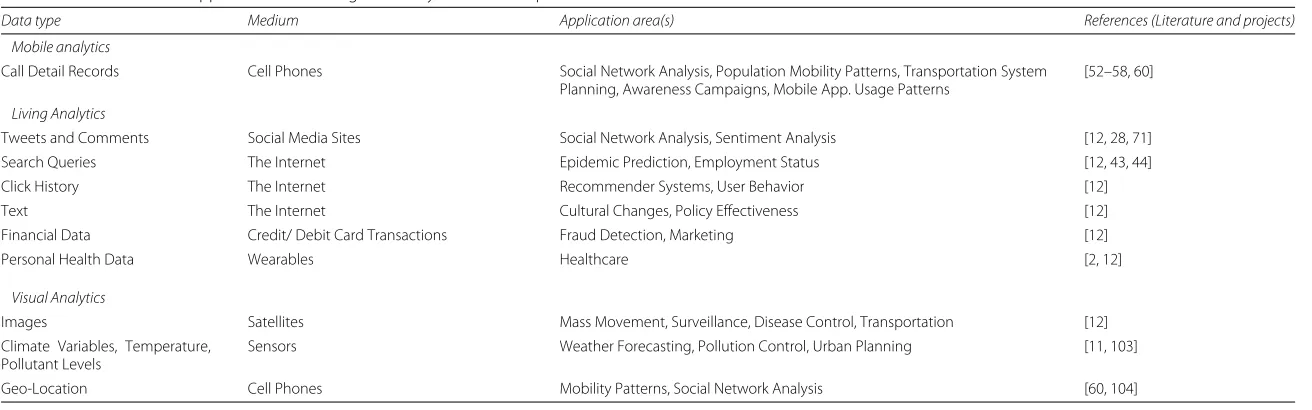
Table 2Data sources and application areas of big data analytics for development
Data type Medium Application area(s) References (Literature and projects)
Mobile analytics
Call Detail Records Cell Phones Social Network Analysis, Population Mobility Patterns, Transportation System Planning, Awareness Campaigns, Mobile App. Usage Patterns
[52–58, 60]
Living Analytics
Tweets and Comments Social Media Sites Social Network Analysis, Sentiment Analysis [12, 28, 71] Search Queries The Internet Epidemic Prediction, Employment Status [12, 43, 44] Click History The Internet Recommender Systems, User Behavior [12] Text The Internet Cultural Changes, Policy Effectiveness [12] Financial Data Credit/ Debit Card Transactions Fraud Detection, Marketing [12]
Personal Health Data Wearables Healthcare [2, 12]
Visual Analytics
Images Satellites Mass Movement, Surveillance, Disease Control, Transportation [12] Climate Variables, Temperature,
Pollutant Levels
Sensors Weather Forecasting, Pollution Control, Urban Planning [11, 103]
Aliet al. Big Data Analytics (2016) 1:2 Page 19 of 24
Challenges, open issues and future work
In today’s age it is quite likely that big data will gain substantial potential and importance in order to shift the paradigm of the conventional humanitarian development process in almost every walk of life. It is, however, not a panacea to all the problems in the modern day world. Just like any other innovation, the wide scale adoption of big data is hindered by many potential challenges. In this section we discuss some of these challenges from two perspectives: technical and ethical. Correspondingly, we describe open issues and future work, which is required to address these challenges.
Technical challenges
There are various technical challenges involved in implementing BD4D. As an exam-ple, with the daily production of vast amounts of data, are the processing and storing capabilities scaling proportionally? Below we present and describe a few of the technical challenges:
• Crowdsourcing: We observed the importance of crowdsourcing when we discussed migrant crisis. Social media sites are a rich source of crowdsourced data and many aid agencies rely on the information gathered from these sites. However, there is not an established framework where the agencies can collaborate, and ideally
complement each other’s efforts and findings. This produces a problem ofdouble response. Where two aid agency take same action on the same problem when, if there were coordination between these two, one of the agencies could be operating on a different problem or taking a complementary action for the same problem.
• Bias and Polarization: The personalized content predicted by algorithms based on the past behavior of a user can create polarization. This means that two different users could be getting entirely different search results for a same thing. However, modern deep-learning techniques, which do not entirely rely on the past data, and context aware computing and algorithms can address these issues. As an example Facebook has a dedicated research group by the name ofFacebook’s AI Group. One of the tasks that this group aims to complete is to find meaning in the user posts that is not entirely based on keyword search [64]. A similar venture is by IBM. Cognitive computing [65], which is based on deep-learning and brain inspired neural algorithm approaches, will help the development of Watson, a context aware AI based
computing system [66].
• Data Supply Chain: With all the benefits, policy analysis by utilizing big data is a precarious task. Many potential challenges and perils entail this process [67]. Privacy is a major, and largely debated, concern in gathering data from users. During the data gathering process (thebig-data supply chain) the context and semantics of the data can be altered resulting in faulty and sometimes controversial policies. Present day data sources are also prone to temporal and spatial restrains, due to disparity in worldwide technology proliferation, resulting in a statistical bias, which in turn can result in inefficient policies.
Aliet al. Big Data Analytics (2016) 1:2 Page 20 of 24
with care so that the students who use the Internet less, or differently, as compared to other students should not be penalized in the data analysis [68].
• Spatial Problem: Many users update their status with the information related to a crisis sitting, all together, at a different geographical site. This is a challenge in pin pointing an actual place of crisis for which the information was provided at the first place. So, the data gathered from the actual ground based surveys and aerial imagery should be corroborated with these for the effective actions to fight a crisis situation.
• Vulnerability of Connectivity: Although, scientists are working on trust management systems for the verification of the information gathered for an appropriate action: Fraudulent information and entities can still infiltrate the information network. This information can then be treated like normal data and has the potential to diffuse and infect other connected entities of the information network. This vulnerability is primarily caused by the connected nature of information producing and consuming entities, thisvulnerability of connectivity and cacasding errors/failures are discussed by Barabasi in his book [30].
• Interoperability: Big data analytics often include collecting and then merging unstructured data of varying data types. As an example call detail records from cell phone companies, satellite imagery data and face-to-face survey data have to be corroborated together for the better and less-biased analysis. Merging and
harmonizing this data for analysis is a challenging task. For effective data analytics a system is needed that could make data streams of potentially different formats homogenous.
• Fragmentation: The challenge of fragmentation is one of the major impediment to large-scale deployment of big data analytics. As an example, a patient might be seeing different specialists for, seemingly, different medical reasons. These specialists, then further, can prescribe different types of clinical tests resulting in different kinds of results. If, however, some protocol or a system is developed to integrate these fragments together and run analysis on them collectively then a clear and big picture of a patient’s current health can be extracted. If the issue of fragmentation is resolved then this can not only speed up the diagnosis process but also has the ability to provide personalized treatment most suitable for the patient under consideration.
• Technology Scaling: In recent times, the technologies of cloud computing and software-defined networking (SDN) have proved very useful for efficiently
implementing big data solutions: going forward, more work is needed to ensure that the computing and networking facilities scale to the ever-increasing scale of data [69].
Ethical
Aliet al. Big Data Analytics (2016) 1:2 Page 21 of 24
• Privacy: This concern tops the list. As an example, with large amounts of data being collected about individuals, it is of utmost importance that such information should not be abused for any sort of personal or financial gains.
• Digital Divide: This divide [70] is simply the nonuniform diffusion of technological advancement and expertise through out the world. The result of this divide harm nations that lack the infrastructure, economic affordability anddata-savvy faculty. The digital divide, the well-known issue of privacy, and the control and monopoly of entities exploiting the data are among the important challenges that hinder the wide scale deployment of big data techniques for development.
• Open Data: There are also many possible issues with open data. For greater
transparency, it is desirable that government/development data is openly accessible. However, it is also important to think about who has the right to access, use, link, and repurpose open data (and how much flexibility is desirable, keeping in view various misuse and privacy issues). With the rising use of big data in humanitarian and development aid, governance efforts should focus on ensuring that sensitive information (such as the location of humanitarian actors and internally displaced persons (IDPs)) does not become open, since such data may maliciously be exploited by malevolent actors.
Finally, the evolution of data science, in itself is a challenge. This is because the field requires expertise and collaboration of people from various fields and disciplines. Inter-disciplinary efforts should be encouraged and financially incentivized so that big data can be analyzed with the right perspectives and ethics in place.
Conclusions
In this paper, we have reviewed the literature focused on using big data techniques for human development (BD4D). Our aim in this paper is to highlight to a broad audience the immense potential of BD4D in a variety of settings including humanitarian emergen-cies (including disaster response and migrant crisis), agriculture, poverty alleviation, food production, healthcare and education. We have highlighted the various challenges and pitfalls associated with BD4D. We envision that in the future BD4D will play a big role in human development and global prosperity, but to succeed with BD4D, it is imperative that researchers are able to tackle and solve the challenges identified.
Authors’ contributions
AA carried out most of the writing work. JQ supervised the whole work along with providing ideas related to the content and the overall structure of the paper. RR provided many useful resources and information related to big data processing and analytics along with pointing out a few of the challenges in the big data ecosystems such as the issue of
fragmentationin using big data in healthcare. AS and JC provided many useful insights and ideas related to the ethical use of data. AZ provided his detailed feedback on the paper’s manuscript along with information related to the ethical use of data in the ‘Ethical’ subsection. All authors read and approved the final manuscript.
Competing interests
The authors declare that they have no competing interests.
Author details
1Information Technology University (ITU)-Punjab, Lahore, Pakistan.2King Faisal University (KFU), Hofuf, Kingdom of Saudi
Arabia.3Computer Laboratory, University of Cambridge, Cambridge, UK.4University of Groningen, Groningen,
Netherlands.
Aliet al. Big Data Analytics (2016) 1:2 Page 22 of 24
References
1. Mayer-Schönberger V, Cukier K. Big Data: A Revolution that Will Transform How We Live, Work, and Think: Eamon Dolan/Houghton Mifflin Harcourt; 2013.
2. Manyika J, Chui M, Bisson P, Woetzel J, Dobbs R, Bughin J, Aharon D. The Internet of things: Mapping the value beyond the hype. Technical report, McKinsey Global Institute June 2015.
3. Siegel E. Predictive Analytics: The Power to Predict Who Will Click, Buy, Lie, Or Die: John Wiley & Sons; 2013. 4. Barroso LA, Clidaras J, Hölzle U. The datacenter as a computer: An introduction to the design of warehouse-scale
machines. Synth Lect Comput Arch. 2013;8(3):1–154.
5. Hilbert M. Big data for development: From information-to knowledge societies. 2013. Available at SSRN 2205145. 6. The home of the U.S. Government’s open data. http://www.data.gov/. [Online; accessed 01-October-2015]. 7. Hoffmann L. Data mining meets city hall. Commun ACM. 2012;55(6):19–21.
8. The home of the U.K. Government’s open data. https://www.data.gov.uk/. [Online; accessed 01-October-2015]. 9. Hartung C, Lerer A, Anokwa Y, Tseng C, Brunette W, Borriello G. Open data kit: tools to build information services
for developing regions. In: Proceedings of the 4th ACM/IEEE International Conference on Information and Communication Technologies and Development. ACM; 2010. p. 18.
10. Manyika J. Open Data: Unlocking Innovation and Performance with Liquid Information: McKinsey; 2013. 11. Centro de Operações Rio. http://centrodeoperacoes.rio/. [Online; accessed 05-October-2015]. 12. Big data in action for development. Technical report, The World Bank. 2014.
13. Pulse UG. Big data for development: Challenges & opportunities. Nueva York, mayo: Naciones Unidas; 2012. 14. Kirkpatrick R. Big data for development. Big Data. 2013;1(1):3–4.
15. Rish I. An empirical study of the naive bayes classifier. In: IJCAI 2001 Workshop on Empirical Methods in Artificial Intelligence, vol. 3. IBM New York; 2001. p. 41–6.
16. Moore AW, Zuev D. Internet traffic classification using bayesian analysis techniques. In: ACM SIGMETRICS Performance Evaluation Review, vol. 33. ACM; 2005. p. 50–60.
17. Schmidhuber J. Deep learning in neural networks: An overview. Neural Netw. 2015;61:85–117.
18. Bengio Y. Learning deep architectures for ai. Foundations and trends® in Machine Learning. 2009;2(1):1–127. 19. Collobert R, Weston J. A unified architecture for natural language processing: Deep neural networks with multitask
learning. In: Proceedings of the 25th International Conference on Machine Learning. ACM; 2008. p. 160–7. 20. Knight W. Deep Learning Catches On in New Industries, from Fashion to Finance. 2015. http://www.
technologyreview.com/news/537806/deep-learning-catches-on-in-new-industries-from-fashion-to-finance/. [Online; accessed 24-September-2015].
21. Witten IH, Frank E. Data Mining: Practical Machine Learning Tools and Techniques: Morgan Kaufmann; 2005. 22. Fayyad U, Piatetsky-Shapiro G, Smyth P. From data mining to knowledge discovery in databases. AI Mag. 1996;17(3):37. 23. Leavitt N. Will nosql databases live up to their promise?. Computer. 2010;43(2):12–4.
24. DeCandia G, Hastorun D, Jampani M, Kakulapati G, Lakshman A, Pilchin A, Sivasubramanian S, Vosshall P, Vogels W. Dynamo: amazon’s highly available key-value store. In: ACM SIGOPS Operating Systems Review. ACM; 2007. p. 205–20.
25. Chang F, Dean J, Ghemawat S, Hsieh WC, Wallach DA, Burrows M, Chandra T, Fikes A, Gruber RE. Bigtable: A distributed storage system for structured data. ACM Trans Comput Syst (TOCS). 2008;26(2):4.
26. Shmueli G, Koppius O. Predictive analytics in information systems research: Robert H. Smith School Research Paper No. RHS; 2010, pp. 06–138.
27. Howe J. CROWDSOURCING. 2006. http://www.crowdsourcing.com/. [Online; accessed 22-September-2015]. 28. Meier P. Digital humanitarians: how big data is changing the face of humanitarian response. CRC Press; 2015. 29. Gao H, Barbier G, Goolsby R. Harnessing the crowdsourcing power of social media for disaster relief. IEEE Intell Syst.
2011;26(3):10–14.
30. Barabási A-L. Network Science. Philosophical Transactions of the Royal Society of London A: Mathematical, Physical and Engineering Sciences. 2013;371(1987):20120375.
31. Silver J. Mapping connections for refugees and aid services. 2014. http://affinitybridge.com/blog/mapping-connections-refugees-and-aid-services. [Online; accessed 29-September-2015].
32. PeaceGeeks. http://peacegeeks.org/about. [Online; accessed 29-September-2015]. 33. GNUcoop. http://www.gnucoop.com/about/. [Online; accessed 29-September-2015].
34. Services Advisor. http://data.unhcr.org/jordan/services-advisor/. [Online; accessed 29-September-2015]. 35. ActivityInfo. https://www.activityinfo.org/. [Online; accessed 29-September-2015].
36. Novack R. We Should Have Seen This Refugee Crisis Coming. WIRED. 2015. http://www.wired.com/2015/09/able-predict-refugee-crisis/, [Online; accessed 30-September-2015].
37. Kshetri N. The emerging role of big data in key development issues: Opportunities, challenges, and concerns. Big Data & Society. 2014;1(2):2053951714564227.
38. Connected Farmer Alliance. http://www.technoserve.org/our-work/projects/connected-farmer-alliance. [Online; accessed 05-October-2015].
39. Press TA. ResearchKit: 5 Things to Know About Apple’s Medical Apps. 2015. http://www.nytimes.com/aponline/ 2015/03/11/technology/ap-us-tec-apple-researchkit.html. [Online; accessed 24-September-2015].
40. Elhauge E. The Fragmentation of US Health Care: Causes and Solutions: Oxford University Press; 2010. 41. Lohr S. Using Patient Data to Democratize Medical Discovery. 2015. http://bits.blogs.nytimes.com/2015/04/02/
using-patient-data-to-democratize-medical-discovery/?_r=1. [Online; accessed 24-September-2015].
42. Friedman C, Rubin J, Brown J, Buntin M, Corn M, Etheredge L, Gunter C, Musen M, Platt R, Stead W, et al. Toward a science of learning systems: a research agenda for the high-functioning learning health system. J Am Med Inform Assoc. 2014;22(2014).
43. Google Flu Trends. https://www.google.org/flutrends/about/. [Online; accessed 04-October-2015].
44. Pervaiz F, Pervaiz M, Rehman NA, Saif U. Flubreaks: early epidemic detection from google flu trends. J Med Internet Res. 2012;14(5):e125.
Aliet al. Big Data Analytics (2016) 1:2 Page 23 of 24
46. Siemens G. Learning analytics: envisioning a research discipline and a domain of practice. In: Proceedings of the 2nd International Conference on Learning Analytics and Knowledge. ACM; 2012. p. 4–8.
47. Rijmenam Markvan. Four Ways Big Data Will Revolutionize Education. https://datafloq.com/read/big-data-will-revolutionize-learning/206. [Online; accessed 01-October-2015].
48. International Educational Data Mining Society. http://www.educationaldatamining.org/. [Online; accessed 02-October-2015].
49. Mastery Connect. https://www.masteryconnect.com/. [Online; accessed 02-September-2015]. 50. Knewton. https://www.knewton.com/. [Online; accessed 02-September-2015].
51. ThinkCERCA. http://www.thinkcerca.com/. [Online; accessed 02-September-2015].
52. Laurila JK, Gatica-Perez D, Aad I, Blom J, Bornet O, Do T-M-T, Dousse O, Eberle J, Miettinen M. The mobile data challenge: Big data for mobile computing research. In: Proceedings of the Workshop on the Nokia Mobile Data Challenge, in Conjunction with the 10th International Conference on Pervasive Computing; 2012. p. 1–8. 53. Candia J, González MC, Wang P, Schoenharl T, Madey G, Barabási AL. Uncovering individual and collective human
dynamics from mobile phone records. J Phys A: Math Theor. 2008;41(22):224015. 54. Stauffer D, Aharony A. Introduction to Percolation Theory: CRC press; 1994.
55. Onnela JP, Saramäki J, Hyvönen J, Szabó G, Lazer D, Kaski K, Kertész J, Barabási AL. Structure and tie strengths in mobile communication networks. Proc Nat Acad Sci. 2007;104(18):7332–6.
56. Frias-Martinez V, Soto V, Virseda J, Frias-Martinez E. Computing cost-effective census maps from cell phone traces. In: Workshop on Pervasive Urban Applications; 2012.
57. Frias-Martinez V, Soguero C, Frias-Martinez E. Estimation of urban commuting patterns using cellphone network data. In: Proceedings of the ACM SIGKDD International Workshop on Urban Computing. ACM; 2012. p. 9–16. 58. Frias-Martinez E, Williamson G, Frias-Martinez V. An agent-based model of epidemic spread using human mobility
and social network information. In: Privacy, Security, Risk and Trust (PASSAT) and 2011 IEEE Third Inernational Conference on Social Computing (SocialCom), 2011 IEEE Third International Conference On. IEEE; 2011. p. 57–64. 59. Lazer D, Pentland AS, Adamic L, Aral S, Barabasi AL, Brewer D, Christakis N, Contractor N, Fowler J, Gutmann M, et
al. Life in the network: the coming age of computational social science. Science (New York, NY). 2009;323(5915):721. 60. Eagle N, Pentland A. Reality mining: sensing complex social systems. Pers Ubiquitous Comput. 2006;10(4):255–68. 61. Pantic M, Pentland A, Nijholt A, Huang TS. Human computing and machine understanding of human behavior: a
survey. In: Artifical Intelligence for Human Computing. Springer; 2007. p. 47–71.
62. Tufte ER, Graves-Morris P, Vol. 2. The Visual Display of Quantitative Information. CT: Graphics press Cheshire; 1983. 63. Keim DA. Information visualization and visual data mining. Visual Comput Graph IEEE Trans. 2002;8(1):1–8. 64. Simonite T. Facebook Launches Advanced AI Effort to Find Meaning in Your Posts. 2013. http://www.
technologyreview.com/news/519411/facebook-launches-advanced-ai-effort-to-find-meaning-in-your-posts/. [Online; accessed 08-September-2015].
65. Modha DS, Ananthanarayanan R, Esser SK, Ndirango A, Sherbondy AJ, Singh R. Cognitive computing. Commun ACM. 2011;54(8):62–71.
66. IBM Watson. http://www.ibm.com/smarterplanet/us/en/ibmwatson/. [Online; accessed 17-September-2015]. 67. Schintler LA, Kulkarni R. Big data for policy analysis: The good, the bad, and the ugly. Rev Policy Res. 2014;31(4):343–8. 68. Eynon R. The rise of big data: what does it mean for education, technology, and media research? Learn Media
Technol. 2013;38(3):237–40.
69. Qadir J, Ahad N, Mushtaq E, Bilal M. SDNs, Clouds, and Big Data: New Opportunities. In: Frontiers of Information Technology (FIT), 2014 12th International Conference On. IEEE; 2014. p. 28–33.
70. Hilbert M. The end justifies the definition: The manifold outlooks on the digital divide and their practical usefulness for policy-making. Telecommun Policy. 2011;35(8):715–36.
71. Ushahidi. http://www.ushahidi.com/. [Online; accessed 04-October-2015].
72. Digital Humanitarian Network. http://digitalhumanitarians.com/. [Online; accessed 04-October-2015]. 73. Trace the Face. http://familylinks.icrc.org/europe/en/Pages/Home.aspx. [Online; accessed 29-September-2015]. 74. Humanitarian Open Street Map Team. http://hotosm.org/projects/ongoing. [Online; accessed 04-October-2015]. 75. Pakistan Body Count. http://pakistanbodycount.org/index.html. [Online; accessed 04-October-2015].
76. Personal Genome Project. http://www.personalgenomes.org/. [Online; accessed 04-October-2015]. 77. 1000 Genomes. http://www.1000genomes.org/. [Online; accessed 04-October-2015].
78. Consortium GP, et al. A map of human genome variation from population-scale sequencing. Nature. 2010;467(7319):1061–73.
79. Education - Data.gov. http://www.data.gov/health/. [Online; accessed 04-October-2015].
80. United Nations Global Pulse (Projects). http://www.unglobalpulse.org/projects. [Online; accessed 04-October-2015]. 81. The World Bank (Health Data). http://data.worldbank.org/topic/health. [Online; accessed 04-October-2015]. 82. Johns Hopkins Individualized Health Initiative. http://hopkinsinhealth.jhu.edu/. [Online; accessed 04-October-2015]. 83. Human Connectome Project. http://www.humanconnectomeproject.org/. [Online; accessed 10-September-2015]. 84. Human Connectome Project. http://www.humanconnectome.org/. [Online; accessed 04-October-2015]. 85. Koedinger KR, Baker RS, Cunningham K, Skogsholm A, Leber B, Stamper J. A data repository for the edm
community: The pslc datashop. Handbook Educ Data Min. 2010;43:43–55.
86. PSLC Data Shop. https://pslcdatashop.web.cmu.edu/. [Online; accessed 04-October-2015].
87. The home of the U.S. Government’s open data (Education). http://www.data.gov/education. [Online; accessed 01-October-2015].
88. The World Bank (Education Data). http://data.worldbank.org/topic/education. [Online; accessed 04-October-2015]. 89. Alltuition. https://www.alltuition.com/. [Online; accessed 02-October-2015].
90. simpletuition. http://www.simpletuition.com/. [Online; accessed 02-October-2015]. 91. The Billion Prices Project @ MIT. http://bpp.mit.edu/. [Online; accessed 04-October-2015]. 92. PredictifyMe. http://predictify.me/. [Online; accessed 04-October-2015].
Aliet al. Big Data Analytics (2016) 1:2 Page 24 of 24
95. United Nations Global Pulse. http://www.unglobalpulse.org/. [Online; accessed 04-October-2015]. 96. The World Bank (Data). http://data.worldbank.org/. [Online; accessed 04-October-2015]. 97. Open Data Kit. https://opendatakit.org/. [Online; accessed 04-October-2015]. 98. RapidMiner. https://rapidminer.com/. [Online; accessed 05-October-2015]. 99. Hadoop. https://hadoop.apache.org/. [Online; accessed 04-October-2015].
100. Hall M, Frank E, Holmes G, Pfahringer B, Reutemann P, Witten IH. The weka data mining software: an update. ACM SIGKDD Explorations Newslett. 2009;11(1):10–8.
101. Weka. http://www.cs.waikato.ac.nz/~ml/weka/. [Online; accessed 04-October-2015].
102. EMR Amazon. https://aws.amazon.com/elasticmapreduce/. [Online; accessed 04-October-2015].
103. Steele J, Iliinsky N. Beautiful visualization: looking at data through the eyes of experts. O’Reilly Media, Inc. 2010. 104. Bilton N. A Day in the Life of NYTimes.com. 2009.
http://bits.blogs.nytimes.com/2009/12/17/a-day-in-the-life-of-nytimescom/. [Online; accessed 21-September-2015].
• We accept pre-submission inquiries
• Our selector tool helps you to find the most relevant journal • We provide round the clock customer support
• Convenient online submission • Thorough peer review
• Inclusion in PubMed and all major indexing services • Maximum visibility for your research
Submit your manuscript at www.biomedcentral.com/submit