
ScholarlyCommons
ScholarlyCommons
Publicly Accessible Penn Dissertations
2019
Electroweak Physics At The Large Hadron Collider With The Atlas
Electroweak Physics At The Large Hadron Collider With The Atlas
Detector: Standard Model Measurement, Supersymmetry
Detector: Standard Model Measurement, Supersymmetry
Searches, Excesses, And Upgrade Electronics
Searches, Excesses, And Upgrade Electronics
Elodie Resseguie
University of Pennsylvania, [email protected]
Follow this and additional works at: https://repository.upenn.edu/edissertations Part of the Physics Commons
Recommended Citation
Recommended Citation
Resseguie, Elodie, "Electroweak Physics At The Large Hadron Collider With The Atlas Detector: Standard Model Measurement, Supersymmetry Searches, Excesses, And Upgrade Electronics" (2019). Publicly Accessible Penn Dissertations. 3536.
https://repository.upenn.edu/edissertations/3536
This paper is posted at ScholarlyCommons. https://repository.upenn.edu/edissertations/3536
Standard Model Measurement, Supersymmetry Searches, Excesses, And
Standard Model Measurement, Supersymmetry Searches, Excesses, And
Upgrade Electronics
Upgrade Electronics
Abstract
Abstract
This thesis presents searches for the production of charginos and neutralinos, supersymmetric partners of the gauge bosons, decaying via $W$ and $Z$ bosons. To understand the dominant background in these searches, \WZ\, the \WZ cross section measurement is also performed. The measurement and searches were performed with both 36.1 \ifb\ and 139 \ifb\ of data collected at $\sqrt{s} = 13~\TeV$ with the ATLAS detector. The $WZ$ cross section is measured to be $50.6 \pm 3.6$ fb (statistical and systematic), which is consistent with the theoretical prediction calculated at next-to-next-to leading order in QCD. The supersymmetric searches are motivated by two models: Higgsino and wino production. The Higgsino search makes use of low-transverse-momentum leptons and leads to the first result of Higgsino production at a collider experiment since the Large Electron-Positron Collider. The wino production searches discussed in this thesis show a tension in the exclusion limit with one search finding an excess of data above the background prediction and another search targeting the same model and phase space which sees data consistent with the background prediction. The excess is followed up with 139 \ifb\ of data and the excess is found to be reduced. The signatures of electroweak SUSY will continue to be very important measurements throughout the life of the LHC but are difficult to perform because they require a lot of luminosity; as a result, these searches will remain interesting during the High-Luminosity LHC (HL-LHC) program, which will deliver 3000 \ifb\ of data. The increase in radiation during HL-LHC will require a new inner detector. To test the performance of this new detector, the thesis also describes the testing of one of the read-out chips, the HCC130, through calibration tests and irradiation.
Degree Type
Degree Type
DissertationDegree Name
Degree Name
Doctor of Philosophy (PhD)
Graduate Group
Graduate Group
Physics & AstronomyFirst Advisor
First Advisor
Elliot LipelesKeywords
Keywords
ATLAS, electroweak, instrumentation, LHC, supersymmetry
Subject Categories
Subject Categories
PhysicsCollider with the ATLAS Detector: Standard
Model Measurement, Supersymmetry Searches,
Excesses, and Upgrade Electronics
Elodie Deborah Resseguie
a dissertation
in
Physics and Astronomy
Presented to the Faculties of The University of Pennsylvania
in Partial Fulfillment of the Requirements for the Degree of Doctor of Philosophy
2019
Elliot Lipeles, Associate Professor, Physics
Supervisor of Dissertation
Joshua Klein, Professor, Physics
Graduate Group Chairperson
Dissertation Committee
Hugh Williams, Professor, Physics
I. Joseph Kroll, Professor, Physics
Jonathan Heckman, Assistant Professor, Physics
Philip Nelson, Professor, Physics
Excesses, and Upgrade Electronics
copyright
2019
Elodie Deborah Resseguie
I would like to thank my mentors and advisors who have encouraged me and cultivated my passion for physics. They include my undergraduate advisors Tony Tyson and Max Chertok. They introduced me to physics research and instrumentation and taught me to love both. I would like to thank my graduate advisor Elliot Lipeles. You taught me to look at physics critically and to think outside of the box. I really appreciate the support and advice I have received over the years. Thank you to the other Penn faculty, Joe Kroll, Brig Williams, and Evelyn Thomson. Your advice and mentorship has been invaluable during these years. The Penn group fosters collaboration across advisors and this has been my favorite part of graduate school. I really benefited by being able to learn from the other faculty members and also share ideas with my fellow graduate students.
When I first joined the Penn group, I started working on instrumentation. I would like to thank the Penn Instrumentation Group for taking me in and teaching me so much about board design, chip testing, and just chatting in general about electronics. Thank you to Mitch Newcomer, Paul Keener, Adrian Nikolica, Godwin Mayers, and Mike Reilly. I would also like to thank my collaborators at Lawrence Berkeley National Laboratory for working with us to develop the firmware for our chip testing: Carl Haber, Niklaus Lehmann, and Timon Heim. Finally, I would like to thank our collaborators at Brookhaven National Laboratory who helped with the chip irradiation, including Dave Lynn, Stefania Stucci, and Jim Kierstead.
At CERN, I joined the TRT DAQ team. Working on a part of the ATLAS detector and having to change electronic boards when the magnetic field was on was one of my favorite moments in graduate school. I would like to thank Anatoli Romaniouk, Dominik Derendarz, and Andrea Bocci for their leadership and guidance. I learned that the successful operation of the TRT is only possible due to collaboration between many groups of experts so I would like to thank also the DCS team, Jolanta Olszowska, Elziebeta Banas, and Zbyszek Hajduk. Finally thanks to the DAQ team. It was
a lot of fun working with you all: Chris Meyer, Khilesh Mistry, Bijan Haney, Keisuke Yoshihara, Shion Chen, Daniil Ponomarenko, Vincent Wong, Ian Dyckes, and Joe Mullin.
A large part of my experience on ATLAS was working on physics analyses. I want to especially thank Joana Machado Miguens. You were the first person I worked with on physics analysis and you have been a tremendous help to me; I definitely would not have been successful without you. I’m also glad we are now friends and that you showed me that life is better with a scooter. Another collaborator I want to thank is Joey Reichert. Joey, Joana, and I worked on many analyses together and it was so great working with both of them. I will truly miss working with you both! In addition, I would like to thank my other collaborators on the W Z cross section measurement, Kurt Brendlinger, and Will DiClemente and those I’ve spent countless hours working on SUSY searches with including Sarah Williams, Nicola Abraham, Ben Hooberman, Mike Hance, Stefano Zambito, Moritz Backes, Jesse Liu, Lorenzo Rossini, Sheena Schier, Julia Gonski, Jeff Shahinian, Iacopo Vivarelli, Jeff Dandoy, Ian Dyckes, Sara Alderweireldt, Shion Chen, Broos Vermeulen, Eli Baeverfjord Rye, and Lucia Pedraza.
There are other Penn ATLAS members not yet mentioned that I’d like to thank, including Christian Herwig, Ben Rosser, Lucas Flores, James Heinlein, and Rachael Creager. I especially want to thank two of my friends Leigh Schaefer and Bill Balunas. I will miss our conversations and our pranks.
Surviving grad school would not be have been possible without my friends. I would like to thank my roommates Christian Herwig, Ashley Baker, and Saul Kohn. I will never forget my graduate classmates; we were a really special group to have remained close during the years. I would like to thank especially Eric Horsley (“neighbs”). I will miss sushi dinners, walking to DRL in the morning, your wit and sense of humor. I would also like to thank Ashley Baker, Charlotte Pfeifer, Tatyana Gavrilchenko, and Lia Papadopoulos. You were my best friends in grad school. I will always be grateful for our brunches, crossword puzzles, animated shorts, and gym times. I would also like to thank the Penn soft matter group who adopted me as an honorary member, including Randy Kamien, Asja Radja, Jason Rocks, Desi Todorova, Tristan Sharp, Francesca Serra, Kevin Chiou, and Daniel Sussman. I would like to thank my friends at CERN: Magda Chesltowska, Aaron Armbruster, Alex Tuna, Jonathan Long, Doug Schaefer, Stany Sevova, Stefan Gadatsch, Tina Ojeda, Reyer Band, Riju Disgupta, and Christine McLean. Also, I would like to thank my friends Sasha Fedotova and Alyssa Schluter. Thanks for always visiting me wherever in the world I might be.
Electroweak Physics at the Large Hadron Collider with the ATLAS
Detector: Standard Model Measurement, Supersymmetry Searches,
Excesses, and Upgrade Electronics
Elodie Deborah Resseguie
E. Lipeles
This thesis presents searches for the production of charginos and neutralinos, supersymmet-ric partners of the gauge bosons, decaying via W and Z bosons. To understand the dominant background in these searches, W Z the W Z cross section measurement is also performed. The measurement and searches were performed with both 36.1 fb−1 and 139 fb−1 of data collected at
√
s = 13 TeV with the ATLAS detector. The W Z cross section is measured to be 50.6±3.6 fb (statistical and systematic), which is consistent with the theoretical prediction calculated at next-to-next-to leading order in QCD. The supersymmetric searches are motivated by two models: Higgsino and wino production. The Higgsino search makes use of low-transverse-momentum leptons and leads to the first result of Higgsino production at a collider experiment since the Large Electron-Positron Collider. The wino production searches discussed in this thesis show a tension in the exclusion limit with one search finding an excess of data above the background prediction and another search targeting the same model and phase space which sees data consistent with the background predic-tion. The excess is followed up with 139 fb−1 of data and the excess is found to be reduced. The signatures of electroweak SUSY will continue to be very important measurements throughout the life of the LHC but are difficult to perform because they require a lot of luminosity; as a result, these searches will remain interesting during the High-Luminosity LHC (HL-LHC) program, which will deliver 3000 fb−1 of data. The increase in radiation during HL-LHC will require a new inner detector. To test the performance of this new detector, the thesis also describes the testing of one of the read-out chips, the HCC130, through calibration tests and irradiation.
Acknowledgements iii
Abstract vi
Contents vii
List of Tables xiv
List of Figures xviii
Preface xxvi
1 Introduction 1
2 Theoretical Framework 3
2.1 Introduction to the Standard Model . . . 4
2.1.1 Symmetries and currents . . . 6
2.1.2 Electromagnetic force: Quantum Electrodynamics . . . 8
2.1.3 Strong force: Quantum Chromodynamics . . . 10
2.1.4 Weak force and electroweak unification . . . 12
2.1.4.1 W andZ boson decays . . . 17
2.1.5 Spontaneous Symmetry Breaking and the Higgs Mechanism . . . 18
2.1.5.1 Spontaneous Symmetry Breaking . . . 19
2.1.5.2 Higgs Mechanism . . . 20
2.1.6 EWK symmetry breaking and the Higgs mechanism . . . 21
2.2 Open questions of the Standard Model . . . 25
2.3 Introduction to Supersymmetry . . . 28
2.3.1 Minimal Supersymmetric Standard Model . . . 30
3 LHC and the ATLAS Detector 34 3.1 The Large Hadron Collider . . . 34
3.2 The ATLAS Detector . . . 38
3.2.1 The Inner Detector . . . 40
3.2.1.1 Pixel Detector . . . 41
3.2.1.2 Semiconductor Tracker . . . 42
3.2.1.3 Transition Radiation Tracker . . . 42
3.2.2 The Calorimeters . . . 44
3.2.2.1 Liquid Argon Calorimeter . . . 45
3.2.2.2 Hadronic Calorimeters . . . 46
3.2.3 The Muon Spectrometer . . . 47
3.3 Particle reconstruction and identification . . . 48
3.4 Trigger system . . . 52
4 HL-LHC Inner Detector Upgrade 54 4.1 Motivation for the detector upgrade . . . 54
4.2 Inner Tracker: ITk . . . 55
4.3 Strips Read-out system . . . 56
4.4 HCC130 testing . . . 58
4.4.1 HCC130 signals . . . 58
4.4.2 Testing setup . . . 60
4.4.3 Description of the FPGA code . . . 61
4.4.4 Functional Tests of the HCC130 . . . 65
4.4.5 Testing the Analog Monitor (AM) . . . 68
4.5 HCC130 irradiation . . . 74
4.5.1 Motivation: current increase at low total ionizing dose . . . 74
4.5.2 Facility and setup . . . 76
4.5.3 Registers and voltages monitored . . . 80
4.5.4 Pre-irradiation calibrations . . . 81
4.6 Future improvements and studies . . . 83
5 W±Z cross-section measurement at √s= 13TeV 86 5.1 Cross section methodology . . . 88
5.1.1 Fiducial cross section . . . 88
5.1.2 Total cross section . . . 89
5.2 Phase space definition . . . 89
5.3 Data set and MC samples . . . 90
5.4 Object and Event Selection . . . 91
5.4.1 Object selection . . . 91
5.4.2 Event selection . . . 93
5.5 Overview of Backgrounds . . . 94
5.6 Background estimation . . . 96
5.6.1 Z+jet/Z+γBackground . . . 97
5.6.1.1 Fake Factor Methodology . . . 97
5.6.1.2 Fake Factor Measurement and Validation . . . 100
5.6.2 Top-like backgrounds . . . 102
5.6.3 ZZ Background . . . 103
5.6.3.1 Anti-ID Scale Factors . . . 104
5.6.3.2 ZZ Validation region . . . 109
5.7 Correction for acceptance and detector effects . . . 110
5.8 Systematic Uncertainties . . . 113
5.9 Results . . . 115
6 Searches for Electroweak SUSY: Motivation and Models 119 6.1 Motivation for Searching for Electroweak SUSY . . . 119
6.2 Wino-Bino Interpretation . . . 122
6.3 Higgsino Interpretation . . . 124
7 Search for wino-bino production decaying via W Z at √s= 13 TeV 127 7.1 Signal signature . . . 128
7.2 Simplified Model Framework . . . 129
7.3 Overview of Backgrounds . . . 129
7.5 Object and Event Selection . . . 131
7.5.1 Object Selection . . . 131
7.5.2 Motivation formmin T . . . 133
7.5.2.1 Efficiency of correctly identifying the origin of reconstructed leptons 134 7.5.2.2 Constructingmmin T . . . 135
7.5.2.3 Comparison of performance ofmTandmminT . . . 136
7.5.3 Event Selection . . . 139
7.5.3.1 Jet veto and ISR topology . . . 141
7.5.3.2 Jet veto region optimization . . . 142
7.5.3.3 ISR region optimization . . . 144
7.5.3.4 Summary of signal regions (SR) . . . 146
7.6 Background estimation . . . 147
7.6.1 W Z Background . . . 148
7.6.1.1 Control and Validation Regions . . . 148
7.6.2 Reducible Background Estimation . . . 153
7.6.2.1 Z+jets/Z+γ Background . . . 154
7.6.2.2 Top-like Backgrounds . . . 156
7.7 Uncertainties . . . 158
7.8 Two Leptons and Jets Final state . . . 159
7.8.1 Event Selection . . . 159
7.8.1.1 DefiningmT2 . . . 160
7.8.2 Background Modeling . . . 161
7.8.3 Results . . . 164
7.8.4 Sensitivity of each final state . . . 166
7.9 Results . . . 166
7.9.1 Background-only Fit . . . 167
7.9.2 Model Dependent Limits . . . 168
7.9.3 Model Independent Limits . . . 169
8 Studying the excess in the RJR search using the eRJR technique 171 8.1 Recursive Jigsaw Reconstruction (RJR) Search . . . 172
8.1.1 Overview of the RJR technique . . . 173
8.1.3 Object and Event Selection . . . 176
8.1.4 Background estimation . . . 178
8.1.5 Uncertainties . . . 181
8.1.6 Results . . . 182
8.2 Overlap of RJR and conventional 3`searches . . . 186
8.3 Emulated RJR (eRJR) Technique . . . 187
8.3.1 Translating RJR variables into lab frame variables . . . 188
8.3.2 Validation of the eRJR technique . . . 189
8.3.2.1 Comparison of RJR and eRJR kinematic variable shapes at preselection189 8.3.2.2 Correlations RJR and eRJR kinematic variables . . . 192
8.4 eRJR yields and study for the RJR phase . . . 195
8.4.1 Yields in SR-low and SR-ISR using eRJR variables . . . 195
8.4.2 SR-low excess studies . . . 197
8.4.3 SR-ISR excess studies . . . 198
8.4.3.1 Emiss T resolution usingZ+jets events . . . 199
8.4.3.2 Z-boson mass side-band study to check muon resolution . . . 201
8.5 Next steps . . . 201
9 Search for Wino-Bino production using the eRJR technique with Run 2 data 202 9.1 Data set and MC samples . . . 203
9.2 Object and Event Selection . . . 205
9.2.1 Object Selection . . . 205
9.2.2 Event Selection . . . 208
9.2.3 Impact of new reconstruction algorithm . . . 210
9.3 Background estimation . . . 211
9.3.1 Z+jet/Z+γ background . . . 213
9.3.2 Top-like backgrounds . . . 217
9.3.3 W Z background . . . 219
9.3.4 Background modeling in 2015-16 . . . 221
9.3.5 Background modeling in 2017 . . . 224
9.3.6 Background modeling in 2018 . . . 227
9.3.7 Background modeling in 2015-18 . . . 230
9.4.1 Fake Factor uncertainties . . . 233
9.4.2 W Z theory uncertainties . . . 236
9.4.3 Summary of systematics . . . 241
9.5 Results . . . 242
9.5.1 2015-16 results . . . 243
9.5.2 2017 results . . . 246
9.5.3 2018 results . . . 249
9.5.4 2015-18 results . . . 252
9.5.4.1 Background-only fit . . . 252
9.5.4.2 Discovery fit . . . 254
9.5.4.3 Exclusion fit . . . 255
9.6 Conclusion . . . 256
10 Search for the EWK production of compressed SUSY with soft leptons 258 10.1 Signal signature . . . 259
10.2 Overview of Backgrounds . . . 260
10.3 Data set and MC samples . . . 260
10.4 Object Selection . . . 262
10.5 Event Selection . . . 264
10.5.1 ETmiss Triggers . . . 264
10.5.2 m``andmT2 Shape Fits . . . 267
10.5.3 Definitions of Signal Regions . . . 269
10.6 Background estimation . . . 277
10.6.1 Top and Tau Backgrounds . . . 277
10.6.2 Diboson Background . . . 278
10.6.3 Reducible Background . . . 279
10.6.4 Different Flavor VR . . . 282
10.6.5 Summary of Background Estimation . . . 284
10.7 Uncertainties . . . 284
10.8 Results . . . 286
10.8.1 Background-only fit . . . 286
10.8.2 Discovery fit . . . 287
10.9 Wino-Bino reinterpretation . . . 293
11 Future work: search for compressed wino-bino production in the three lepton final state 296 11.1 Signal signature . . . 297
11.2 Overview of Backgrounds . . . 298
11.3 Data set and MC samples . . . 298
11.4 Object and Event Selection . . . 299
11.4.1 Object selection . . . 299
11.4.2 Overall strategy and trigger . . . 301
11.4.3 Lepton assignment for the off-shell three lepton search . . . 303
11.4.4 m``shape fit . . . 304
11.4.5 Optimizing withmT2 . . . 304
11.4.5.1 Choice of LSP mass in calculation ofmT2 . . . 305
11.4.5.2 Upper cut on mT2 to make use of the kinematic signal edge . . . 306
11.4.6 Summary of signal regions . . . 307
11.5 Next steps . . . 310
12 Conclusion 311 13 Appendix 314 13.1 Additional HCC testing plots . . . 314
13.2 eRJR additional studies . . . 318
13.2.1 Overlap of RJR andmmin T searches . . . 318
13.2.1.1 Emulating pCM T . . . 319
13.2.2 Comparison of the values of the eRJR and RJR kinematic variables . . . 319
13.2.3 Further SR-low excess studies . . . 322
2.1 Three generations of quarks and leptons . . . 4
2.2 Three forces of the Standard Model . . . 5
2.3 Summary of neutral current couplings. . . 16
2.4 Summary ofZ coupling to fermions assuming sin2θW = 0.23. . . 18
4.1 Summary of the signals emulated or verified in the HCC130 Interface IP block . . . 63
4.2 Summary of the signals emulated or verified in the HCC130 Chain Emulator IP block . 64 5.1 Summary of fiducial and phase space selection for theW Z cross section measurement . 90 5.2 Summary of the background processes and methods used to estimate them for theW Z cross section measurement . . . 91
5.3 Summary of the three levels for electron and muon criteria for the W Z cross section measurement . . . 93
5.4 Signal event selection for theW Z cross section measurement . . . 94
5.5 Definition for baseline leptons in the Fake Factor measurement region for theW Z cross section measurement . . . 101
5.6 Definition of the anti-ID criteria for the Fake Factor measurement region for the W Z cross section measurement . . . 101
5.7 Fraction ofZZ events that falls in the signal region because the fourth lepton is outside the acceptance, or because it fails identification, split by flavor of the fourth lepton . . . 106
5.8 PredictedZZ yields after the fullW Z selection, with and without anti-ID scale factors applied to unidentified fourth lepton within the acceptance . . . 107
5.9 CW Z andNτ/Nallfor each decay channel for theW Z cross section measurement . . . . 112
5.10 Summary of the relative uncertainties in the measured fiducial cross section for each channel and for the combination for theW Z cross section measurement . . . 114
5.11 Observed and expected number of events afterW Z inclusive selection . . . 115
5.12 Fiducial integrated cross section measured in each of the channels and combined for the W Z cross section measurement . . . 116
7.1 Summary of the signal and background processes with the generator used for the simu-lation and the order at which the cross section is calculated in the conventional searches 131 7.2 Summary of the baseline and signal levels for electron and muon criteria in the conven-tional searches . . . 132
7.3 Summary of the baseline and signal selection for jets andb-jets in the conventional searches132
7.4 Summary of signal points used for optimization in the conventional 3` search . . . 133
7.5 Summary of the cuts used in themmin T study . . . 134
7.6 Summary of the trigger strategy in the conventional searches . . . 140
7.7 Summary of loose event selection in the conventional searches . . . 140
7.8 Summary of the exclusive signal regions in the conventional 3`search . . . 147
7.9 Summary of the estimation methods in the conventional 3`search . . . 147
7.10 Control and validation region definitions in the conventional 3`search . . . 147
7.11 Scale factors obtained from the background-only fits in the conventional 3`search . . . 150
7.12 Yields obtained from the binned control regions from the background-only fit in the conventional 3`search . . . 151
7.13 The fitted results shown for the binned validation regions are obtained from the binned control regions using the background-only fit in the conventional 3` search . . . 151
7.14 Definition of the anti-ID criteria for the Fake Factor measurement region in the conven-tional 3`search . . . 154
7.15 Summary of measurement and validation regions used for theZ+jets/Z+γ estimates in the conventional 3`search . . . 155
7.16 Selection criteria used to define the control region for the top-like backgrounds in the conventional 3`search . . . 157
7.17 Signal region definitions in the conventional 2`search . . . 160
7.18 Validation region definitions used in the conventional 2`search . . . 162
7.19 Yields in the validation regions for “loose” and “tight” selections for int and VR2-high in the conventional 2` search . . . 163
7.20 Yields results for the “loose” and “tight” selections of VR2-low in the conventional 2` search . . . 164
7.21 Background results for the diboson validation regions in the conventional 2`search . . . 164
7.22 Observed events in the conventional 2`search SRs . . . 165
7.23 Yields in the signal regions in the conventional 3`search . . . 169
7.24 Model-independent limits in the conventional 3`search . . . 170
8.1 Preselection and selection criteria for the standard tree regions for the RJR search . . . 177
8.2 Preselection and selection criteria for the 3` ISR regions for the RJR search . . . 178
8.3 CR and VR yields in the RJR search . . . 181
8.4 Summary of systematic uncertainties in RJR signal regions . . . 181
8.5 Expected and observed yields in the RJR signal regions . . . 183
8.6 Model-independent limits for the RJR SRs . . . 186
8.7 eRJR ISR regions yields . . . 196
8.8 SR-low cutflow using the eRJR variables . . . 196
8.9 Yields in the RJR and eRJR CR, VR, and SRs . . . 197
8.10 Yields in ISR side-band region to study SR-ISR excess . . . 201
9.1 Monte Carlo simulation details by physics process for the eRJR search . . . 203
9.2 Summary of the baseline and signal levels for electron and muon criteria for the eRJR search . . . 207
9.3 Summary of the baseline and signal selection for jets andb-jets for the eRJR search . . 207
9.4 Summary of trigger strategy used in the eRJR search . . . 208
9.5 Selection criteria for the low-mass and ISR regions for the eRJR search . . . 209
9.6 Overlap of reconstruction algorithms in a cutflow for the eRJR search . . . 210
9.8 Anti-ID electron and muon definitions used in the fake factor method for the eRJR search213
9.9 Selection criteria used to define the fake factor region in the eRJR search . . . 214
9.10 Selection criteria used to define the Z+jets/Z+γ fake factor validation region for the eRJR search . . . 216
9.11 Top-like CR selection for the eRJR search . . . 217
9.12 Background only CR-only fit normalization factors for the eRJR search . . . 221
9.13 The observed and expected yields after the background-only fit in the low-mass CR and VR for 36.1 fb−1 in the eRJR search . . . 222
9.14 The observed and expected yields after the background-only fit in the ISR CR and VRs for 36.1 fb−1in the eRJR search . . . 223
9.15 The observed and expected yields after the background-only fit in the low-mass CR and VR for 43.9 fb−1 in the eRJR search . . . 225
9.16 The observed and expected yields after the background-only fit in the ISR CR and VRs for 43.9 fb−1in the eRJR search . . . 225
9.17 The observed and expected yields after the background-only fit in the low-mass CR and VR for 59 fb−1 in the eRJR search . . . 228
9.18 The observed and expected yields after the background-only fit in the ISR CR and VRs for 59 fb−1 in the eRJR search . . . 228
9.19 The observed and expected yields after the background-only fit in the low-mass CR and VR for 139 fb−1 in the eRJR search . . . 231
9.20 The observed and expected yields after the background-only fit in the ISR CR and VRs for 139 fb−1in the eRJR search . . . 231
9.21 Relative uncertainties (in %) on the modelling applied to the normalization of theW Z in all regions . . . 237
9.22 Summary of the dominant experimental and theoretical uncertainties in the eRJR search 242 9.23 Observed and expected yields in the SRs in the eRJR search for 36.1 fb−1 . . . 243
9.24 Observed and expected yields in the SRs in the eRJR search for 43.9 fb−1 . . . 246
9.25 Observed and expected yields in the SRs in the eRJR search for 59 fb−1 . . . 249
9.26 Observed and expected yields in the SRs in the eRJR search for 139 fb−1 . . . 252
9.27 Discovery fit results for the eRJR search . . . 255
10.1 Summary of the signal and background processes for the compressed searches . . . 261
10.2 Summary of the baseline and signal levels for electron and muon criteria in the compressed searches . . . 263
10.3 Summary of the baseline and signal selection for jets andb-jets in the compressed searches263 10.4 Summary ofEmiss T triggers used in the compressed searches . . . 267
10.5 Summary of event selection criteria for the compressed searches . . . 270
10.6 Signal region binning for the compressed electroweakino and slepton SRs . . . 270
10.7 Summary of the estimation methods for each background process for compressed searches 277 10.8 Definition of control and validation regions for the compressed searches . . . 277
10.9 Definition of the anti-ID criteria for the Fake Factor measurement region for the com-pressed searches . . . 280
10.10Summary of measurement and validation regions used for the dijet Fake Factor estimate in the compressed searches . . . 280
10.11Observed event yields and background-only fit results for the inclusive compressed elec-troweakino and slepton signal regions . . . 288
11.1 Summary of the signal and background processes for the off-shell 3`search . . . 299
11.2 Summary of the baseline and signal levels for electron and muon criteria for the off-shell 3`search . . . 300
11.3 Summary of the baseline and signal selection for jets andb-jets for the off-shell 3`search 300 11.4 Summary of event selection criteria for the off-shell 3`search . . . 308
11.5 Summary of cuts in each of themmin `` bins for the off-shell 3`search . . . 308
13.1 Values of kinematic variables for the events which enter the RJR SR-ISR but do not enter themmin T SRs . . . 318
13.2 Values of kinematic variables for the events which enter the RJR SR-low but do not enter the conventional 3`SRs . . . 318
13.3 Comparing differentpsoft T emulations with the RJRpCMT variable . . . 319
13.4 Values of eRJR variables for the 2015-16 data in SR-ISR . . . 320
13.5 Values of RJR variables for the 2015-16 data in SR-ISR . . . 320
13.6 Values of eRJR variables for the 2015-16 data in SR-low . . . 321
2.1 Standard Model of particle physics . . . 3
2.2 Feynman diagram of an interaction between fermions and a photon . . . 10
2.3 Feynman diagram of an interaction between quarks and a gluon . . . 12
2.4 Feynman diagram of gluon self-interactions . . . 12
2.5 Vertex for a charged-current weak interaction . . . 16
2.6 Feynman diagram of cubic and quartic self-interactions of gauge bosons . . . 17
2.7 PotentialV(φ) for a complex scalar field withm2<0 andλ >0 . . . 20
2.8 Feynman diagram of Higgs boson interactions . . . 24
2.9 Feynman diagram of Higgs boson coupling to fermions . . . 25
2.10 Summary of Standard Model total production cross section measurements . . . 26
2.11 Loop corrections to the Higgs mass . . . 26
2.12 Impact of SUSY particles to the Higgs mass correction . . . 29
2.13 Feynman diagram of an anomalous gauge coupling . . . 30
2.14 MSSM particle content . . . 31
2.15 SUSY interactions proportional toyt . . . 32
2.16 Interactions of gauginos with scalar or fermion pairs . . . 32
3.1 Diagram of the CERN accelerator complex . . . 35
3.2 Diagram of an LHC dipole magnet . . . 36
3.3 Number of interactions per bunch crossing for 2015-2018 at√s= 13 TeV . . . 37
3.4 Peak luminosity per fill delivered in 2018 at√s= 13 TeV . . . 38
3.5 Total integrated luminosity and data quality collected by ATLAS in Run 1 and Run 2 . 38 3.6 General cut-away view of the ATLAS detector . . . 39
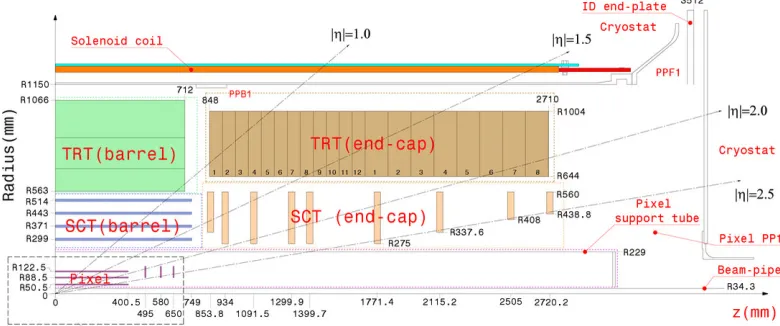
3.7 Cut-away view of the ATLAS inner detector . . . 40
3.8 Inner detector barrel detectors . . . 41
3.9 High-threshold turn-on curve separated byγ factor . . . 43
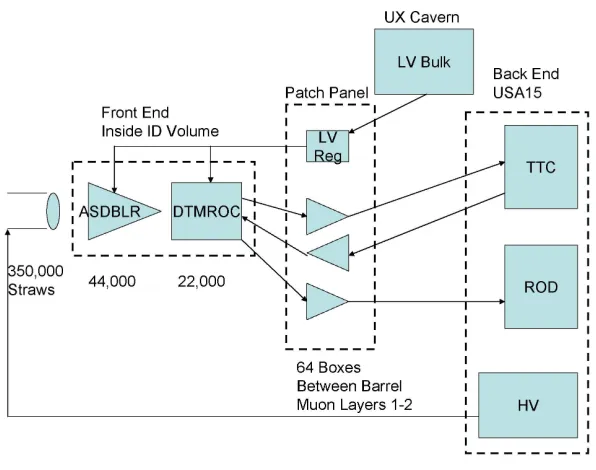
3.10 Overview of the TRT electronics . . . 44
3.11 Cut-away view of the ATLAS calorimeters . . . 45
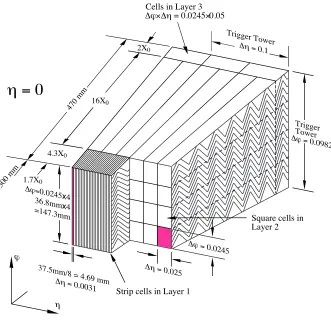
3.12 Barrel module for the LAr calorimeter . . . 46
3.13 Schematic of the muon system . . . 48
3.14 Diagram of particle paths in the ATLAS detector . . . 49
3.15 HLT trigger rates during a fill in 2018 . . . 52
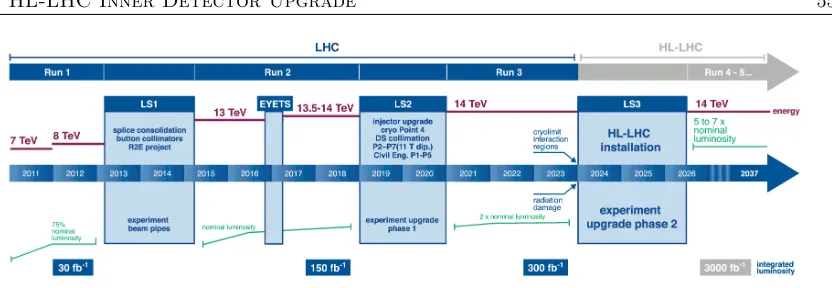
4.1 Timeline for the LHC program including HL-LHC . . . 55
4.2 Schematic of the layout of the ITk detector . . . 55
4.3 Schematic of an ITk strip module . . . 56
4.4 Readout system for the Strip detector with the ABC130 and HCC130 . . . 57
4.5 Diagrams of the daisy chain signal routing from the ABC130 to the HCC130 and the new star design . . . 58
4.6 Readout system for the Strip detector with the HCCstar, ABCstar, and AMAC . . . 59
4.7 Diagram of the signals sent and received between the HCC130 and the ABC130 chips . 60 4.8 Photographs of the passive and active boards used in the testing of the HCC130 chip . . 61
4.9 Spice schematic for the comparator used to read signals from the HCC130 . . . 62
4.10 Cartoon illustrating the logic blocks programmed in the MicroZed for the testing of the HCC130 . . . 62
4.11 Oscilloscope trace of the pattern sent from the HCC130 at startup . . . 65
4.12 Oscilloscope traces of BC and DRC clocks from the HCC130 . . . 66
4.13 Oscilloscope traces of L0, L1, and R3 triggers from the HCC130 . . . 67
4.14 Oscilloscope traces of L1 trigger for different common mode voltages . . . 67
4.15 Monitoring BG, DVDD, VDD, and the current from the HCC130 . . . 68
4.16 Schematic of the quantities monitored by the AM . . . 69
4.17 Calibrating the Analog Monitor using the Vsense pin and calibration values for different bandgap values . . . 70
4.18 Calibrating the Analog Monitor for different DVDD and VDD values . . . 70
4.19 Schematic of the circuit used for temperature measurement testing in the AM for the HCC130 . . . 71
4.20 Picture of the NTC test setup for the HCC130 . . . 72
4.21 Calibrating the NTC AM using a thermistor . . . 73
4.22 Testing the interlock system on a general purpose output pin, GPO1, by sweeping over voltage sensing pin input voltages . . . 74
4.23 Digital current versus TID for the ABC130 during X-ray irradiation . . . 75
4.24 Illustration of radiation on NMOS transistor . . . 76
4.25 Average LV current in the IBL’s FE-I4 chips during stable beam as a function of integrated luminosity and TID . . . 77
4.26 Schematic and picture of the side view of the cold box containing the passive board with the HCC130 . . . 77
4.27 Monitoring the temperature on the passive board during HCC130 irradiation . . . 78
4.28 Picture of the nitrogen flow setup and monitoring before HCC130 radiation . . . 78
4.29 Picture of the location of the HCC130 with respect to the60Co source inside the BNL source room . . . 79
4.30 HCC130 irradiation setup . . . 79
4.31 Picture of the lead shield used to protect controller boards during the HCC130 irradiation 80 4.32 AM voltage monitoring before HCC130 irradiation . . . 82
4.33 AM calibration ramps, slopes, and intercepts before HCC130 irradiation . . . 83
4.34 HCC130 current during irradiation as a function of elapsed hours and TID . . . 84
4.35 HCC130 bandgap AM during irradiation as a function of elapsed hours and TID . . . . 84
4.36 AM calibration ramps, slopes, and intercepts during HCC130 irradiation . . . 85
4.37 Number of error reads for each of the control registers 0-3 and the sum of SEUs during the HCC130 irradiation . . . 85
5.1 Leading-order diagrams forW±Z production in ppcollisions . . . . 86
5.3 “Top-like” production processes where the decay from theb-quark results in a fake lepton 95 5.4 Leading-order diagrams forZZ production in ppcollisions . . . 96 5.5 Emiss
T distribution in the Fake validation region for theW Z cross section measurement . 102 5.6 The number of jets distribution in the top control region for theW Z cross section
mea-surement . . . 104 5.7 ∆R between the matched truth and reconstructed leptons (raw MC events) for theZZ
background . . . 105 5.8 Invariant mass between the third lepton matched with a reconstructed lepton and the
fourth truth lepton coming from theZ decay . . . 105 5.9 ID scale factors, MC efficiencies and anti-ID scale factors for loose muons with pT >
15 GeV, as a function ofη andφ . . . 107 5.10 ID scale factors, MC efficiencies and anti-ID scale factors for loose muons with pT <
20 GeV, as a function ofη andpT . . . 108 5.11 Anti-ID scale factors forLooseLH+BLayerelectrons withpT>20 GeV andpT<20 GeV,
as a function of ηand pT . . . 108 5.12 Truth kinematics of the unidentified fourth muons inZZ events (raw MC events) . . . . 109 5.13 Truth kinematics of the unidentified fourth electrons inZZ events (raw MC events) . . 109 5.14 Impact of anti-ID SFs on them``shape for theW Z cross section measurement . . . 110 5.15 Impact of anti-ID SFs on themW
T shape for theW Z cross section measurement . . . 111 5.16 The mass of the Z boson distribution in the ZZ validation region for the W Z cross
section measurement . . . 112 5.17 Reconstructed detector-level distributions in the WZ signal region . . . 116 5.18 Ratio of the measuredW Z cross section in the fiducial phase space to the NLO SM
pre-diction fromPowheg+PYTHIA, andW+Z/W−Z fiducial cross section ratio, compared
to the NLO prediction . . . 117 5.19 W Z cross section measurements at various center-of-mass energies with Standard Model
expectations . . . 118 6.1 SUSY production cross-sections at√s= 13 TeV . . . 119 6.2 Exclusion limits for the stop and gluino productions . . . 120 6.3 Feynman diagrams for ˜χ±1χ˜∓1 and ˜χ±1χ˜02 production . . . 121 6.4 SUSY mass spectrum for wino-bino and Higgsino models . . . 121 7.1 The 95% CL exclusion limits on ˜χ+1χ˜−2, ˜χ±1χ˜0
2and ˜χ02χ˜03 production after Run 1 . . . 127 7.2 Diagrams for the production of ˜χ±1χ˜0
2 decaying viaW and Z bosons in ppcollisions in the conventional 2 and 3 leptons searches . . . 128 7.3 Efficiency of correctly identifying theZ lepton as a function ofEmiss
T andmT . . . 135 7.4 Comparison of mT calculated with the W lepton and the neutrino (using truth) and
Emiss
T in reconstructed events for both min. and traditional assignments . . . 136 7.5 Two dimensional correlation plots showing the significance forEmiss
T vs. mminT for inter-mediate mass splittings . . . 137 7.6 Two dimensional correlation plots showing the significance forEmiss
T vs. mminT for large mass splittings . . . 138 7.7 Traditional and min. assignment for theW Zbackground and (m(χe02/χe±1),m(χe01))=(450,50)
signal point . . . 139 7.8 Cartoon showing the difference in kinematics between a signal sample with a large mass
splitting and a signal sample with an intermediate mass splitting . . . 140 7.9 Distribution ofmmin
7.10 Cartoon illustrating the impact of the addition of an Initial-State-Radiation (ISR) jet on the signal kinematics . . . 142 7.11 Emiss
T and m
min
T distributions in the jet veto region in the conventional 3`search . . . . 142 7.12 Significance of a lower bound onEmiss
T vs. a lower bound onm min
T in the jet veto region in the conventional 3`search . . . 143 7.13 Emiss
T and m
min
T distributions in the ISR region in the conventional 3`search . . . 144 7.14 Significance of a lower bound onEmiss
T vs. a lower bound onm min
T in the ISR region in the conventional 3`search . . . 145 7.15 p```
T and lead jetpTdistributions in the ISR region in the conventional 3`search . . . . 146 7.16 Significance of a lower bound onEmiss
T vs. a lower bound onmminT in the ISR region in the conventional 3`search . . . 146 7.17 Jet multiplicity distribution in the inclusive W Z control region in the conventional 3`
search . . . 148 7.18 Cartoon defining the SR, CR, and VRs for the jet veto and ISR regions in the conventional
3`search . . . 149 7.19 Distributions in the jet vetoW Z control region in the conventional 3`search . . . 149 7.20 Distributions in the ISRW Z control region in the conventional 3`search . . . 150 7.21 Distributions in the jet vetoW Z validation region with NF applied to W Z background
in the conventional 3`search . . . 152 7.22 Distributions in the ISRW Z validation region with NF applied to W Z background in
the conventional 3`search . . . 153 7.23 Cartoon demonstrating the selection used to obtain the Fake Factor measurement and
validation regions in the conventional 3`search . . . 155 7.24 Emiss
T distribution in the fake validation region, VR3-offZa, in the conventional 3`search 156 7.25 Emiss
T distribution in the fake validation region, VR3-offZb . . . 157 7.26 Cartoon illustrating the calculation ofmT2 . . . 160 7.27 Distributions ofEmiss
T and mT2 in the 2`+jets validation region in the conventional 2` search . . . 163 7.28 Distributions ofETmissin SR2-int/high and SR2-low in the conventional 2` search . . . . 165 7.29 Sensitivity of the conventional 2`and 3` signal regions in the the plane of ˜χ01 and ˜χ±1χ˜
0 2 plane . . . 166 7.30 The observed and expected background yields in the signal regions considered in the
2`+0 jets, 2`+jets, and 3`final states . . . 167 7.31 Distributions ofEmiss
T in the 3`signal regions . . . 168 7.32 Observed and expected exclusion limits on SUSY simplified models for chargino–neutralino
production with decays viaW/Z bosons in the conventional searches . . . 169 8.1 Comparison of limits from the RJR and the conventional 3`searches . . . 171 8.2 Diagrams for the production of ˜χ±1χ˜0
2decaying viaW andZ bosons inppcollisions with and without an ISR jet . . . 172 8.3 RJR decay trees . . . 174 8.4 Regions targeted by each of the RJR SRs . . . 176 8.5 Kinematic distributions in CR-low and CR-ISR for the RJR search . . . 179 8.6 Kinematic distributions in VR-low and VR-ISR for the RJR search . . . 180 8.7 Summary of the observed and expected SM background yields in the CRs, VRs and SRs
8.10 Observed and expected exclusion limits on SUSY simplified models for chargino–neutralino production with decays viaW/Z bosons in the RJR search . . . 186 8.11 Kinematic distributions in the standard tree preselection regions for RJR and eRJR . . 190 8.12 Kinematic distributions in the compressed tree preselection regions for RJR and eRJR . 191 8.13 Correlations of RJR and eRJR variables in low-mass preselection regions inclusive in jets 192 8.14 Correlations of RJR and eRJR variables in low-mass preselection regions with a jet veto
applied . . . 193 8.15 Correlations of RJR and eRJR variables in the ISR preselection region . . . 194 8.16 Correlations of RJR and eRJR variables in the ISR preselection region split by the number
of jets . . . 195 8.17 ThemTdistribution in SR-low using eRJR variables . . . 197 8.18 Emiss
T distribution split byW lepton flavor . . . 198 8.19 ThemTdistribution in SR-ISR using eRJR variables . . . 199 8.20 Perpendicular components ofETmiss andmTfor differentp``T selections . . . 200 9.1 Correlation ofR ETmiss,jetsbetween the reconstruction algorithms in CR-ISR for events
with the same and different jet multiplicities . . . 211 9.2 Correlation of mT and
psoftT psoft
T +m3eff` between the reconstruction algorithms in CR-low for events with different Emiss
T requirements . . . 212 9.3 Z+jets/Z+γ fake factors for electrons and muons as a function ofpTfor the eRJR search214 9.4 Z+jets/Z+γ fake factors for electrons and muons as a function ofη for the eRJR search 215 9.5 Kinematic distributions in the Z+jets/Z+γ validation region for events with a fake
electron candidate for the eRJR search . . . 215 9.6 Kinematic distributions in theZ+jets/Z+γvalidation region for events with a fake muon
candidate. for the eRJR search . . . 216 9.7 Distributions in the top-like CR with 3 signal leptons for the eRJR search . . . 218 9.8 Distributions in the top-like CR with 2 signal and 1 anti-ID leptons for the eRJR search 218 9.9 Comparing RJRpCM
T and eRJRp soft
T inW Z ISR preselection events split by the number of jets . . . 220 9.10 Efficiency ofpsoft
T as a function of µ. . . 220 9.11 Kinematic distributions in CRs for 36.1 fb−1in eRJR search . . . 222 9.12 Kinematic distributions in VRs for 36.1 fb−1 in eRJR search . . . 223 9.13 Kinematic distributions in CRs for 43.9 fb−1in eRJR search . . . 224 9.14 Kinematic distributions in VRs for 43.9 fb−1 in eRJR search . . . 226 9.15 Kinematic distributions in CRs for 59 fb−1 in eRJR search . . . 227 9.16 Kinematic distributions in VRs for 59 fb−1 in eRJR search . . . 229 9.17 Kinematic distributions in CRs for 139 fb−1 in eRJR search . . . 230 9.18 Kinematic distributions in VRs for 139 fb−1in eRJR search . . . 232 9.19 Prompt subtraction systematic for the fake factor in the eRJR search . . . 235 9.20 Parametrization systematic for the fake factor in the eRJR search . . . 235 9.21 Closure systematic for the fake factor in the eRJR search . . . 236 9.22 Impact ofW Z theory systematics onEmiss
T andmT in the low-mass preselection region 238 9.23 Impact ofW Z theory systematics onEmiss
T andmT in the ISR preselection region . . . 239 9.24 Impact ofW Z theory systematics onNjets in the ISR preselection region . . . 240 9.25 Comparison ofEmiss
T andmTfor differentW Z generators . . . 241 9.26 Extrapolation of CR to SR of thePowhegandSHERPAratio . . . 242 9.27 Distributions in SR-low of the data and post-fit background prediction in the eRJR search
9.28 Distributions in SR-ISR of the data and post-fit background prediction in the eRJR search for 36.1 fb−1 . . . 245 9.29 Distributions in SR-low of the data and post-fit background prediction in the eRJR search
for 43.9 fb−1 . . . 247 9.30 Distributions in SR-ISR of the data and post-fit background prediction in the eRJR
search for 43.9 fb−1 . . . 248 9.31 Distributions in SR-low of the data and post-fit background prediction in the eRJR search
for 59 fb−1 . . . 250 9.32 Distributions in SR-ISR of the data and post-fit background prediction in the eRJR
search for 59 fb−1 . . . 251 9.33 The observed data and expected SM background yields in the VRs and SRs in the eRJR
search . . . 252 9.34 Distributions in SR-low of the data and post-fit background prediction in the eRJR search
for 139 fb−1 . . . 253 9.35 Distributions in SR-ISR of the data and post-fit background prediction in the eRJR
search for 139 fb−1 . . . 254 9.36 Expected and observed exclusion contours for the eRJR search . . . 256 10.1 Diagrams for the production of (a) ˜χ±1χ˜0
2 decaying via W and Z bosons, (b) direct productions of ˜`˜`, decaying to two leptons andEmiss
T inppcollisions . . . 259 10.2 Signal lepton efficiencies for electrons and muons, averaged over all Higgsino and slepton
samples . . . 262 10.3 Trigger turn-on curves for constant HLT MHTEmiss
T and varying L1 thresholds split by signal with positive and negative chargino for the compressed searches . . . 265 10.4 Emiss
T trigger turn-on curves for constant L1 value, varying the cell ETmiss and varying MHTEmiss
T cuts for different mass splittings in the compressed searches . . . 266 10.5 Emiss
T trigger turn-on curves for constant L1 value, varying the cell ETmiss, and varying MHTEmiss
T cuts, the masses of the produced SUSY particles and constant ∆m for the compressed searches . . . 266 10.6 Comparing ETmiss turn-on curves for MHT, cell, and pufit EmissT with constant L1 for
three different signal masses and mass splittings for the compressed searches . . . 267 10.7 m`` distribution in the inclusivem`` SR [1,60] in the compressed electroweakino search . 268 10.8 mT2 distribution in the inclusivem100T2 SR [100,∞] in the compressed slepton search . . 269 10.9 Distributions after the background-only fit of lepton kinematic variables in the common
SR for compressed searches . . . 271 10.10Distributions after the background-only fit of kinematic variables used to select the ISR
topology for compressed searches . . . 272 10.11Shapes of reco and truthmτ τ, recom`` for the compressed searches . . . 274 10.12Distributions after the background-only fit of mτ τ in the common SR for compressed
searches . . . 274 10.13Distributions after the background-only fit of ∆R`` in the common SR for compressed
searches . . . 275 10.14Distributions after the background-only fit of mT in the common SR for compressed
searches . . . 275 10.15Distributions after the background-only fit of ETmiss/HTlep in the common SR for
com-pressed searches . . . 276 10.16Distributions ofEmiss
T /H
lep
T for the electroweakino and slepton SRs . . . 276 10.17Distributions after the background-only fit ofmτ τ in CR-tau andETmiss/H
lep
10.18Distributions after the background-only fit ofm`` and m100T2 in VR-VV for compressed searches . . . 279 10.19Distributions after the background-only fit of the sub-leading leptonpT,m``, andm100T2
in VR-SS for compressed searches . . . 281 10.20Distributions in VRDF-iMLL for compressed searches . . . 283 10.21Distributions in VRDF-iMT2 for compressed searches . . . 283 10.22Comparison of observed and expected event yields in the validation regions after the
background-only fit for the compressed searches . . . 284 10.23The relative systematic uncertainties in the background prediction in the exclusive
com-pressed electroweakino and slepton SRs . . . 285 10.24Distributions after the background-only fit in SR``-m100
T2and SR``-m100T2for compressed searches . . . 287 10.25Comparison of observed and expected event yields after the exclusion fit for the
com-pressed searches . . . 290 10.26Exclusion fit for direct compressed electroweakino production . . . 292 10.27Exclusion fit for direct compressed slepton production . . . 293 10.28m`` for direct Higgsino and direct wino productions . . . 294 10.29Acceptance ofm`` reweighted Higgsino and wino-bino samples . . . 294 10.30Exclusion fit of reinterpretation of compressed electroweakino SRs for the direct wino
production . . . 295 11.1 The 95% CL exclusion limits on ˜χ+1χ˜−1 and ˜χ±1χ˜0
2 production with SM-boson-mediated decays, as a function of the ˜χ±1, ˜χ0
2and ˜χ01 masses . . . 296 11.2 Diagrams for the production of ˜χ±1χ˜0
2decaying via off-shellW andZ bosons inppcollisions297 11.3 Visualization of the scheme used to combine single, di- and trilepton triggers for the
off-shell 3`search . . . 302 11.4 Emiss
T and lead jetpT distributions in a selection with at least 1 jet for the compressed 3`search . . . 302 11.5 Lower bound on lead jetpT vs. ETmissfor signal with four mass splittings for the off-shell
3`search . . . 303 11.6 mmin`` andmmax`` foreeeandµµµevents for the off-shell 3`search . . . 304 11.7 mmin`` foreee/µµµevents andµµe/eeµevents for the off-shell 3` search . . . 305 11.8 Cartoon showing the calculating ofmT2 variable in the three lepton and EmissT final state 305 11.9 mT2 calculated varying the assumption on the LSP mass in the off-shell 3`search . . . 306 11.10AsymmetricmT2 for different values of Y, LSP mass kept at 100 GeV for the off-shell 3`
search . . . 307 11.11∆mT2 distribution in the off-shell 3`search . . . 307 11.12mminMll
T in the jet veto event selection for the off-shell 3` search . . . 309 11.13p```
T /ETmissin the ISR event selection for the off-shell 3`search . . . 309 11.14Expected sensitivity for the off-shell 3` search . . . 310 12.1 Current 95% exclusion limits on ˜χ+1χ˜−1 and ˜χ±1χ˜0
2 production with SM-boson-mediated decays, as a function of the ˜χ±1, ˜χ0
2and ˜χ01 masses . . . 312 12.2 Current 95% exclusion limits on ˜χ+1χ˜−1 and ˜χ±1χ˜02decaying via sleptons, as a function of
This thesis presents my work on the ATLAS experiment from 2014 to 2019. As a graduate student at the University of Pennsylvania, I worked on the ATLAS experiment focusing on detector opera-tions, detector upgrades,W Z cross section measurement, and electroweak supersymmetry (SUSY) searches.
Hardware: HCC testing and irradiation
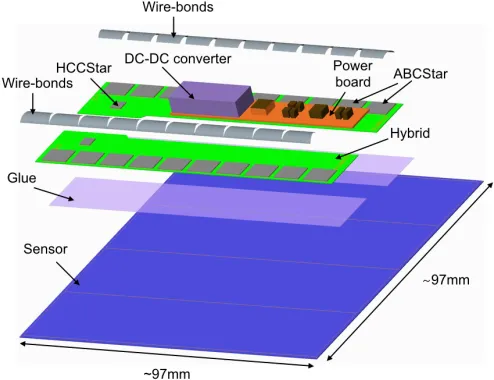
I began my research on ATLAS by working on the electronics for an upgraded tracker. In order to gain more sensitivity to processes with small production cross sections, the rate of proton-proton collisions must increase by a factor of ten; this configuration of the LHC is known as High-Luminosity LHC (HL-LHC). The particles emerging from the collisions are measured by the ATLAS detector. In the higher rate conditions, the inner part of the current ATLAS detector will no longer be able to resolve charged particles due to the large number of collisions per crossing of proton bunches. As a result, a new inner detector, made of silicon will take its place. I worked on testing one of the application specific integrated circuits (ASICs), the hybrid controller chip or HCC130, used read-out data from the silicon-strip sensors. I tested the HCC130, the prototype chip for the upgrade to the inner detector before HL-LHC. The work is summarized in Chapter 4. I designed two boards for the testing: one that would hold the HCC130 chip with protection diode, called the passive board, and another which would have active components and the the field programmable gate array (FPGA) and system-on-chip manufactured by XILINX, the MicroZed, called the active board. I selected Digital-to-Analog converter (DAC) and Analog-to-Digital converter (ADC) integrated circuits to be used on the active board to generate voltages for components on the board and read back voltages from the HCC130. I designed the layout of the board, figuring out how all the signals would be routed from the HCC130 and from each pin of each chip on the two boards. The two boards shown
in Appendix 13.1.
During this time, I also worked on the Field Programmable Gate Array (FPGA) code for the DAC and ADC. By looking at the chip’s specification sheets, I determined which signals were needed to control the DAC and ADC and read back their values, as well as the clocks needed for both. I also wrote code in C that allows the user to select the DAC and ADC and, for the DAC, which voltage to generate. This code interfaces between the user and the FPGA code that generates and reads back signals from the DAC/ADC.
I wrote additional code to develop testing protocols to test the HCC130, which allowed us to uncover some bugs in the chip design as well as provide a protocol for collaborators at Lawrence Berkeley National Laboratory to test all HCC130 given to the collaboration for further studies. The tests I performed on one block of the HCC130, the Analog Monitor (AM), were important in the development of the AMAC, a monitoring chip based on the HCC130’s AM. This work can be found in the upgrade Technical Design Report [1].
The detector will be exposed to a high level of radiation during operation of the HL-LHC, so it is important to test the radiation tolerance of the chips; furthermore, early tests of a different readout chip had shown that there was a rise in the current at low radiation doses. The HCC130 was irradiated to test for this current rise. For the HCC130 irradiation at Brookhaven National Laboratory with cobalt-60, I was responsible for writing the data acquisition (DAQ) code. I installed Linux on the microcontroller to be able to save the data collected. I wrote code to be able to perform different tests at different frequencies. While we were waiting for irradiation, I took months of calibration data to determine that the HCC130 and the DAQ system was stable in room-temperature conditions. I was also responsible for the analysis of the data from the irradiation and from the HCC130 testing. The results from irradiation have been helpful in determining that the HCC130 did not suffer from a large current bump at low total ionizing dose.
Operation: TRT DAQ
be able to sustain the increase in data. As a result, we upgraded some of the electronics on our boards. I participated in testing the new electronics and in the installation of electronics. After the electronics upgrade, I calibrated the TRT to ensure uniform levels of occupancy. I also checked the TRT for radiation damage by analyzing calibration runs; however, in 2016, only one calibration run was completed. In 2017, I wanted the TRT to have many calibrations to see the impact of radiation damage on the TRT as a function of luminosity. In order to collect these runs, the ID shifters need to take calibration runs when there is no data taking. I wrote a training manual so they would be able to take these calibrations and the experts would only need to analyze them. During this time, there was a migration to cmake and all our software needed to change to work with this new method of compilation, so I was involved in software changes as well.
After a year of working as part of the TRT DAQ team, I became a TRT DAQ coordinator and was responsible for training new students and postdocs working on the TRT as well as organizing the TRT tests conducted during machine development weeks. I led the effort in investigating software resynchronizations that the TRT experienced during the high-µ part of the heavy ion run. We believe that the resyncs are due to current increasing in the read-out electronics when the TRT receives many trigger requests after a period of not receiving triggers, which cause the buffers to fill up rapidly. I also wrote code so we would be able to change the settings of our trigger during cosmic running to match the conditions during a special LHC run.
Standard Model measurement: W Z cross section
Electroweak Supersymmetry: searches and excess follow up
Most of my thesis work has been spent on Supersymmetry searches. Physics beyond the Standard Model (SM) is an important search program because the SM does not explain the observation of a light Higgs mass, despite the quadratic divergence of the quantum corrections to the Higgs mass, or provide a dark matter candidate. R-parity conserving SUSY is a compelling model of new physics addressing these issues, and discovering it or excluding the simplest scenarios is well-motivated. Given the strong LHC constraints on squark and gluino production, electroweak (EWK) production is an interesting mode to search for SUSY and will benefit from the increase in luminosity during Run 3 and during HL-LHC (high luminosity LHC). I have focused most of my efforts on EWK SUSY searches on the ATLAS experiment, guided by two different simplified models: Bino lightest SUSY particle (LSP) with Wino next-to-lightest SUSY particle (NLSP), motivated by dark matter, and Higgsino LSP, motivated by naturalness, since the mass parameter µ, governing the mass of Higgsinos, is on the order of the weak scale. Higgsino LSPs result in small (“compressed”) mass splittings between the neutralinos resulting in soft leptons, missing transverse momentum, and a dilepton mass endpoint. Compressed scenarios are also worth pursuing for Bino LSP models because these contain uncovered regions of phase space, and SUSY particles need to be light to satisfy the dark matter relic density constraint.
In the Bino LSP search, the SUSY particles decay via on-shellW andZ bosons with a dominant W Z background. The signal is differentiated from the background by the presence of 2 additional invisible particles (LSPs). This results in extra missing energy (ETmiss) quantified asmT, the invariant mass of the leptons and ETmiss using only quantities transverse to the beam line. This search is performed using 2015 and 2016 data. The traditional variable has a problem thatW Z background can accidentally be reconstructed with largemT if the wrong lepton is chosen as the lepton from theW. I developed a new variable to mitigate this problem called mmin
T which allowed for greater background rejection than the nominal assignment. I worked on the signal region optimization, separating the region into a jet-veto region (to target larger mass splittings between SUSY particles) and an initial-state-radiation (ISR) region (to target smaller mass splittings). Control regions are used to normalize the dominant backgrounds to data while validation regions check the modeling of the normalized background. Both regions are kinematically similar but orthogonal to the signal regions. I also developed control regions for the W Z background and validation regions that also contain a jet veto and an ISR region to be close kinematically to the signal region. This search is further described in Chapter 7 and in our published work [3].
data in the signal regions, a process called “unblinding”. After unblinding, we saw good agreement between the observed data and the background expectation; however, another search also using 2015-2016 data but using the Recursive Jigsaw Reconstruction (RJR) technique saw an excess of data above the background expectation in a similar region of phase space [4]. The RJR technique is a complex method to reconstruct an event, boosting to different frames of references and calculating kinematic variables in those frames. I developed a simplified selection for the same phase space and reproduced the excess, a technique called “emulated RJR” (eRJR). The eRJR technique is described in Chapter 8. My study was instrumental in understanding the excess seen in this search and in explaining more intuitively the RJR technique.
I studied whether the excess of data above background remains with the addition of 2017 and 2018 data to determine if the excess grows with the additional data or is due to statistical fluctuation or mismodeling of the background. The excess decreased with the full Run 2 data set and the observed candidates in the signal region are consistent with the expected backgrounds. This work is detailed in Chapter 9. For the excess follow-up, I have studied the migration to the new reconstruction algorithm of the 2015-16 data that was unblinded by the RJR search. I studied the efficiencies as a function of pile-up for the selection for 2015-16 data and MC, taken at lower pileup conditions, and for 2017 data and MC, taken at higher pileup conditions. Due to changes of efficiencies in a variable used to define a validation region (VR) in the selection with an initial-state radiation (ISR) jet, VR-ISR, I developed two additional ISR VR to further check the background modeling. Most of the selection was kept identical to the RJR search; however, in the control (CR) and validation regions with a jet veto, CR-low and VR-low definitions were changed to make the regions orthogonal to the fake lepton measurement region and to the ISR regions. These changes had negligible impact on the W Z normalization factor extracted derived in the control region. I also estimated the fake lepton background using the fake factor data-driven estimate. The fake background originates from photon conversion, heavy flavor decay, or from jets faking a lepton and cannot be properly estimated using MC. I also measured normalization factor for backgrounds from top quark production and decay. I calculated the fake lepton systematics and theW Z theory systematics. Finally, I worked on the statistical interpretations of the results using theHistFitterpackage [5] producing an exclusion limit, model independent limits, and final yields with full systematics. This work was published as a conference note [6].
use an ISR jet to boost the system, which allows us to use ETmiss triggers. I studied the efficiency of a trigger that has been developed for this search which contains jets, leptons, andEmiss
T as well as differentEmiss
T triggers. I also did other studies related to theZ→τ τ background, acceptances of m`` reweighting of higgsino samples as opposed to using wino-bino samples and truth studies to validate the signal MC. Finally, I worked on theHistFitterimplementation for the statistical interpretations of results. This search led to the first limits set on Higgsino production since LEP. This work can be found in Chapter 10 and in our publication [7].
I have also been involved in developing a signal region optimization for an off-shell wino-bino search decaying to three leptons. I have used many lessons learned from participating in the com-pressed search. The comcom-pressed search makes use of the invariant mass of the two leptons,m``, for higgsino models and the stransverse mass,mT2, for slepton models to perform shape fits, since those models have kinematic edges at their splittings in their respective discriminating variable. I have used the three lepton kinematics in the calculation ofmT2, and this variable has a signal kinematic edge at its mass splitting. This signal region also takes advantage of the kinematic edge in themmin
`` distribution by performing a shape fit. A cut on mmax
`` reduces contamination from on-shellW Z background. The signal region is separated into a jet veto region, which makes use of lepton triggers, and an ISR region, triggered with Emiss
T triggers. I have also added additional variables, mT for the jet veto, and p3`
T Emiss
T for the ISR region to further reject backgrounds. This search is currently on-going but my contribution can be found in Chapter 11.
I have been involved in many areas of ATLAS during my time at the University of Pennsylvania. As we move towards Run 3 and beyond, I would love the opportunity to collaborate on projects that would improve how we use the data we have already collected, have an impact on the data that will be collected, and finally work on testing chips and boards for ITK so that we can continue taking data in the future. If light SUSY particles are accessible at the LHC, we could have the opportunity to not only discover them but be able to measure their properties. Exclusions for light SUSY masses could limit the most appealing solution to the open questions of the Standard Model and the Higgs naturalness problem.
E. D. Resseguie
Introduction
A particle consistent with the Higgs boson hypothesized in the Standard Model was discovered in the first data-taking period (Run 1) of the Large Hadron Collider (LHC). With this discovery, all the particles of the Standard Model have been found and the model can be said to be complete. The Standard Model, described in Chapter 2 has been successful, resulting in theory predictions that have good agreement with experimental observations. Also, improvements in theoretical calculations have resolved tensions between theoretical predictions and observation, as in theW Z cross section measurement, discussed in Chapter 5. However, the Standard Model does not provide a satisfactory explanation for the relatively small Higgs mass (called the Higgs naturalness problem) and does not provide a dark matter candidate. Supersymmetric (SUSY) models have solutions to these and many other problems, and it is crucial to test these theories at the LHC during Run II.
R-parity conserving SUSY is a compelling model of new physics addressing these issues, and dis-covering it or excluding the simplest scenarios is well-motivated. Given the strong LHC constraints on squark and gluino production, electroweak (EWK) production is an interesting mode to search for SUSY. The motivation for EWK SUSY and the SUSY parameter mixing is discussed in Chapter 6. A few searches for EWK SUSY on the ATLAS experiment are discussed, guided by two different simplified models: a bino lightest SUSY particle (LSP) with wino next-to-lightest SUSY particle (NLSP) (motivated by dark matter and discussed in Chapter 7) and Higgsino LSP in Chapter 10 (motivated by naturalness, since the mass parameterµ, governing the mass of Higgsinos, is on the order of the weak scale). Higgsino LSPs result in small (“compressed”) mass splittings between the neutralinos resulting in soft leptons, missing transverse momentum, and a dilepton mass endpoint. Compressed scenarios are also worth pursuing for bino LSP models because these contain unexplored regions of phase space. Also, SUSY particles need to be light to satisfy the dark matter relic density
constraint. These issues are discussed in Chapter 11.
While the two searches discussed above did not observe any excesses above the background prediction, a search using the Recursive Jigsaw Reconstruction (RJR) technique targeting the wino-bino model had excesses with local significances of 2.1 σ and 3.0 σ in two orthogonal regions. A new technique, called emulated RJR (eRJR), explores the intersection between the conventional and RJR approaches to better understand the tension in the exclusion limits produced by the two analyses. It emulates the variables used by the RJR technique with conventional laboratory frame discriminating variables, providing a simple set of variables that are easily reproducible. This technique reproduces the excesses seen by the RJR analysis. The excess is then followed-up using a larger dataset corresponding to 139 fb−1 ofppcollision data collected between 2015 and 2018. The technique and search are described in Chapters 8-9.

![Sketch of the barrel region of the ATLAS inner detector.Figure 1:F i gu r e 3. 8: I n n e r d e t e c t or b ar r e l d e t e c t or s [ 35] .](https://thumb-us.123doks.com/thumbv2/123dok_us/9221640.1457678/74.612.181.467.110.363/sketch-barrel-region-atlas-inner-detector-figure-i.webp)

![Fig. 1 A schematic picture showing a quarter-section of theF i gu r e 3. 13: S c h e ms y s t e mu onat i c of t h e m[ 46] .](https://thumb-us.123doks.com/thumbv2/123dok_us/9221640.1457678/81.612.161.493.137.340/fig-schematic-picture-showing-quarter-section-thef-onat.webp)
![Figure 5.6: Sketch of the original daisy chain signal routing in comparison to the new star design for( r i gh t ) [ 1] .](https://thumb-us.123doks.com/thumbv2/123dok_us/9221640.1457678/91.612.201.481.103.427/figure-sketch-original-daisy-signal-routing-comparison-design.webp)
