The observations of the MIC study has been tabulated in Table 1 and it was found that the minimum inhibitory concentration of the ethanol extract was found to be varying between 10-200 µg/ml, with respect to most of the test bacteria. The MIC of ethanol extract for bacterial strain E. coli K-12 row,
Shigella sonnei-2, Salmonella typhi-59, V. cholera-854, and S. aureous-ML-50 were found to be 100 µg/ ml, for V. cholera-811, MIC was 50 µg/ml and for
S. aureous-2737 and B. licheniformis-10341 were at 10 µg/ml. The result of ZOI of the extract and its comparison with standard antibiotic ciprofloxacin (100 µg/ml and 200 µg/ml) was recorded in Table 2. The antibacterial efficacy of extract of Andrographis paniculata was found to decrease in the following order against different tested bacterial strains-
Salmonella typhi-59, S. aureous-2737, V. alginolyteus,
Sh. Boydii-8, V. cholera-854, E. coli k-12 row, B. licheniformis-10341. From the results of MIC and zone of inhibition values and their competition to that of the standard ciprofloxacin, it evident that the ethanol extract is active against gram positive and gram negative bacteria.
The compounds responsible for this antibacterial activity have not been investigated. However, preliminary phytochemical analysis of the ethanol extract revealed the presence of carbohydrates, tannins, flavonoids and saponins[6,7]. The antibacterial properties
of the plant may be attributed to the individual or combined effect of the above mentioned chemical groups. The findings of the present investigation offer a scientific support to the ethnomedicinal use of the plant by the traditional healers.
ACKNOWLEDGEMENTS
The authors wish to thank Prof. Sujata Ghosh Dastidar of Department of Pharmaceutical Technology, Jadavpur University, Kolkata for supplying bacterial strains used in this investsigation.
REFERENCES
1. The Wealth of India. A dictionary of Indian Raw Material and Industrial Products. 1998. Vol. 11, X-Z and cumulative indexes. New Delhi: National Institute of Science Communication, CSIR; 1998. p.
123-4.
2. Nadkarni KM. Indian Materia Medica revised and enlarged by Nadkarni AK. 2nd ed. Vol. 1. Mumbai: Popular Prakashan Pvt.; 2000. p. 1319.
3. Mukherjee PK. Quality control of herbal drugs. 1st ed. New Delhi:
Business Horizons Pharmaceutical Publishers; 2002. p. 701
4. Kokate CK, Purohit A, Gokhale SB. Pharmacognosy. 8th ed. Pune:
Nirali Prakashan; 2002. p. 106-12.
5. Agarwal VS. Drugs plants of India. Vol. 1. Ludhiana: Kalyani
Publishers; 1997. p. 182-3.
6. Wallis TE, editor. Text book of pharmacognosy. New Delhi: CBS
Publishers and Distributor; 1985. p. 252.
7. Evans WC, editor. Trease and evans pharmacognosy. 12th ed. London:
W.B. Saunders; 1985.
8. Mishra US, Kumari R, Mishra A, Murthy PN, Das P. Antibacterial
activity of Stem Bark of Azadirachta indica. J Teaching Res Chem 2007;14:16-9.
9. Panda BR, Mohanta SR, Mishra US, Kar S, Panda BK, Chakraborty P.
Antibacterial Activity of the leaves of Coccucus hirsutus. Indian Drugs
2007;44:108-10.
10. Mazumder A, Saha BP, Basu SP, Mazumder RM. Antibacterial activity
of methanolic extract of leaves of Lagerstroemia parviflora. Indian J Nat Prod 2004;19:20-3.
Accepted 2 August 2009 Revised 23 March 2009 Received 29 July 2008 Indian J. Pharm. Sci., 2009, 71 (4): 436-438
*Address for correspondence
E-mail: [email protected]
Study of Degradation Profile and Development of
Stability Indicating Methods for Cefixime Trihydrate
S. P. GANDHI AND S. J. RAJPUT*
Pharmaceutical Quality Assurance Laboratory, Pharmacy Department, Faculty of Technology & Engineering, M. S. University of Baroda, Vadodara-390 001, India
The degradation behavior of cefixime trihydrate was investigated under different stress conditions of acidic hydrolysis, alkaline hydrolysis and oxidation using spectrophotometry. Stability indicating spectrophotometric methods were developed that could separate the drug from its degradation products formed under these stress conditions. The UV spectral characteristics of the drug and degraded products were quite different and zero and first order derivative ultraviolet spectrophotometric methods were used to study the extent of degradation. Cefixime trihydrate was found to degrade extensively under experimental conditions. The methods were validated by establishing the linearity, inter and intraday precision, accuracy, selectivity and specificity.
Key words: Stress degradation, cefixime trihydrate, spectrophotometry
The need to develop a stability indicating method using stress degradation has been recommended by International Conference of Harmonization[1].
The stress conditions should include the effect of temperature, humidity, light, oxidizing agents and susceptibility across a wide range of pH values. The aim of the current study was to study the degradation behavior of cefixime trihydrate (CEF) under a few ICH prescribed conditions and to develop validated stability indicating spectrophotometric assay methods.
CEF is an orally active third generation semi synthetic cephalosporin. Chemically, CEF is (6R,7R)-[[(Z)-2-(2-aminothiazol-4-yl)-2-[(carboxymethoxy)imino] acetyl]amino]-3-ethenyl-8-oxo-5-thia-1-azabicyclo [4.2.0]pet-2-ene-2-carboxylic acid trihydrate[2].
CEF is official in USP[2], BP[3] and EP[4]. The three
pharmacopoeia describe ion pair HPLC method for estimation of cefixime from bulk drug and formulation. Only a slight change in the pH of mobile phase was perceived among the three techniques. Literature survey revealed that RP-HPLC method for determination of cefixime in biological fluids[5]
and HPTLC method for determination of cefixime in presence of ceftriaxone and cefotaxime[6] are reported
but these methods could not be used as stability indicating methods.
A Shimadzu 1601 UV/Vis spectrophotometer with matched 1 cm quartz cuvettes was used for the spectral measurements. The UVPC software was used for all the calculations. Silica gel 60F 254 precoated plates from Merck Ltd. were used for TLC studies. Standard bulk drug sample of cefixime trihydrate was provided as gift sample by Dalas Biotech Ltd., Alwar, Delhi. All other reagents used were of AR grade.
Stock solution of CEF (1000 µg/ml) was prepared in methanol. Suitable aliquots ranging from 0.01 to 0.25 ml were taken and diluted to 10 ml with water to give concentration in the range of 1 to 25 µg/ml.
For all degradation studies, CEF at a concentration of 1 mg/ml was used. The degradation was done under strong, moderate as well as mild conditions. The samples were withdrawn initially and then after at regular time intervals. The degradation was checked using TLC. The aliquots withdrawn were suitably diluted with water to get the working solutions for spectrophotometric study.
For acid decomposition, drug solution was exposed to 0.01 M and 0.1 M HCl at 25°, 50° and 80° for up to 12 h. For alkaline decomposition, drug solution was exposed to 0.01 M and 0.1 M NaOH at 25°, 50° and 80° for up to 12 h. For oxidative decomposition, initial studies were performed in 1% H2O2 at 25, 50 and 80° for 8 h. Subsequently the drug was exposed to 3% H2O2 at these temperatures for 2 h.
For analysis of degraded samples, 1 ml of the degraded solution was withdrawn and diluted to 10 ml with water. The initial absorbance of the drug, at zero time was considered as 100% concentration and degradation was correlated with this concentration. To check decomposition, TLC was performed on Silica gel 60F 254 precoated plates using benzene: methanol: glacial acetic acid (1:1:1) as the mobile phase and spots were detected in an iodine chamber.
zero absorbance at 225 nm so this wavelength was used to estimate acid degraded solution and CEF was estimated at 242 nm at which the absorbance was zero for acid treated solution.
Validation of the methods was done by studying various parameters. Linearity was studied by analyzing ten concentrations of the drug prepared in the methanol in the range of 4-24 μg/ml in triplicate and fitting the data into best fitted curve. Precision was verified by repeatability and intermediate precision studies. Repeatability was established by analyzing three different concentrations in triplicate on the same day whereas intermediate precision was checked by repeating the studies on different days. Accuracy of the method was tested by adding three concentrations of standard drug solution sequentially to a mixture of degraded solution and determining the recovery of the added drug. Specificity of the methods towards the drug was studied by analyzing a mixture containing standard drug and the stressed samples.
CEF has a lactam and amide linkage in its molecular structure making it amenable to acidic and basic hydrolysis. The lactam ring in cephalosporins is often opened during hydrolysis and the product formed may undergo side reactions like condensation[7] or
dimerization[8] giving compounds totally different in
their chemical properties. The TLC studies showed that Rf value for the standard drug was 0.48. The HCl and H2O2 treated solutions appeared at 0.68 and 0.70 respectively whereas the NaOH treated solution could not be detected. The spectroscopic studies of the stressed samples of CEF suggested following behavior of the drug under stress conditions.
It was observed that around 25% of CEF was degraded on heating at 80° for 1 h in 0.01 M NaOH. The drug was totally degraded if heated at 80° for 4 h in 0.1 M NaOH (fig. 3). The degradation was somewhat slower in acidic conditions as 25% drug was degraded if heated with 0.01 M HCl at 80° for 2.5 h. The 100% degradation in 0.1 M HCl was observed at 80° after 7 h (fig. 4). The degradation was very rapid under oxidative conditions, as 25% drug was degraded if left at 25° with 1% H2O2 in 3.5 h (fig. 5). Slight heating expedites the degradation procedure and the sample withdrawn just after 10 min of heating at 80° showed total degradation. Total degradation under all these conditions was confirmed by TLC. The analysis of CEF and its degradation products formed under stress conditions was possible using spectrophotometric method.
The spectral characteristics of the drug were totally different from its degradation products so zero order and first derivative UV method could be used to estimate CEF in presence of its degradation
0.500
0.5 / div
0.00 A
200.0 (50 / Div) 300.0 nm
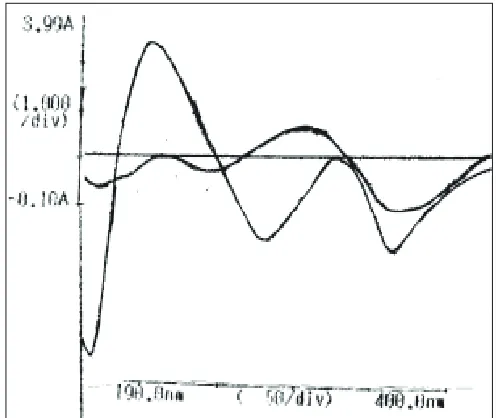
Fig. 1: Overlapped zero order spectra of CEF and its degraded solutions.
(×─×─×) shows the UV spectrum of untreated drug and (▲─▲─▲), (●─●─●) and (■─■─■) show the spectra of acid, alkali and peroxide-treated drug solutions, respectively. The spectra show that alkali and peroxide degraded solutions have no significant absorbance at the analytical wavelength of cefixime. Acid degraded solution interferes with the analysis.
Fig. 2: Overlapped first derivative spectra of cefixime and its acid degraded solution
products. The result of validation studies showed that calibration curve was linear in the range of 4-24 μg/ml. The mean values for slope, intercept and correlation coefficient are reported in Table 1.
The developed methods were found to be precise as indicated by low values (0.44% and 0.83%) for inter and intraday precision respectively. The accuracy was determined by recovery studies of spiked samples. The good recoveries (100±0.45) suggest method to be
TABLE 1: OPTICAL PARAMETERS FOR SPECTROPHOTOMETRIC METHOD
Parameters UV spectroscopy First derivative
spectroscopy
λmax 287 nm 242 nm
Beer’s Range (µg/ml) 4 to 24 4 to 24
Regression Equation Y=0.0408x-0.003 Y=0.0104x+0.0169
LOD (µg/ml) 0.0368 0.227
LOQ (µg/ml) 0.122 0.758
Correlation Coefficient (r2) 0.9999 0.9987
%RSD 0.299 0.597
Accuracy 98-100.4 98-102
Recovery 99.75-100.36 100.5-100.8
The values indicated here are the mean of three values.
Fig. 4: Degradation of cefixime under acidic conditions
(♦─♦─♦) Representsdegradation profile of cefixime in 0.1 N HCl at 25°, (■─■─■) degradation profile of cefixime in 0.1 N HCl at 50° and (▲─▲─▲) degradation profile of cefixime in 0.1 N HCl by reflux 80°
Fig. 5: Degradation of cefixime under oxidative conditions (♦─♦─♦) Represents degradation profile of cefixime in 1% H2O2 25°, (■─■─■) degradation profile of cefixime in 1% H2O2 at 50° and (▲─▲─▲) degradation profile of cefixime in 1% H2O2 by reflux at 80°
accurate. The study showed that CEF is susceptible to hydrolytic and oxidative degradations but the developed spectrophotometric method can be used as a stability indicating method to differentiate the drug from its degraded products. Though no attempts were made to identify and quantify the degraded products, the methods can be successfully used to determine the degradation of drug during storage.
ACKNOWLEDGEMENTS
The authors are thankful to Mr. Ashok Mishra, Dalas Biotech Ltd. for generous gift sample of cefixime trihydrate
bulk drug.
REFERENCES
1. ICH harmonized tripartite guideline, stability testing of new drug
substances and products, Q1A(R2) Feb, 2003. p. 1-15
2. United States Pharmacopoeia, 30th ed, Rockville, MD: USP Convention
Inc; 2007. p. 1654. Fig. 3: Degradation of cefixime under alkaline conditions
Accepted: 05 August 2009 Revised: 24 March 2009 Received: 16 August 2007 Indian J. Pharm. Sci., 2009, 71 (4): 438-442 3. British Pharmacopoeia, British Pharmacopoeia Commission. Vol. 1,
London: Her Majesty’s Stationary Office; 2009. p. 397.
4. European Pharmacopoeia, Council of Europe. 3rd ed, Strasbourg,
France,: EDQM Publications; 2000. p. 504.
5. Nahata MC. Measurement of Cefixime in serum and cerebrospinal fluid by high performance liquid chromatography.J Liq Chromatogr 1991;14:3755-60.
6. Eric-Jovanovic S, Agbaba D, Zivanov-Stakic D, Vladimirov S. HPTLC
Determination of Ceftriaxone, Cefixime and Ceftaxime in dosage forms.
J Pharm Biomed Anal 1998;18:893-7.
7. Baertschi SW, Dorman DE, Occlowitz JL, Spangle LA, Collins MW, Wildfeuer ME et al. Isolation and structure elucidation of a novel
product of acidic degradation of cefaclor. J Pharm Sci 1993;82:622-6. 8. Skibic MJ, Taylor KW, Occlowitz JL, Collins MW, Paschal JW,
Lorenz LJ et al. Aqueous acidic degradation of carbacephalosporin in
loracarbef. J Pharm Sci 1993;82:1010-4.
*Address for correspondence
E-mail: [email protected]
Analgesic and Antiinflammatory activity of
Amukkarac
curanam
A. SARASWATHY*, S. NANDINI DEVI AND R. V. PRADEEP CHANDRAN
Captain Srinivasa Murti Drug Research Institute for Ayurveda (CCRAS), Anna Hospital Campus, Arumbakkam, Chennai-600 106, India
Saraswathy, et al.: Analgesic and Antiinflammatory activity of Amukkarac curanam
Amukkarac curanam a polyherbal Siddha formulation was examined for its analgesic and antiinflammatory activity
at a dose of 500 mg/kg, p.o. The experimental methods used were tail immersion and acetic acid induced writhing method for analgesic and cotton pellet induced granuloma formation for antiinflammatory activity. Pentazocine (10 mg/kg, intraperitoneally) and aspirin (150 mg/kg, orally) clinically used analgesics were used as standard analgesics. Indomethacin (10 mg/kg, orally) was used as standard for antiinflammatory study. Amukkarac curanam showed significant analgesic and antiinflammatory activity in the above study.
Key Words: Amukkarac curanam, Siddha formulation, analgesic and antiinflammatory, pentazocine, indomethacin
Conventional or synthetic drugs used in the treatment of diseases are sometimes inadequate and can have serious adverse effects. There is a world wide trend to search for traditional medicines. Siddha medicare is an ancient system of medicine popular amongst Tamil speaking world practiced for over several thousand years. In the present investigation Amukkarac curanam (AC), a polyherbal formulation[1] consisting
of medicinal plants is taken for study. Its ingredients and formulation composition are tabulated in Table 1. One of the major ingredients is Withania somnifera
reported to possess antistress[2], antiinflammatory[3]
and immunostimulant[4] properties. Other constituents Syzygium aromaticum, cinnamomum wightii, Elettaria cardamomum, Piper nigrum, Piper longum[5], Zingiber officinale are also reported to be medicinally
useful. However scientific data on analgesic and antiinflammatory activity of the formulation is not available. Hence in the present investigation analgesic and antiinflammatory potential of the formulation is explored.
All the ingredients of ammukkarac curanam
were procured from Chennai local market and authenticated at Pharmacognosy department of Captain Srinivasa Murti Drug Research Institute of Ayurveda (CSMDRIA). Voucher sample of all TABLE 1: INGREDIENTS OF amuKKarac curaNam
Botanical name of the drug Part used Quantity (g)
Syzygium aromaticum Linn. Flower buds 1 part
Cinnamomum wightii Meiss. Flower buds 2 part
Elettaria cardamomum Maton. Fruits 4 part
Piper nigrum Linn. Fruits 8 part
Piper longum Linn. Fruits 16 part
Zingiber officinale Rosc. Rhizome 32 part