An Integrated Approach to
Collaborative Supply Chain Design
Ying-Shen Juang1,3 Shui-Shun Lin2 Hsing-Pei Kao1
Yi-Lei Cheng1
1
Institute of Industrial Management National Central University, Taiwan, R.O.C.
2
Department of Business Administration
National Chin-Yi University of Technology, Taiwan, R.O.C.
3
Department of Business Administration Chung-Hua University, Taiwan, R.O.C.
ABSTRACT
As a supply chain initiative, Collaborative Planning, Forecasting, and Replenishment (CPFR) promises greater profits through improved efficiency and increased collaboration between trading partners. Considering supply chain design in the CPFR environment, we propose an integrated framework, which uses stakeholder analysis and integer linear programming for identifying the requirements and attributes of suppliers, and collaboratively achieving optimal supply chain performance. The order fulfillment process is then constructed and simulated. Through the use of a simulation, the supply chain design parameters can be easily monitored and fine-tuned, which eventually ensures an optimal supply chain strategy. The proposed methodology is demonstrated with a practical case.
Key Words: Supply chain design, CPFR, supplier selection, order fulfillment, simulation
1. INTRODUCTION
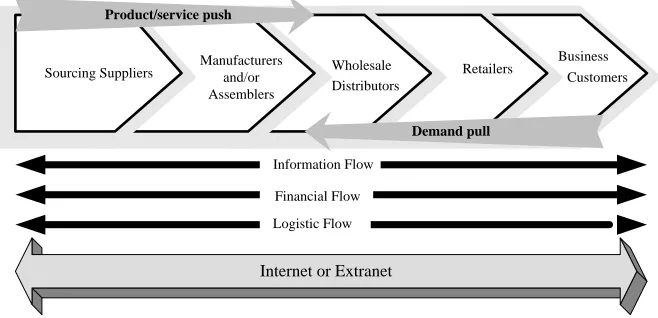
A typical supply chain (Figure 1) has several tiers and types of enterprises that enable the interchange of information, products, and services. In a manufacturing supply chain, there are subcontractors and component suppliers. The components are fabricated and assembled by manufacturers. The manufacturers deliver finished products to wholesale distributors, who in turn make products available to retailers. The retailers then sell products to end consumers. The product flow is assisted by various types of partners: carriers (for flow of products), financiers (for flow of funds), and information technology providers (for flow of information).
Sourcing Suppliers Manufacturersand/or Assemblers
Wholesale Distributors
Retailers Business Customers
Product/service push
Demand pull
Financial Flow
Logistic Flow
Internet or Extranet Information Flow
Figure 1. Typical Supply Chain Partners
In today’s supply chain environment, competition appears not only among companies, but also among supply chains [Vickery et al., 1999]. Companies position themselves as participants in multi-company business processes. Consequently, many companies are currently disassembling their process infrastructures into independent processes and then reassembling them as parts of an e-supply network or collaborative communities [AMR ,1999].
The ability of business to integrate more easily and more often with other businesses for collaboration and cooperation takes the traditional advantages naturally possessed by large-scale companies. A supply chain is typically depicted as linking a set of enterprises through a set of business processes that provide products and services to a business customer. As cost and friction is
diminished from business-to-business (B2B) transactions, companies
business processes with less expensive or higher quantity products/services [Motwani et al., 1991].
Collaborating supply chain processes for competitive advantage in an e-business requires a strategy that goes beyond the enterprise level and has a cross-enterprise perspective. Operations research could be as a decision-making tool for selecting suppliers and provides the optimal for managers [Ghodsypour and O’Brien, 1998]. Contemporary methods and techniques support the supplier decision-maker in dealing with the increased complexity and importance of supply chain design [Choi et al., 1996; de Boer et al., 2001; Humphreys et al., 2003; Brugha and Varvasovszky, 2000]. These developments strongly urge a more systematic and transparent approach to supply chain design. Lau et al. [2004] investigated the entire supply chain under various supply chain scenarios characterized by parameters such as demand variance, lead times, capacity, and order batch size. These benefits, over and above those for planning within the enterprise, are for planning and execution across enterprises with suppliers and customers and for extending the functional scope of supply-chain management as it interfaces with marketing, design, and product-life cycle management [Sodhi, 2001].
The key issues addressed in this study are to efficiently select suppliers and effectively construct the order fulfillment process in a supply chain so that it benefits both the collaboration business partners. Selecting component suppliers to meet production needs and promptly fill a given order plays an important role in today’s fast-changing supply chain. We proposed a decision support framework for the collaborative supply chain based on supplier analysis, mathematical programming, and simulation.
In general, the objectives of this research are: (1) to efficiently develop a conceptual framework for the collaborative supply chain; (2) to interactively implement and optimize the manufacturer-supplier supply chain; and (3) to validate the proposed design framework, using practical cases in a manufacturing company.
Assembling
Supplier
Activity 1 Fulfill Order
Suppliers
Activity 2 Activity 3 Suppliers
Activity 4
Supplier Logistics
Performance Assessment Order R
eple nishmen t DESIGN VALIDATION Retailer Manufacturer Suppliers $$$ Purchasing Delivery Manufacturing Phase II Phase I Phase III SUPPLY-DEMAND ANALYSIS
CPFR E nvironm ent C o ll ab o ra ti o n Outso urcing S ta ke ho ld er A na ly sis
Supplier Select ion Perform ance Sim ulation M ath e m at ic P rog ram m ing Stake holde rs'At tribute s SUPPLY CHAIN DESIGN Object-O riented Produ ct Proc
ess
B
idd
ing
orderpurchase mfgassemble delivery
performance
1
2
3 4
5
10%10%10% 10% 10% 10% 10%
10%10%10%
Analysis Reports
Figure 2. Proposed Framework for Collaborative Supply Chain Design
2. LITERATURE REVIEW
Our review of the literatures covers CPFR and supply chain, stakeholder analysis for supplier attributes, supplier selection and order fulfillment, and simulation in supply chain design.
2.1. CPFR and Supply Chain
In 1986, quick response (QR) was promoted by Voluntary Inter-Industry Commerce Standards (VICS), which is a U.S. industry standardization organization. QR improved demand projection accuracy by sharing point-of-sale (POS) data on clothing items [NTT Communications, 2002]. By 1993, Wal-Mart had already created a structure, efficient consumer response (ECR), to collect information daily at its headquarters and to analyze the data immediately with P&G. In 1995, Wal-Mart and Warner-Lambert developed collaborative forecasting, and replenishment (CFAR) [ECR Europe, 2003]. Existing internet and data warehouse technologies were used to reduce inventory in the supply chain. However, there were still limits, which led to the creation of collaborative planning, forecasting, and replenishment (CPFR) [NTT Communications, 2002].
CPFR is a business process model through which companies can optimize supply chain activities and implementation in B2B. It is unlike any other business transactions over the internet, where business transactions still remain the same way except that they are now executed over the internet. The CPFR revolutionizes the traditional practices of confrontational business and elevates the convention to a brand new stage. However, a CPFR solution must be integrated with the enterprise systems of record that produce and consume demand and supply chain data [VICS, 2006].
In 2004, the VICS CPFR committee developed a major revision of the CPFR model to integrate innovations and to overcome shortcomings identified in the original process. The CPFR reference model provides a general framework for the collaborative aspects of planning, forecasting, and replenishment processes. A newly released CPFR model provides a layered approach, as opposed to a linear approach, to a set of eight collaboration tasks that are easier to understand [VICS, 2006].
Collaboration tasks are corresponding enterprise tasks that personnel in the retailer and manufacturer frequently perform. Unfortunately, no single collaboration process fits all trading partners or all situations between trading partners. Trading partners have different competencies based on their strategies and investments. They also have different sources of information and different views of the market place.
implementing the CPFR, with the consideration of the engineering change control in order to enhance responsiveness to the market change to account for the differences.
The generic form of the operational processes in a supply chain has been characterized as a sequence of “source-assemble-deliver” activities [Sawy, 2001]. There are three levels of analysis: (1) an enterprise-centric view, focusing on the business process within an enterprise; (2) an extended-enterprise view, which includes also the customer’s customer and the supplier’s supplier; and (3) an industry view, focusing on multiple enterprises, product lines, and markets.
Chan et al. [2004] provide the concept of a Central Coordination System (CCS) in a supply chain network. Use of a CCS may prevent an organization from using the role of coordinator to maximize its own benefit. A CCS can collect and send information, schedule collaborating activities, determine demand allocations, monitor performance, and manage changes. It can also classify decision-making and performance data, such as available production quantity and capacities, production lead-time, order status, and order fulfillment accuracy [Chan et al., 2004]. Three major CCS concepts are as follows: (1) CCS is a central coordination for one of the collaborating organizations; (2) CCS is an information database as well as a decision-making tool; and (3) CCS processes order distribution rules of collaborating organizations and provide the optimal solution. For these reasons, CCS was adopted in this study as a trading platform on CPFR to implement bidding action and to fairly select the best-fit suppliers.
2.2. Stakeholder Analysis for Supplier Attributes
In the 1990s, stakeholder theory drew increasing discussion in business and management fields [Brugha and Varvasovszky, 2000]. It focused on the characteristics and behavior of organizations [Donaldson and Preston, 1995]. Freeman and Gilbert [1987] proposed the concept of stakeholder management as a framework to help managers understand the turbulent and complex business environment. Likewise, Grimble and Wellard [1997] emphasized the usefulness of stakeholder analysis in understanding complexity and compatibility problems between business objectives and stakeholders. Although stakeholder analysis is sometimes used as a tool for industry analysis, its true value lies in the evaluation of particular problems for businesses and organizations. In this sense, it is also a tool for evaluating strategies [Recklies, 2001].
Mitchell et al. [1997] listed the main attributes of stakeholders and revealed key constructs of the analysis processes. They also urged managers to be clear about how they want to do business; specifically, what kinds of relationships they want and need to create with their stakeholders to deliver on their purposes [Freeman, 1994].
theory, the focus is on qualitative models and descriptions of stakeholder behavior. Instrumental theory focuses on the impact of stakeholder management on company performance. The normative theory takes the interests of stakeholders into account in the decision-making process. The normative theory of stakeholder analysis, which has the ability to identify the key performance index of business partners, was adapted in this study to identify and describe supplier attributes.
2.3. Supplier Selection and Order Fulfillment
When the concepts of supply chain management emerged, more and more scholars and practitioners realized that supplier selection and management are vehicles to increase the competitiveness of the entire supply chain [Lee et al., 2001]. There are two basic types of problems concerning supplier selection (Ghodsypour and O’Brien, 1998]: (1) problems that arise when there are no constraints; in other words, when all suppliers can satisfy the buyers’ requirements of demand, quality, delivery, etc.; and (2) problems that arise when there are some limitations in supplier ability or capacity, such as quality or quantity.
Ghodsypour and O’Brien [2001] presented a single-objective model. It was developed to minimize the total cost of logistics, including aggregate price, ordering, and inventory costs, subject to constraints of supplier capacity and buyer limitations on budget, quality, and delivery. Talluri and Narasimhan [(2003] proposed a buyer-seller game model that evaluates the efficiency of alternative bids with respect to the ideal target set by buyers. Hammami et al. [2003] defined an order allocation problem as the distribution of activities among partners of a network of firms so as to satisfy customer orders. It differed from a vendor selection problem because of the existence of dependent activities linked by anteriority constraints. The vendor selection method was adapted in this research to model the order allocation problem by adjusting the form of precedence constraints.
product. These intensive studies imply that the supplier selection and order fulfillment process are of importance in designing supply chains.
2.4. Simulation in Supply Chain Design
Simulation is useful in supply chain design and configuration [Persson and Olhager, 2002; Changchien and Shen, 2002; Banerjee et al., 2003; Reiner and Trcka, 2004; Fleisch and Tellkamp, 2005]. Discrete event simulation models can handle stochastic behavior throughout the supply chain and, in doing so, it facilitates evaluation of queuing situations and other phenomena dependent on uncertainty in operation and transportation times.
Persson and Olhager [2002] presented a supply chain simulation study for a real case focusing on the manufacture of mobile communication systems. They evaluated alternative supply chain designs, using quality, lead-times, and costs as the key performance parameters. The design alternatives differ in terms of the level of integration and synchronization between supply chain stages.
Changchien and Shen [2002] conducted a core process analysis matrix and object-oriented simulation. They proposed an integrated business re-engineering framework for improving performance, which included these steps: creating vision, identifying core processes, analyzing current core processes, designing for innovation, evaluating new process, selecting the best, and transforming and implementing the resulting design.
Through a series of simulation experiments under different operating conditions, Banerjee et al. [2003] examined the effects, in terms of some selected criteria, of two lateral trans-shipment approaches in a two-echelon supply chain network, with a single supply source at the higher echelon and multiple retail locations at the lower echelon. An important finding is that either of the proposed lateral shipment approaches is considerably superior to a policy of no such shipments, albeit at the expense of increased transportation activity.
Reiner and Trcka [2004] pointed out that an analysis of a supply chain must be very product- and company-specific. The authors carried out a simulation and suggested an improved model that helps enhance the performance of a specific supply chain in food industry.
3. CONSTRUCTING AN INTEGRATED FRAMEWORK
3.1. General Modeling Procedure
suppliers’ attributes defined from stakeholders will be used to administrate the relationship between suppliers and bids; then, the manufacturer will choose the best-fit suppliers to fulfill the retailer’s order. Integer linear programming is used to solve the supplier selection problem, addressed in the rest of this paper.
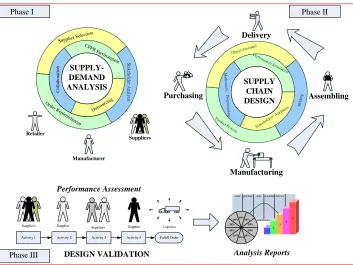
The manufacturer must deliver products to the retailer on the committed due date. Therefore, delivery time is a significance index in finding feasible suppliers. As suppliers are selected, the manufacturer should be also interested in visualizing the fulfillment process in order to control the implementation process. This objective can be met via simulation. Figure 3 shows the analysis methods and procedures for the proposed collaborative framework.
Phase III: Simulate Order Fulfillment Process and Assess Performance
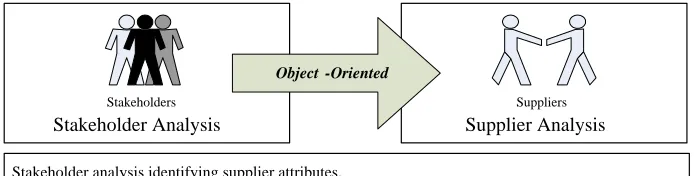
Stakeholder analysis identifying supplier attributes.
Emphasis on supplier capabilities of delivery, quality and cost.
Mathematical programming is utilized, considering minimal supply chain cost. Results are suggested suppliers/venders for manufacturer to select.
According to programming result, process of order fulfillment was simulated with various supplier groups to ensure practically feasible solutions and compare their performance.
Supplier
Activity 1 Fulfill Order
Suppliers
Activity 2 Activity 3 Suppliers
Activity 4
Supplier Logistics
Phase I: Define Supplier Attributes
Supplier Analysis Stakeholder Analysis
Stakeholders Suppliers
Object -Oriented
Phase II: Formulate and Optimize Supplier Selection
Manufacturer
Suppliers /venders
Se lecting
Retailer /customer
CCS/INTERNET
3.2. Object-Oriented Attribute Analysis
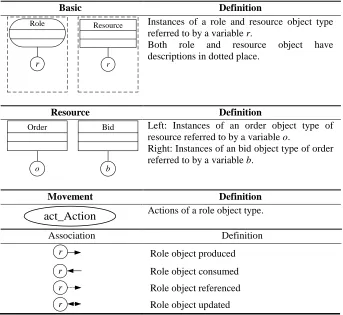
Lin and Lin [2004] proposed object-oriented three-layer conceptual modeling for electronic commerce, which used the state transition diagram (STD) to describe the relationship between roles and activities. The purpose of one of the three layers is to describe the role model that presents capabilities of collaboration/coordination between roles. The object-oriented concept was adopted in this research to describe supplier attributes. We designed four types of symbols; namely, basic, resource, movement, and association (Figure 4).
Basic Definition
Role
r
Resource
r
Instances of a role and resource object type referred to by a variable r.
Both role and resource object have descriptions in dotted place.
Resource Definition
Order
o
Bid
b
Left: Instances of an order object type of resource referred to by a variable o.
Right: Instances of an bid object type of order referred to by a variable b.
Movement Definition
act_Action Actions of a role object type.
Association Definition
r Role object produced
r Role object consumed
r Role object referenced
r Role object updated
Tw
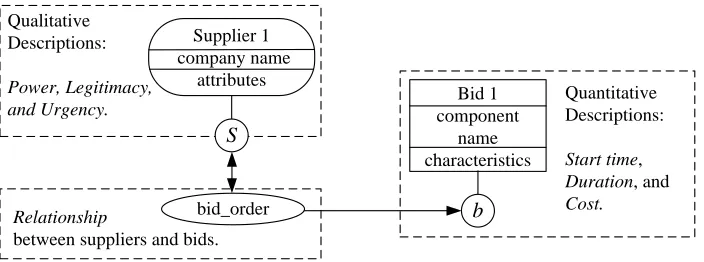
o typical classification methods are used to evaluate supplier conditions: quantitative and qualitative. We synthesized the statement of STD to establish a new set of symbols to illustrate supplier attributes. The basic attributes of each supplier include power, legitimacy, and urgency, which are qualitative in nature. Supplier attributes and order characteristics are shown in Figure 5 and Figure 6.Supplier 1 company name
attributes
S
Bid 1 component
name characteristics
b
bid_order Qualitative
Descriptions:
Power, Legitimacy, and Urgency.
Quantitative Descriptions:
Start time,
Duration, and
Cost. Relationship
between suppliers and bids.
Figure 5. Supplier Attributes and Order Characteristics
Relationship
Qualitative Descriptions:
Company name, , and Profile.
Quantitative Descriptions:
Quantity, Due Date, and Cost.
Retailer 1 company name
profile R
offer_order Order
product name attributes
b
between retailers and orders. Figure 6. Relationships Between Retailer and Order
3.3. Modeling Process and Performance Measurement
A process is defined in an activity decision flow diagram (ADFD). The main ADFD objects in Workflow are: tasks (rounded rectangle); process objects
(rectangle); and external processes (ellipse). These are connected and driven
by decisions (diamond) and phi’s(Φ). The ADFD develops a hierarchical tree
structure for business in different processes and roles.
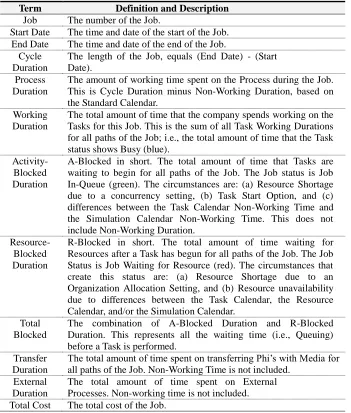
effects of resource allocation on short-term, high loads, or lulls within normal operations. Also, each simulation run will provide a set of results. Analysis of the long-term performance of the process that explored all possible situations is carried out by weighted average analysis. Table 1 defines other basic terms.
Table 1. Simulation Terms and Definitions
Term Definition and Description
Job The number of the Job.
Start Date The time and date of the start of the Job. End Date The time and date of the end of the Job.
Cycle Duration
The length of the Job, equals (End Date) - (Start Date).
Process Duration
The amount of working time spent on the Process during the Job. This is Cycle Duration minus Non-Working Duration, based on the Standard Calendar.
Working Duration
The total amount of time that the company spends working on the Tasks for this Job. This is the sum of all Task Working Durations for all paths of the Job; i.e., the total amount of time that the Task status shows Busy (blue).
Activity- Blocked Duration
A-Blocked in short. The total amount of time that Tasks are waiting to begin for all paths of the Job. The Job status is Job In-Queue (green). The circumstances are: (a) Resource Shortage due to a concurrency setting, (b) Task Start Option, and (c) differences between the Task Calendar Non-Working Time and the Simulation Calendar Non-Working Time. This does not include Non-Working Duration.
Resource- Blocked Duration
R-Blocked in short. The total amount of time waiting for Resources after a Task has begun for all paths of the Job. The Job Status is Job Waiting for Resource (red). The circumstances that create this status are: (a) Resource Shortage due to an Organization Allocation Setting, and (b) Resource unavailability due to differences between the Task Calendar, the Resource Calendar, and/or the Simulation Calendar.
Total Blocked
The combination of A-Blocked Duration and R-Blocked Duration. This represents all the waiting time (i.e., Queuing) before a Task is performed.
Transfer Duration
The total amount of time spent on transferring Phi’s with Media for all paths of the Job. Non-Working Time is not included.
External Duration
F
ive main activities are presented in the product attainment graph:purchase (P), subcontract (SC), manufacture (M), assembler (A), and delivery
(D). When consecutive activities are processed by different partners, a transport activity and a co-ordination activity are generated with the product attainment graph. Each process is handled by individual departments, each of which carries out its tasks and controls the times and costs of the bid.
3.4. Assumptions
The design process was divided into three phases, and assumptions were made for each phase.
The first phase – analysis of supplier attributes – uses the object-oriented method and is focused especially on obtaining qualitative and quantitative models. The supplier delivery time is assessed by integer linear programming. Each order process is composed of cost, start time, and duration. The decision variables are the cost of the selected activity, such as employee training cost, transport cost, and material control cost. The objective is to minimize the order replenishment cost. Specific assumptions are as follows.
1. The suppliers have the ability to supply the required component quality. 2. In order to ensure that enough suppliers participate in the bidding, the list of component suppliers is sufficiently large, and known suppliers are to be selected for the bidding.
3. The mechanism is a closed and unidirectional decision system, meaning that, once the bidding time is reached, no one can enter the system thereafter.
4. The proposed design process and simulation mimic only one assembly manufacturer, which is responsible for being the central coordinator with other suppliers.
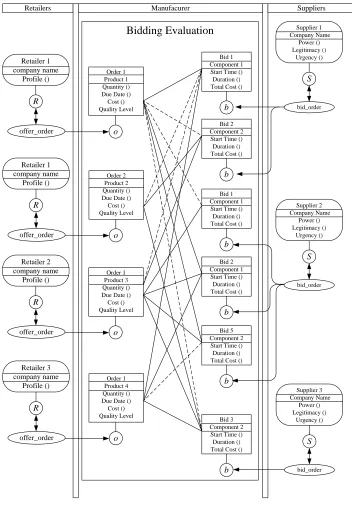
3.5. Phase I: Defining Supplier Attributes
Bidding Evaluation
Retailers Suppliers
Order 1 Product 1 Quantity () Due Date () Cost () Quality Level o Supplier 1 Company Name Power () Legitimacy () Urgency () S bid_order Bid 1 Component 1 Start Time ()
Duration () Total Cost ()
b
Bid 2 Component 2
Start Time () Duration () Total Cost ()
b Supplier 2 Company Name Power () Legitimacy () Urgency () S Bid 1 Component 1 Start Time () Duration () Total Cost ()
b
Bid 2 Component 1
Start Time () Duration () Total Cost ()
b
Bid 5 Component 2
Start Time () Duration () Total Cost ()
b Manufacurer Supplier 3 Company Name Power () Legitimacy () Urgency () S bid_order Bid 3 Component 2 Start Time () Duration () Total Cost ()
b Retailer 1 company name Profile () R offer_order bid_order Order 2 Product 2 Quantity () Due Date () Cost () Quality Level o Retailer 1 company name Profile () R offer_order Order 1 Product 3 Quantity () Due Date () Cost () Quality Level o Retailer 2 company name Profile () R offer_order Order 1 Product 4 Quantity () Due Date () Cost () Quality Level o Retailer 3 company name Profile () R offer_order
3.6. Phase II: Performing Optimal Supplier Selection
In order to optimally select suppliers, suitable integer linear programming was needed to solve the supplier selection problem. The mathematical programming model proposed in Hammami et al. [2003] was found suitable in our framework and was thus adapted in this study. The model focuses primarily on minimizing supplier selecting cost with respect to a given BOM. The decision variables are bit numbers, which offered to carry out components by suppliers. The known parameters are start time, duration, and cost of each component from suppliers, as depicted in the following.
3.6.1. Variables and Notation
When suppliers receive the bidding notice by CCS, they respond according to bidding content:
STrij: start time offered in bid r to carry out component i by supplier j Drij: duration offered in bid r to carry out component i by supplier j Crij: cost offered in bid r to carry out component i by supplier j
r j
rij i
b 1,
(1)
where brijis a binary variable,
brij =1, if bit r offered to carry out component i by partner j is selected; brij =0, otherwise.
The manufacturer should decide the start time, working duration, and its total cost of components. The total cost includes component cost, machining cost, and related overhead.
STi: start time for selected component i Di: duration for selected component i
Other variables are:
DD: due date of the last component
N: number of component
3.6.2.Constraints and Objective Function
Equations 2 and 3 show the first set of constraints. Assume component m
has to carry out after component i. The start time of component i plus the duration of component i is equal or less than the start time of component m. The start time of each component must be equal to the sum of start times offered in bid r to carry out component i by supplier j, activated by multiplying binary variable b.
i
m
D
ST
ST
m
i
i,
,
(2)
r j
rij rij
i ST b i
ST , (3)
Equations 4 and 5 express due date constraints. The start time of the latest component N plus the duration of component N is equal or less than the due date of the last component N. In Equation 5, for the duration of each component i, its duration is the sum of the duration offered in bid r to carry out component i by supplier j, triggered by multiplying binary variable b.
DD
D
ST
N
N
(4)
r j
rij rij
i D b i
D , (5)
Finally, the total cost forms the objective function as shown in Equation 6. The cost includes the direct and indirect cost of the processes, such as cost of component, labor, equipment, and maintenance. The optimization model is shown in the following.
i r j
rij rij
p C b
C
Min.
(6)
s.t.
b ir j
rij
1,i i
m
ST
D
ST
DD
D
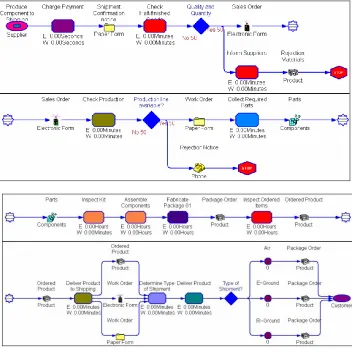
3.7. Phase III: Order Fulfillment and Performance Assessment
The simulation process is based on selected suppliers who deliver components to the manufacturer. The manufacturer fabricates the components and packages the product in the facility until the products are delivered to their customers. Finishing goods inspection, packaging, and shipping are carried out before delivery to the retailers. Three shipping types are simulated: air, express ground, and regular ground.
We tried to fine-tune the parameters of the simulation and to distinguish differences between various settings. The objective is to generate solutions from Phase II and obtain the best design parameters. The simulation analyzed many scenarios and displayed corresponding results in both tables and graphs. Figure 8 illustrates the intact order fulfillment process.
The main process of simulation is divided into two stages. First, processes of produce component, shipping, and shipment confirmation notice are defined in the supplier’s facility. During component production (Drij), suppliers complete
the packaging, as well as any work-in-process (WIP) goods with a shipment confirmation notice to the manufacturer (STrij and Drij). The Charge Payment
task containing the cost of resource is adjusted by the given Cost value (Crij)
from the supplier.
Second, the manufacturer’s inspecting personnel checks the quantity and quantity of WIP (task of Check Processing Goods). If the WIP is approved (definition value is 50%), the inspector updates the sales order in the system; otherwise, he or she informs the supplier while rejecting the batch of WIP. The accepted WIP is subsequently stored in the warehouse. Then, the Check Production task triggers the manufacturing process. If the production line is available at that time, the work order is assigned and produced. Otherwise, the work order process is queued and stopped. Once all components are dispatched, a set of production processes are carried out, which includes the tasks of Inspect Kit, Assemble Components, and Fabricate Package. Following this are assembly of the components, packaging of the finished products, and checking their quality for the final assembly procedures, followed by delivery of the production data with Work Order according to the type of shipment. Finally, shipping personnel follow the shipment type to physically deliver the product to their customers, the retailers. This concludes the order fulfillment process.
4. DESIGN IMPLEMENTATION AND VALIDATION
4.1. Empirical Case for Simulation
JTech, a successful Taiwanese company, is a leading supplier of hinge for 3C products to domestic and foreign companies. As the market continues to grow, the company receives more orders every day. Personnel in the procurement department also face an increasing variety of component suppliers and subcontractors. They need a methodology to efficiently determine their suppliers and fill orders from customers.
4.2. Bidding Procedures and Comparison of Parameters
The manufacturer formulates the product information (from the retailer’s order) and generates detailed order information (to the supplier). Table 2 shows the order details for the final product.
Table 2. Order Details for Final Product
Product Attributes Value
Production Period (days) 12 days Product Quantity (set) 56,000 set
Product Cost (NT$/set) $30
Product Quality Level ISO License
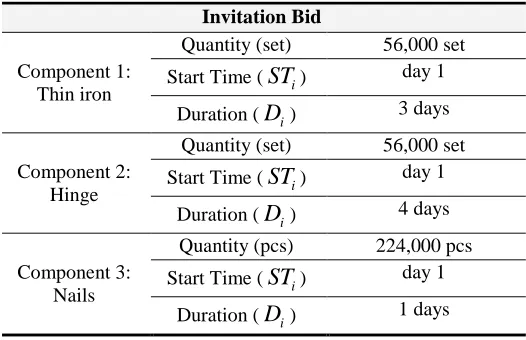
The manufacturer constructs the requirement on CCS thereafter, and uses a planning system, such as ERP, APS, or MRP, to generate the related BOM. There are three components that need to be purchased, and seven component suppliers offer their bids for the order. The bidding system automatically sends the invitation bid to suppliers. Table 3 lists the detailed bidding content.
Table 3. Invitation Bid of Components
Invitation Bid
Component 1: Thin iron
Quantity (set) 56,000 set Start Time (
ST
i) day 1Duration (
D
i) 3 daysComponent 2: Hinge
Quantity (set) 56,000 set Start Time (
ST
i) day 1Duration (
D
i) 4 daysComponent 3: Nails
Quantity (pcs) 224,000 pcs Start Time (
ST
i) day 1Duration (
D
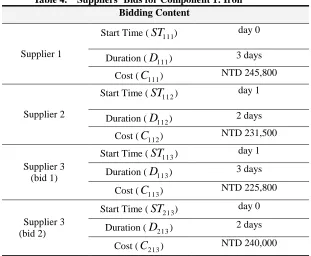
i) 1 daysTable 4. Suppliers’ Bids for Component 1: Iron Bidding Content
Supplier 1
Start Time (
ST
111) day 0 Duration (D
111) 3 daysCost (
C
111) NTD 245,800Supplier 2
Start Time (
ST
112) day 1 Duration (D
112) 2 daysCost (
C
112) NTD 231,500Supplier 3 (bid 1)
Start Time (
ST
113) day 1 Duration (D
113) 3 daysCost (
C
113) NTD 225,800Supplier 3 (bid 2)
Start Time (
ST
213) day 0 Duration (D
213) 2 daysCost (
C
213) NTD 240,000Table 5. Suppliers’ Bids for Component 2: Hinge Bidding Content
Supplier 4 (bid 1)
Start Time (
ST
124) day 0 Duration (D
124) 4 daysCost (
C
124) NTD 280,000Supplier 4 (bid 2)
Start Time (
ST
224) day 0 Duration (D
224) 4 daysCost (
C
224) NTD 265,800Supplier 5
Start Time (
ST
125) day 0 Duration (D
125) 3 daysCost (
C
125) NTD 270,000Supplier 6
Start Time (
ST
126) day 0 Duration (D
126) 3 daysTable 6. Suppliers’ Bids for Component 3: Nail
Supplier 7
Start Time (
ST
137) day 0 Duration (D
137) 1 daysCost (
C
137) NTD 70,0004.3. Programming Results
After activating the bidding process, the system optimizes the bidding results according to the integer linear programming model. The process depicted in Figure 8 was executed on a Pentium IV personal computer with 512MB working memory. Since the simulation generated various reports in the format of graphs and tables, to simplify the illustration, we summarize the major results in Table 7. According to the objective function, b113, b224, and b137 are selected as
suppliers for the three specific components, respectively, and the total cost is NT$561,600. We also qualitatively describe the programming properties. Figure 9 depicts the final bidding result for manufacturer by objects.
Table 7. Programming Results
Component i Bid 1 2 3 4 5 6 7 8 9 10* 11 12 13 14 15 16
i=1
b111 0 0 0 1 0 0 0 1 0 0 0 1 0 0 0 1
b112 0 0 1 0 0 0 1 0 0 0 1 0 0 0 1 0
b113 0 1 0 0 0 1 0 0 0 1 0 0 0 1 0 0
b213 1 0 0 0 1 0 0 0 1 0 0 0 1 0 0 0
i=2
b124 0 0 0 0 0 0 0 0 0 0 0 0 1 1 1 1
b224 0 0 0 0 0 0 0 0 1 1 1 1 0 0 0 0
b125 0 0 0 0 1 1 1 1 0 0 0 0 0 0 0 0
b126 1 1 1 1 0 0 0 0 0 0 0 0 0 0 0 0
i=3 b137 1 1 1 1 1 1 1 1 1 1 1 1 1 1 1 1
Total Cost
(Thousands NT$) 600 586 592 606 580 566 572 586 576 562 568 582 576 576 582 596
* Optimal solution.
o 560,000 set 03 days Order Iron Quantity () Start Time ()
Duration () 01 days assign_bid o 1,120,000 pcs 01 days Order Nails Quantity () Start Time () Duration () 01 days assign_bid o 560,000 set 04 days Order Hinge Quantity () Start Time ()
Duration () 01 days assign_bid seg._order o Retailer 1 company name profile () R offer_order 560,000 set 12 days NTD 30 Order Y200 Quantity () Due Date () Cost () Quality Level assign_order S bid_order Supplier 3 Company Name Power () Legitimacy () Urgency ()
The company is powerful than others. The company is growing up, and trusty. This project must work with this company.
b
Bid 1 Iron Start Time ()
Duration () Total Cost ()
01 days 03 days NTD 225,800 assign_order S bid_order Supplier 4 Company Name Power () Legitimacy () Urgency ()
The company is not powerful than others. The company is growing up, and trusty. This project not must work with this company.
b 01 days 04 days NTD 265,800 Bid 2 Hinge Start Time ()
Duration () Total Cost ()
assign_order S bid_order Supplier 7 Company Name Power () Legitimacy () Urgency ()
The company is normal powerful. The company grow up slowly.
This project must work with this company.
b
Bid 1 Iron Start Time ()
Duration () Total Cost ()
01 days 01 days NTD 70,000
Figure 9. Order Replenishment Objects for Manufacturer
4.4. Performance for Order Fulfillment Process
Table 8. Comparison of Groups
Selection Results Elapsed Duration (day) Facility Cost ($/day) Group 1 [b113, b224, b137] [4,5,2] [100, 120, 60] Group 2 [b113, b125, b137] [4,4,2] [100, 125, 60] Group 3 [b112, b224, b137] [3,5,2] [115, 120, 60]
The initial simulation setup is as follows: (1) external process and task objects of supplier 3, 4, and 7, as shown in Figure 9; (2) Random Number Seed is zero; (3) Maximum Duration is disabled; (4) Calendar is on a 24-hour basis; (5) Total Number of Jobs is 5; (6) Job Creation Rate is constant; and (7) Time Between Jobs is exactly 10 minutes. The Workflow system ran the simulation and recorded the final reports in external files, as shown in tables 9, 10 and 11, for groups 1, 2, and 3, respectively.
As tables 9, 10, and 11 indicate, the average of Cycle Time, Process Duration, Total-Blocked, or External Duration for Group 2 is shorter than that for groups 1 and 3. This is related to the start time (STrij) and duration (Drij) from
the supplier bidding. All groups ensured the duration that the retailer requested. However, Total-Blocked Time for Group 2 is obviously larger than that for the other groups, while the Despite Process Time is shorter; i.e., most jobs are waiting in queue. The total cost for suppliers in Group 1 is the least, which confirms the result obtained from Phase 2.
Table 9. Simulation Result for Group 1
Job Duration Cycle Duration Process Duration Working Blocked Total- Duration Transfer Duration External Total Cost
1 7.24654 5.61462 1.61677 4.12503 1.00000 17.00000 152.30949 2 11.15626 7.46878 1.61677 5.83340 2.00000 16.97917 152.30949 3 12.10765 8.32295 1.61677 6.71049 2.00000 16.95833 152.30949 4 13.05904 9.17712 1.61677 11.50014 2.00000 16.93750 152.30949 5 13.01043 9.03128 1.61677 12.62722 1.00000 16.91667 152.30949
Ave 11.31598 7.92295 1.61677 8.15926 1.60000 16.95833 152.30949
Total 761.54749
Table 10. Simulation Result for Group 2
Job Cycle Duration
Process Duration
Working
Duration Total-Blocked
Transfer Duration
External
Duration Total Cost
1 6.24661 4.61483 1.61677 4.12542 1.00000 15.00000 152.30966 2 8.15633 6.46899 1.61677 5.83361 2.00000 15.00000 152.30966 3 11.10772 7.32316 1.61677 6.71049 2.00000 15.00000 152.30966 4 12.05911 8.17733 1.61677 8.50035 2.00000 15.00000 152.30966 5 12.01050 8.03149 1.61677 12.62722 1.00000 15.00000 152.30966
Ave 9.91605 6.92316 1.61677 7.55938 1.60000 15.00000 152.30966
Table 11. Simulation Result for Group 3
Job Duration Cycle Duration Process Working Duration Total-Blocked Duration Transfer Duration External Total Cost
1 7.24654 5.61462 1.61677 6.12500 1.00000 16.00000 152.31232 2 11.15626 7.46878 1.61677 7.81253 2.00000 15.95833 152.31232 3 12.10765 8.32295 1.61677 8.66879 2.00000 15.91667 152.31232 4 13.05904 9.17712 1.61677 13.43760 2.00000 15.87500 152.31232 5 13.01043 9.03128 1.61677 14.54385 1.00000 15.83333 152.31232
Ave 11.31598 7.92295 1.61677 10.11756 1.60000 15.91667 152.31232
Total 761.56160
4.5. Shipment Configuration
The shipment type for delivering products to the retailer was further determined: air, express ground, or regular ground. These served as the final order fulfillment process for the supply chain. Table 12 lists the simulation options and settings. The probabilities of the three shipment types are simulated as: air, 40%; express ground,30%; and regular ground,30%. These data reflect the practical combination, based on the company’s overall shipping situation.
Table 12. Shipment Options and Settings
Shipment Process Quality and Quantity Available?
Production Line Available?
Type of Shipment?
Option 1: Air Yes Yes Air
Option 2: Express Ground Yes Yes Ground
Option 3: Regular Ground Yes Yes Ground
Table 13 illustrates the simulation results of the order fulfillment process. By employing the weighted average calculation in the simulation, we can compute the percentage of each shipment as 40.91, 31.82, and 27.27, respectively. The process time, as well as the cycle time, for each shipment can be obtained
.
Table 13. Result of Order Fulfillment Process: Shipment Selection
Shipment Process Percent Process Time
External Time
Transfer Time
Wait Time
Working Time
Cycle Time
Option 1: Air 40.91 32.25h 5.00h 8.00h 6.33h 12.92h 48.25h Option 2: Express Ground 31.82 40.25h 5.00h 16.00h 6.33h 12.92h 118.30h Option 3: Regular Ground 27.27 64.25h 5.00h 40.00h 6.33h 12.92h 144.25h
5. CONCLUSIONS
Developing an efficient supply chain is a prevalent trend in today’s industry. The CPFR is one of the standards for collaborative business activities. Retailers and manufacturers need to collaboratively generate a joint business plan for better forecasting of products sales and for adequately configuring a collaboration strategy. Efficiently and effectively managing the component suppliers and fair selection of the best-fit suppliers are of importance in supply chain operation. When the suppliers replenish components by the projected date, cost is one major concern for accomplishing this process.
In this study, we investigated efficient supply chain design with a focus on supplier selection and order fulfillment in the CPFR environment, using attribute analysis, mathematical programming, and simulation. We defined all suppliers’ attributes and displayed the relationship with objects by stakeholder analysis. In order to maintain impartiality, we established a central coordination and bidding system as an unbiased arbitrator. The supplier selection was introduced and formulated by linear programming. It systematically presented supplier attributes and optimally located suppliers, thus facilitating the supplier selection decision, as well as collaboratively minimizing the order fulfillment cost.
By analyzing the simulation result, supply chain partners can easily monitor process changes, fine-tune design parameters, and eventually achieve an optimal supply chain strategy. The integrated framework we proposed was validated by a practical supply chain partner of notebook computer production. In general, the company saved one-third of its effort, including time and money, in selecting suppliers and filling retailers’ orders.
There are many issues, however, to be addressed in future studies; namely: 1. Many other qualitative attributes appear in stakeholder analysis, such
as the ability to maintain customer relationships, are further transferred to quantitative evaluations.
2. When considering more variables and/or when the mathematical programming became non-linear, the solution process needed to be altered. A suitable solution process will be investigated to solve the mathematical model efficiently.
REFERENCES
American Manufacturing Research Inc. 1999. How can we collaborate? Let me count the ways, SCM Report.
Banerjee, A.; J. Burton,, and S. Banerjee. 2003. A simulation study of lateral shipments in single supplier, multiple buyers supply chain networks, International Journal of Production Economics 81-82, 103-114.
Brugha, R., and Z. Varvasovszky. 2000. Stakeholder analysis: a review, Health Policy and Planning 15, 239-246.
Chan. T.S.F., S.H. Chung, and S. Wadhwa. 2004. A heuristic methodology for order distribution in a demand driven collaborative supply chain, International Journal of Production Research 42(1), 1-19.
Changchien, S.W., and H.-Y Shen. 2002. Supply chain reengineering using a core process analysis matrix and object-oriented simulation, Information and Management 39, 345-358.
Choi, Y.T., and J.L. Hartley. 1996. An exploration of supplier selection practices across the supply chain, Journal of Operations Management 14, 333-343.
Chung, W.W.C., and S.W.F. Leung. 2005. Collaborative planning, forecasting, and replenishment: a case study in copper clad laminate industry, Production Planning & Control 16(6), 563-574.
de Boer, L., E. Labro, and P. Morlacchi. 2001. A review of methods supporting supplier selection, European Journal of Purchasing & Supply Management 7, 75-89.
Donaldson, T., and L.E. Preston. 1995. The stakeholder theory of the corporation: concepts, evidence, and implications, Academy of Management Review 20, 65-91. ECR Europe. 2003. A guide to CPFR® implementation, 3rd Ed., VICS CPFR Documents. Fleisch, E., and C. Tellkamp. 2005. Inventory inaccuracy and supply chain performance: A simulation study of a retail supply chain, International Journal of Production Economics 95, 373-385.
Freeman, R.E. 1994. The politics of stakeholder theory: Some future directions. Business Ethics Quarterly, 4(4), 409-421.
Freeman, R.E., and D. Gilbert Jr. 1987. Managing stakeholder relations. In Prakash, S., and C. Falbe (eds.), Business and Society: Dimensions of Conflict and Cooperation. Toronto: Lexington Books, 397-422.
Freeman, R.E., and J. Liedtka. 1997. Stakeholder capitalism and the value chain, European Management Journal 15(3), 286-296.
Ghodsypour, S.H., and C. O’Brien. 1998. A decision support system for supplier selection using an integrated analytic hierarchy process and linear programming, International Journal of Production Economics 56-57, 199-212.
Ghodsypour, S.H., and C. O'Brien. 2001. The total cost of logistics in supplier selection, under conditions of multiple sourcing, multiple criteria and capacity constraint, International Journal of Production Economics 73, 15-27.
Grimble, R., and K. Wellard. 1997. Stakeholder methodologies in natural resource management: A review of principles, contexts, experiences and opportunities, Agricultural Systems 55, 2, 173-193.
Hong, Y., Z.-X Yu, and T.C.E. Cheng. 2003. A strategic model for supply chain design with logical constraints: formulation and solution, Computers & Operations Research 30, 2135-2155.
Humphreys, P.K., Y.K. Wong, and F.T.S. Chan. 2003. Integrating environmental criteria into supplier selection process, Journal of Materials Processing Technology 138, 349-356.
Kochan, A.T., and S.A. Rubinstein. 2000. Toward a stakeholder theory of the firm: the Saturn partnership, Organization Science 11, 4.
Lau, S.K.J., G.Q. Huang, and K.L. Mak. 2004. Impact of information sharing on inventory replenishment in divergent supply chains, International Journal of Production Research 42(5), 919-941.
Lee, E.K., S. Ha, and S.K. Kim. 2001. Supplier selection and management system considering relationships in supply chain management, IEEE Transactions on Engineering Management 48(3), 307-318.
Lee, L.H., E.P. Chew, and T.S. Ng. 2005. Production planning with approved vendor matrices for a hard-disk drive manufacturer, European Journal of Operational Research 162, 310-324.
Lin, J., and T-E. Lin. 2004. Object-oriented conceptual modeling for commitment-based collaboration management in virtual enterprises, Information and Software Technology 46, 209-217.
Mitchell, K.R., B.R. Agle, and D.J. Wood. 1997. Toward a theory of stakeholder identification and salience, Academy of Management 22(4), 853-886.
Motwani, J., M. Youssef, Y. Kathawala, and E. Futch. 1991. Supplier selection in developing countries: a model development, Integrated Manufacturing System 10(3), 154-161.
NTT Communication Corporation. 2002. Collaboration between advanced companies, Global Professional Services Group, 12.
Persson, F., and J. Olhage. 2002. Performance simulation of supply chain designs. International Journal of Production Economics 77, 231-245.
Recklies, D. 2001. The Value Chain, Recklies Management Project Report, downloadable from website http://www.themanager.org.
Reiner, G., and M. Trcka. 2004. Customized supply chain design: Problems and alternatives for a production company in the food industry - A simulation based analysis, International Journal of Production Economics 89, 217-229.
Sawy, E.O.A. 2001. Redesigning Enterprise Process for e-Business, New York: McGraw Hill.
Sodhi, S.M. 2001. Applications and opportunities for operations research in internet-enabled supply chains and electronic marketplaces, Interfaces 31(2), 56-69. Talluri, S., and R. Narasimhan. 2003. Vendor evaluation with performance variability: A
max-min approach. European Journal of Operational Research 146, 543-552.
Vickery, S., R. Calantone, and C. Droge. 1999. Supplier chain flexibility: An empirical study, Journal of Supply Chain Management 35(3), 16-24.
Voluntary Interindustry Commerce Standards (VICS). Collaborative planning, forecasting, and replenishment (CPFR®): an overview, Available online at: www.cpfr.org (accessed 18 May 2006).
150-156.
ABOUT THE AUTHORS
Ying-Shen Juang is lecturer at the Department of Business Administration of Chung-Hua University, Taiwan. She received her Master of Business Administration degree from Edgewood College, Wisconsin, and is currently pursuing her Ph.D. at the Institute of Industrial Management, National Central University, Taiwan. Her research interests include supply chain management and customer relationship management. Shui-Shun Lin is associate professor at the Department of Business Administration of National Chin-Yi University of Technology, Taiwan. He received his Master of Science degree from the University of Wisconsin-Madison, and his Ph.D. in industrial engineering from Florida State University, USA. His current research interests include electronic commerce and decision support systems.
Hsing-Pei Kao is professor at the Institute of Industrial Management of National Central University, Taiwan. He received his Master of Science degree from Purdue University, and his Ph.D. in industrial engineering from Clemson University, USA. His current research interests include supply chain management, business process management, and concurrent engineering.