Bawankar R. D. et al., J. Sci. Res. Phar. 2014, 3(3), 86-95
J
ournal of
S
cientific
R
esearch in
P
harmacy
Research Article
Available online through
ISSN: 2277-9469
www.jsrponl
ine.com
Formulation, Characterization and Evaluation of Extended release Solid Dispersion of a Poorly Water
Soluble drug
Bawankar R. D. *1, Dewani S. P.2, Yeole P. G.3
1Assistant Professor, Dept. of Pharmaceutics, Agnihotri College of Pharmacy, Bapuji Wadi, Ramnagar, Wardha– 442001, (M.S.)
2Assistant Professor, Dept. of Pharmaceutics, Institute of Pharmaceutical Education and Research, Borgaon (Meghe), Wardha– 442001, (M.S.)
3Principal, Institute of Pharmaceutical Education and Research, Borgaon (Meghe), Wardha– 442001, (M.S.)
Received on: 22-08-2014; Revised and Accepted on: 21-09-2014
ABSTRACT
Present investigation studied extended release tablets of a poorly water soluble Indomethacin (Indo) prepared by solid dispersion (SD)
technique using Eudragit®RL100, Eudragit®RS100 by dissolving (ED) and co-precipitation (EC) method; Ethocel Std 10p, Methocel F50 bydissolving (CD) and suspending (CS) method at different proportions (drug:carriers-1:1:1, 1:2:1, 1:1:2 %w/w). All proportions were subjected for
in-vitro release behaviour (SGF, PH 1.2 for 2 Hrs and SIF, PH 6.8 for 10 Hrs) of ED1 and EC1 of Eudragits®; CD1 and CS1 cellulose containing dispersions showing maximum and more sustenance Indo release 86.16±0.71%, 85.41±0.72%, 92.05±0.26% and 88.76±0.82% respectively for 12 hrs than others rendering its selection for optimization and were further analyzed and characterized for FT-IR, Differential Scanning Calorimetry, X-ray diffraction and Scanning Electron Microscopy. Carbonyl stretching of acetic acid group as well as aromatic C=C stretching to slight higher
frequency 0.44 % cm-1 and 1.13 % cm-1 (increase); C-H deformation as well as C-O stretch plus O-H deformation to slight lower frequency 1.05 %
cm-1 and 0.82 (decrease) of optimized (1:1:1) SD shown in FT-IR spectra, Lowering of Tm and enthalpy change of 4.23 % to 7.34 % (loss) in optimized SDs shown by DSC, Retention of peaks with lesser intensity in ED1, EC1, CD1, CS1 than EM and CM revealed crystalline as well as non crystalline (amorphous) nature in X-RD, and entrapment of Indomethacin crystals in 1:1:1 % w/w of ED1, EC1, CD1, CS1 shown in SEM photographs, reflecting possible evidence for the formation of solid dispersion of Indomethacin. Optimized SDs further used to prepare extended release tablets (TED1, TEC1, TCD1 and TCS1) by direct compression technique. Prepared tablets were evaluated for its various determinants as described
in Indian Pharmacopoeia. TED1, TEC1, TCD1 and TCS1 were subjected for release inSGF (PH 1.2 for 2 Hrs) and SIF (PH 6.8 for 10 Hrs) replicating
sustenance Indo release as found in solid dispersions and following release kinetics by Higuchi Plot with r2 values ranging from 0.9458 to 0.9605. Stability studies of optimized solid dispersion for the three months showed no significant changes in physical characteristics and in-vitro release.
Keywords: Solid dispersion, Indomethacin, Eudragit®RL100, Eudragit®RS100,Ethocel Std 10p, Methocel F50, Co-precipitation, FT-IR., In-vitro release study, DSC, XRD, SEM.
INTRODUCTION
T
he enhancement of oral bioavailability of poorly water soluble drugs remains one of the most challenging aspects of drug development. In 1961, Sekiguchi and Obi [1] developed a method whereby many of the limitations with the bioavailability enhancement of poorly water soluble drugs can be overcome. This method, which was later termed as solid dispersion [2], involved the formation of eutectic mixtures of drugs with water soluble carriers by the melting of their physical mixtures. The term ‘solid dispersion’ refers to ‘The dispersion of one or more active ingredients in an inert carrier or matrix at solid state prepared by the melting (fusion), solvent or melting solvent method” [2, 3]. Goldberg et al suggested that the drug was present in a microcrystalline state in the eutectic mixture [4, 5]. Thus, once the solid dispersion is exposed to the aqueous medium, the carrier dissolves and the drug is released as very fine colloidal particles. Because of greatly enhanced surface area obtained in this way, both the dissolution rate and the bioavailability of poorly water soluble drugs are expected to be high [4, 5]. Numerous papers on various aspects of solid dispersion were published since 1961; Chiou and Riegelman [2], Ford [6] and recently vasconcelos [7] reviewed the early research in this area.Extended release has been constantly used to describe a Pharmaceutical dosage form formulated to retard release of a therapeutic agent. The extended release system are the methods
*Corresponding author:
Ram D. BawankarJanai Villa, Ward No. 4, Ganesh Nagar,
Borgaon (Meghe), Wardha – 442001 (M.S.), India. Tel: 7152-231350, 09960820852.
*E-Mail: [email protected]
that can achieve therapeutically effective concentrations of drugs in a systemic circulation for a prolong period of time [8-11].
Solid dispersion systems have being considered over last 35 years as a means of increasing the solubility, dissolution and absorption of poorly water soluble drugs. Till date, numerous literature [12-17] repleting enhancement of solubility and dissolution rate of poorly water soluble Indo by one or more process/methods of SD using hydrophilic and hydrophobic carriers/polymers.
Keeping in mind all such few and rare Indo SD, it was decided to increase the solubility and control release rate of Indo by solid dispersion technique using various hydrophilic polymers (namely Methocel F50, Eudragit® RL100) and hydrophobic polymers (namely Ethocel Std 10p, Eudragit® RS100) to increase its bioavailability and to prepare its extended release tablets to reduce dose and dosing frequency and increase patient compliance.
Indomethacin [18] – BCS class II drug, is most frequently used over-the-counter NSAIDs, due to its proven efficacy and low cost, bearing a very short Plasma half life 2.4 Hr. Chemically, Indomethacin (Fig. 1) is 1-(P-chlorobenzoyl)-5- methoxy-2-methylindole-3-acetic acid.
N
O C C l
C H
3
C H
2C O O H
C H
3O
Bawankar R. D. et al., J. Sci. Res. Phar. 2014, 3(3), 86-95
MATERIALS AND METHODS
Materials:
Indomethacin as a gift sample was kindly supplied by Ajanta Pharma Limited, Paithan (India). Eudragit RS 100, Eudragit RL 100 and Ethocel Std 10p Premium (Ethocel Std 10p) were supplied by Degussa, Rohm Pharma, Mumbai (India) and Colorcon Ltd., UK respectively. All other chemicals and reagents used were of analytical grade and were procured.
Preparation of solid dispersion
Solid dispersion prepared using Eudragit RS100 & RL100
a)By dissolving method: [19, 20]
Indomethacin, Eudragit RS 100 and Eudragit RL 100 were weighed in different ratio as shown in Table 1 and dissolved in sufficient quantity of ethanol. The organic solvent was evaporated under reduced pressure using rotary evaporator at 400C. The dried dispersions were passed through sieve no.100. The prepared dispersions were stored in glass vials and used for further studies.
b) By co-precipitation method: [21, 22]
Indomethacin, Eudragit RS 100 and Eudragit RL 100 were weighed in different ratio as shown in Table 1 and dissolved in sufficient quantity of ethanol. To it sufficient quantity of distilled water of pH 1.2 cooled at 40C was added dropwise with continuous stirring. Then above suspension was filtered through Whatman filter paper No.42. The dried co-precipitate was passed through sieve no.100. The prepared dispersions were stored in glass vials and used for further studies.
Solid dispersion prepared using Ethocel Std 10p and Methocel F50:-
a)By dissolving method: [23, 24]
Indomethacin, Ethocel Std 10p and Methocel F50 were weighed in different ratio as shown in Table 1 and dissolved in sufficient quantity of ethanol. The organic solvent was evaporated under reduced pressure using rotary evaporator at 400C. The dried dispersions were passed through sieve no.100. The prepared dispersions were stored in glass vials and used for further studies.
b) By suspending method:[25, 26]
Indomethacin and Ethocel Std 10p were weighed in different ratio as shown in Table 1 and dissolved in sufficient quantity of chloroform, followed by the addition of weighed quantity of Methocel F50. Here Methocel F50 was suspended in solution. The organic solvent was evaporated under reduced pressure using rotary evaporator at 400C. The dried dispersions were passed through sieve no.100. The prepared dispersions were stored in glass vials and used for further studies.
Preparation of physical mixtures: [27, 28]
Physical miture (EM) of Indomethacin, Eudragit RS 100, and Eudragit RL 100 was prepared by weighing the various components as given in Table 1 and thorough mixing in mortar and pestle. Same procedure was repeated for Physical mixture (CM) of Indomethacin, Ethocel Std 10p and Methocel F50.
Table No. 1:Comparativecomposition of solid dispersions
Sr. No. Solid dispersion
Code Composition Code
1 ED1 Indomethacin:Eudragit RS100: EudragitRL100 1:1:1
2 ED2 Indomethacin: Eudragit RS100: EudragitRL100 1:2:1
3 ED3 Indomethacin: Eudragit RS100: EudragitRL100 1:1:2
4 EC1 Indomethacin: Eudragit RS100: EudragitRL100 1:1:1
5 EC2 Indomethacin: Eudragit RS100: EudragitRL100 1:2:1
6 EC3 Indomethacin: Eudragit RS100: EudragitRL100 1:1:2
7 CD1 Indomethacin: Ethocel Std 10p: Methocel F50 1:1:1
8 CD2 Indomethacin: Ethocel Std 10p: Methocel F50 1:2:1
9 CD3 Indomethacin: Ethocel Std 10p: Methocel F50 1:1:2
10 CS1 Indomethacin: Ethocel Std 10p: Methocel F50 1:1:1
11 CS2 Indomethacin: Ethocel Std 10p: Methocel F50 1:2:1
12 CS3 Indomethacin: Ethocel Std 10p: Methocel F50 1:1:2
13 EM Physical mixture of Indomethacin with Eudragit® RL100 and Eudragit® RS100 ---
14 CM Physical mixture of Indomethacin with Ethocel Std 10p and Methocel F50 ---
Characterization and evaluation of solid dispersion:
Fourier Transform Infrared Spectroscopy (FT-IR):
Fourier Transform Infrared Spectroscopy (FT-IR) is a rapid analytical technique that measures vibrations of bonds within functional groups. FT-IR spectral studies were carried out using an FTIR spectrometer (Perkin Elmer Spectrum 2000, Norwalk, CT). FT-IR of Indomethacin, EM, CM and their solid dispersions ED1-ED3, EC1-EC3, CD1-CD3 and CS1-CS3 were taken to ascertain for any interaction between the drug and the polymers used to confirm the encapsulation of the drug with in polymer matrix. Each sample were smeared onto KBr windows with pressure - 6-8 tons, die size – 13 mm and the spectra were recorded from 500 to 4000/cm.
Drug content:
The percent drug content of each solid dispersion was determined. The powder (equivalent to 40 mg of Indomethacin prepared solid dispersion) was dissolved in 20 ml of alcohol using the magnetic stirrer for 20 min. To the solution obtained simulated intestinal fluid was added and volume was made upto 100 ml. It was then filtered through Whatman filter paper no. 42 and required dilutions were made and absorbance was taken at 265 nm.
In-Vitro Indomethacin Release Study: [29, 30]
The % cumulative Indomethacin release from prepared solid dispersions were studied in 900 ml Simulated Gastric fluid (SGF), PH 1.2 without pepsin for first 2 Hrs and subsequent 10 Hrs in Simulated Intestinal fluid (SIF), PH 6.8 Phosphate buffer, stirred at 50 rpm, 37ºC ± 0.5ºC by USP - II (Rotating Paddle type) method, VIII stations Dissolution Test Apparatus, Electrolab, Mumbai. Scanning of Indomethacin was carried out in both SGF and SIF between
200-400 nm and λmax was reported to be at 261.4 nm and 265 nm respectively. Absorbance of standard calibration curve of Indomethacin in SGF and SIF were analyzed, after adequate dilutions, at λmax 261.4 nm and 265 nm on UV Spectrophotometer (UV-1700; Pharmaspec, Shimadzu, Japan) equipped with UV probe software (2.01 version). Data was depicted in Microsoft excel and had correlation coefficient (R2)0.9997, 0.9998 and equation of regression lines Y = 0.0545X - 0.002 and Y = 0.0505X - 0.0038 respectively.
Differential Scanning Calorimetry (DSC):
5-10 mg of Indomethacin sample, EM, CM and their solid dispersions ED1, EC1, CD1 and CS1 were weighed into pin holed platinum pans (TG/DTA instruments) and heated under dry nitrogen in 0 - 3400C scanning range at a rate of 100C/min. An empty pan was used as reference. Experiments were carried out in duplicate.
X-Ray Diffraction:
X-ray diffraction of Indomethacin, EM, CM and their solid dispersions ED1, EC1, CD1 and CS1 were carried out on a Rigaku Rotating Anode Diffractometer RUH3R (Tokyo, Japan). Measurement conditions were 40 kV voltage, 30 mA current, at a scanning speed of 20/min, step size 0.02 and scanning range from 10–800 2Theta. Experiments were carried out in duplicate.
Scanning Electron Microscopy:
Bawankar R. D. et al., J. Sci. Res. Phar. 2014, 3(3), 86-95
electron microscope stubs with double-sided carbon tape and observed under 370701-14, S-3700, Scanning Electron Microscope.
Micromeritic evaluation:
Micromeritic evaluation for Indomethacin, Eudragit® RS 100, and Eudragit® RL 100, Ethocel Std 10p, Methocel F50 and Optimized solid dispersions obtained from individual methodologies were characterized with respect to bulk density, tapped density, compressibility index and Hausner ratio.
Formulation of 700mg extended release Indomethacin tablet: After selection of optimized solid dispersion, it was further used to prepare extended release tablets by direct compression technique as shown in Table 2. All the ingredients were passed through sieve no - 100. All the ingredients except magnesium stearate were blended in glass mortar uniformly. After sufficient mixing of drug as well as other components, magnesium stearate was added and further mixed for additional 2-3 minutes. The tablets were compressed using 12 mm concave faced punch in single stroke punching machine.
Table No. 2: Composition for formulations of extended release Indomethacin tablets
Ingredients (mg) Tablet Code
TED1 TEC1 TCD1 TCS1
Solid Dispersion equivalent to 75 mg of Indomethacin 225 225 225 225
Avicel PH 102 369 369 369 369
Magnesium stearate 6 6 6 6
Total 700 700 700 700
(T indicates tablet code, remaining indicate design of solid dispersion code)
Evaluation of extended release Indomethacin tablet 1. Uniformity of weight
Twenty tablets were randomly selected from each batch and individually weighed .The average weight and percentage deviation of twenty tablets were calculated. The batch passes the test for weight variation and meets the USP test if no more than 2 tablets are the percentage limit and if no tablet differs by more than 2 times the percentage limit.
2. Hardness:
Hardness was measured using Pfizer hardness tester. For each batch three tablets were tested.
3. Friability:
Mass of tablets equal to 6.5 g was taken for tablets having weight less than 650 mg and for tablets of weight more than 650 mg a sample of 10 whole tablets was taken and placed in a Roche friabilator and rotated for 100 times at 25 rpm and tablets were removed de-dusted and weighed again. The % friability was measured using the formula % F = {1- (W / Wo)} x 100.
4. Thickness:
Three samples were selected randomly from each batch and thickness was measured using Vernier calliper.
5. Drug content:
Ten tablets were finely powdered; quantities of the powder equivalent to 40 mg of Indomethacin was taken and to it 20 ml alcohol was added and placed over magnetic stirrer for 20 min, the flask was then filled with 6.8 pH phosphate buffer solution and mixed thoroughly. The solution was made up to volume and filtered through Whatman filter paper No.42 and required dilutions were made and measure the absorbance of the resulting solution at the maximum at 265nm using a UV/Visible double beam spectrophotometer. The linearity equation obtained from calibration curve as described previously was used for estimation of Indomethacin in the tablets formulations.
In-Vitro dissolution of Indomethacin extended release tablet and interpretation of release kinetics: [29, 30]
Dissolution was carried out using USP apparatus II taking 900 ml of simulated gastric fluid (without pepsin) pH 1.2 for first two hours followed by simulated intestinal fluid (without pancreatin) pH 6.8 for rest ten hours. The rotational speed of the paddle was set at 50 rpm. Five ml of aliquots was withdrawn at predetermined time interval for 12 hours and was being replaced by same volume of fresh medium. The sample were analyzed for drug content using double beam UV spectrophotometer at 261.40 nm and 265 nm against blank using SGF and SIF respectively. The dissolution was carried out in triplicate for each formulated batch. The cumulative % drug release was calculated using the equation generated from the standard calibration curve. For finding out the mechanism of drug release from combination of hydrophilic and
hydrophobic polymer from Indomethacin extended release tablets, the dissolution data obtained from the above experiments was treated with the different release kinetic equations as given in Table 3.
Table No. 3: Mathematical models used to describe drug dissolution curves
Sr. No. Models Equation
1 Zero Order release equation
Qt = Q0 + K0 t
2 First Order release equation
ln Qt = ln Q0 + K1 t
3 Higuchi plot
equation
Qt =KH t1/2
4 Hixson – Crowell
equation
Q01/3 - Qt1/3 = Ks t
5 Korsmeyer- Peppas
equation
Log (M t / M f) = Log k + n Log t
Stability studies:
The optimized tablet batch were selected and wrapped in aluminum foil of thickness 0.04 mm and stored at stored at 40± 20C temperature with relative humidity of 75±5%. The sampling was done after every one month and evaluation was done for appearance, thickness, hardness, friability, drug content and cumulative % drug release.
Statistical analysis:
The t-test was performed on all collected mean data obtained from physiological evaluation as well as dissolution studies. Significance was accepted at p≤0.05 [31].
RESULTS AND DISCUSSION
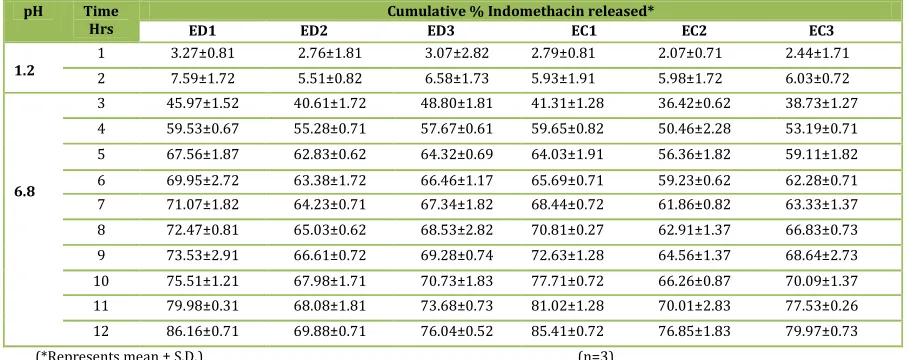
Drug content and In vitro dissolution profile of Indomethacin: Drug content in various SD (Table 4) prepared using Eudragit®RL100, Eudragit®RS100 (namely ED1 – ED3, EC1-EC3) as well as Ethocel Std 10p, Methocel F50 (CD1-CD3, CS1-CS3) and calculated by using equation obtained from standard calibration curve. Formulation ED1, EC1, CD1 and CS1 shows highest percentage of drug content i.e. 96.84%, 98.52%, 97.67%, 97.40%, as compared to other formulations. In vitro dissolution profile of prepared SD (Table 5, 6; Fig. 2, 3) showing maximum and more sustenance Indo release from ED1, EC1, CD1 and CS1 as 79.98±0.31, 81.02±1.28, 92.05±0.26 and 88.76±0.82 respectively than others rending its selection as a optimized formulations and satisfy our objective of overcoming the variable bioavailability representing the efficacy, integrity and entrapment of Indomethacin. The order of release of Indo from formulations are ED1>ED3>ED2, EC1>EC3>EC2, CD1>CD3>CD2 and CS1>CS2>CS3.
Table No. 4: Percent drug content in solid dispersions
Sr. No. Solid dispersion
Code Composition Drug content* (%)
Bawankar R. D. et al., J. Sci. Res. Phar. 2014, 3(3), 86-95
2 ED2 Indomethacin:Eudragit RS100: EudragitRL100 95.85± 0.07
3 ED3 Indomethacin:Eudragit RS100: EudragitRL100 96.15± 0.23
4 EC1 Indomethacin:Eudragit RS100: EudragitRL100 98.52± 0.16
5 EC2 Indomethacin:Eudragit RS100: EudragitRL100 96.99± 0.17
6 EC3 Indomethacin:Eudragit RS100: EudragitRL100 97.45± 0.16
7 CD1 Indomethacin: Ethocel Std 10p: Methocel F50 (CD1) 97.67± 0.13
8 CD2 Indomethacin: Ethocel Std 10p: Methocel F50 (CD2) 97.04± 0.31
9 CD3 Indomethacin: Ethocel Std 10p: Methocel F50 (CD3) 96.07± 0.18
10 CS1 Indomethacin: Ethocel Std 10p: Methocel F50 97.40± 0.23
11 CS2 Indomethacin: Ethocel Std 10p: Methocel F50 96.21± 0.22
12 CS3 Indomethacin: Ethocel Std 10p: Methocel F50 97.17± 0.15
(* Represents mean ± S. D.) (n=3)
Table No. 5: In vitro dissolution profile of solid dispersions (ED1-ED3, EC1-EC3)
pH Time
Hrs
Cumulative % Indomethacin released*
ED1 ED2 ED3 EC1 EC2 EC3
1.2
1 3.27±0.81 2.76±1.81 3.07±2.82 2.79±0.81 2.07±0.71 2.44±1.71
2 7.59±1.72 5.51±0.82 6.58±1.73 5.93±1.91 5.98±1.72 6.03±0.72
6.8
3 45.97±1.52 40.61±1.72 48.80±1.81 41.31±1.28 36.42±0.62 38.73±1.27
4 59.53±0.67 55.28±0.71 57.67±0.61 59.65±0.82 50.46±2.28 53.19±0.71
5 67.56±1.87 62.83±0.62 64.32±0.69 64.03±1.91 56.36±1.82 59.11±1.82
6 69.95±2.72 63.38±1.72 66.46±1.17 65.69±0.71 59.23±0.62 62.28±0.71
7 71.07±1.82 64.23±0.71 67.34±1.82 68.44±0.72 61.86±0.82 63.33±1.37
8 72.47±0.81 65.03±0.62 68.53±2.82 70.81±0.27 62.91±1.37 66.83±0.73
9 73.53±2.91 66.61±0.72 69.28±0.74 72.63±1.28 64.56±1.37 68.64±2.73
10 75.51±1.21 67.98±1.71 70.73±1.83 77.71±0.72 66.26±0.87 70.09±1.37
11 79.98±0.31 68.08±1.81 73.68±0.73 81.02±1.28 70.01±2.83 77.53±0.26
12 86.16±0.71 69.88±0.71 76.04±0.52 85.41±0.72 76.85±1.83 79.97±0.73
(*Represents mean ± S.D.) (n=3)
Table No. 6: In vitro dissolution profile of solid dispersions (CD1-CD3, CS1-CS3)
pH Time
Hrs
Cumulative % Indomethacin released*
CD1 CD2 CD3 CS1 CS2 CS3
1.2
1 3.96±0.87 2.34±1.82 2.53±0.81 3.48±1.82 3.00±0.71 3.27±1.82
2 7.64±1.38 6.97±0.82 6.51±0.27 6.97±0.81 5.88±0.62 6.13±2.82
6.8
3 38.62±0.71 30.32±1.98 33.25±0.82 35.64±2.91 31.36±0.72 33.08±0.72
4 59.73±0.92 48.26±1.29 52.15±0.70 57.55±1.91 55.27±1.71 56.96±1.83
5 67.03±1.27 55.35±0.98 60.06±0.49 64.78±0.71 61.34±1.81 63.03±0.73
6 71.13±1.26 59.31±1.31 65.56±0.80 67.12±0.71 63.91±0.71 65.61±0.52
7 73.91±1.79 65.45±0.74 70.33±1.04 72.22±2.82 65.35±0.73 70.09±1.82
8 77.52±1.54 68.38±1.24 74.62±1.03 74.31±0.62 67.69±1.92 72.11±0.72
9 81.68±0.83 70.08±1.23 76.22±1.19 78.16±1.82 69.21±2.03 73.06±1.82
10 85.04±1.72 73.07±0.73 78.37±0.83 80.11±0.81 71.11±0.71 74.26±0.28
11 89.02±1.27 75.22±0.62 83.27±1.82 84.43±1.81 72.26±1.89 76.70±1.82
12 92.05±0.26 79.33±0.22 87.03±0.82 88.76±0.82 73.74±0.99 79.86±0.73
(*Represents mean ± S.D.) (n=3)
Fig. 2: Cumulative % Indomethacin release from Fig. 3:Cumulative % Indomethacin release from
Bawankar R. D. et al., J. Sci. Res. Phar. 2014, 3(3), 86-95
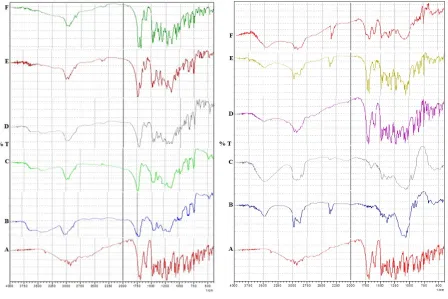
1. Characterization of solid dispersions: 1.1. Fourier Transform Infrared Spectroscopy:
Fig. 4 & 5 showed FT-IR spectra of Indomethacin Eudragit®RL100, Eudragit®RS100, EM, ED1, EC1, Ethocel Std 10p, Methocel F50, CM, CD1 and CS1 reveling retention of characteristics bands as reported in literature32,33. Pure Indomethacin (Fig. 4A, 5A) shows a strong C=O stretch, acid & aromatic band at 450 cm-1, 476 cm-1 respectively where as C-H deformation at 666 cm-1, C-O stretch plus O-H deformation band at 1232 cm-1, O-CH3 deformation band at 1463 cm-1, Aromatic C=C stretching band at 1595 cm-1. FTIR spectrum of SD namely ED1, EC1, CD1 and CS1 (Fig. 4E – F, 5E - F)
showing shifting of strong C=O stretch band to slight higher frequency (i.e. 0.44 % cm-1 increase) whereas C-H deformation band stretching to slight lower frequency (i.e. 1.05 cm-1 decrease). The peaks obtained in the spectra’s of each formulation correlates with the peaks of drug spectrum, indicating that the drug was compatible with formulation and other additives used in the preparation of the solid dispersion [32, 33]. The characteristic peaks of the pure drug were compared with peaks obtained from their respective SD formulations and % stretching increase or decrease was recorded in
Table 7 respectively.
Fig. 4: FT-IR Spectra of A) Indo, B) Eudragit®RL100, Fig. 5: FT-IR Spectra of A) Indo, B) Ethocel Std 10p, C) Eudragit®RS100, D) EM, E) ED1, F) EC1 C) Methocel F50 D) CM, E) CD1, F) CS1
Table No. 7: FT-IR Spectrum Interpretation
Characteristic peak Indo EM ED1 EC1 CM CD1 CS1 % Stretch
C=O stretch, acid & aromatic (cm-1) 450,
476 452, 476
451, 475
450, 476
452, 480
453, 479
454, 478
0.44 Increase
C-H deformation (cm-1) 666 660 658 658 660 660 660 1.05 Decrease
C-H out of plane deformation (cm-1) 838,
750 840, 750
842, 750
838, 751
840, 751
840, 751
840, 751
0.36 Increase
C-O stretch of primary alcohol (cm -1)
1025, 1110
1026, 1110
1025, 1111
1025, 1110
1027, 1112
1025, 1110
1030, 1110
0.09 Increase
C-O stretch plus O-H deformation (cm-1)
1232 1231 1231 1231 1231 1231 1231 0.82 Decrease
O-CH3 deformation (cm-1) 1463 1461 1465 1463 1465 1463 1465 1.01 Increase
Aromatic C=C stretch (cm-1) 1595 1595 1600 1597 1595 1598 1595 1.13 Increase
Aromatic C-H stretch and carboxylic acid O-H stretch (cm-1)
1711, 1696
1711, 1697
1705, 1695
1712, 1696
1711, 1696
1712, 1701
1711, 1696
0.14 Increase
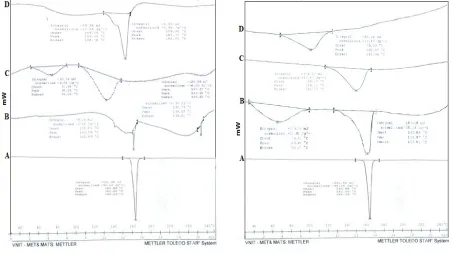
1.2. Differential Scanning Calorimetry:
The DSC thermograms of Indo, EM, ED1, EC1; CM, CD1, CS1 are presented in Fig. 6 and 7 respectively. The following general results can be derived from Table 8; Thermogram of EM (Fig.6B) and CM (Fig.7B) records two sharp endothermic peaks corresponding to the melting point of drug and used polymers
Bawankar R. D. et al., J. Sci. Res. Phar. 2014, 3(3), 86-95
Fig. 6: DSC of A) Indo, B) EM, C) ED1, D) EC1 Fig. 7: DSC of A) Indo, B) CM, C) CD1, D) CS1
Table No. 8: Thermal parameters of prepared solid dispersion 0f 1:1 w/w proportions
Solid dispersion
Tpeak (0C) ∆Hobs (J/g) ∆Hcal
(J/g)
∆H % /Result
ED1 133.05 16.22 16.97 4.62 (loss)
EC1 155.05 17.56 18.69 6.43 (loss)
CD1 149.52 17.57 18.86 7.34 (loss)
CS1 100.87 13.47 14.04 4.23 (loss)
1.3. X-Ray Diffraction:
Retention of peaks with lesser intensity in ED1, EC1, CD1 and CS1 than EM and CM in their diffraction pattern revealed
crystalline as well as non crystalline (amorphous) [36] nature of crystalline nature of Indo (Fig. 8, 9).
Fig.8: X- RD of A) Indo, B) EM, C) ED1, D) EC1 Fig. 9: X- RD of A) Indo, B) CM, C) CD1, D) CS1
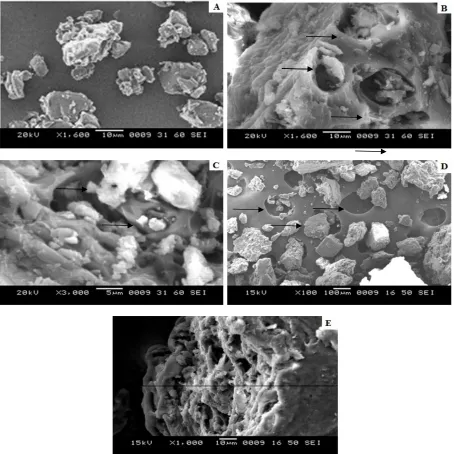
1.4. Scanning Electron Microscopy:
Scanning electron micrographs of crystals of Indomethacin appear irregular and of different shape and size as illustrates in Fig. 10A. ED1, EC1 and CD1 (Fig. 10B-D) showing
Bawankar R. D. et al., J. Sci. Res. Phar. 2014, 3(3), 86-95
Fig. 10: Scanning electron microscopy of A) Indomethacin, B) ED1, C) EC1, D) CD1, E) CS1
2. Micromeritic Evaluation:
The values obtained lies within the acceptable range and with no much difference found between loose bulk density and tapped bulk density. These results may further influence property such as compressibility and tablet dissolution. The percent
compressibility of powder mixture was determined by Carr’s compressibility index the shown in Table 9. All the formulation shows good compressibility. Hausner’s ratio was found to be in a range of 1.17 to 1.25 which shows good flow property [29].
Table No. 9: Physical properties of drug, excipients and solid dispersions
Parameters Bulk density (g/cm3) Tapped density (g/cm3) Compressibility Index (%) Hausner ratio
Indomethacin 0.269 0.426 37.18 1.61
Eudragit®RL 100 0.260 0.354 26.55 1.36
Eudragit® RS 100 0.326 0.444 26.43 1.33
Ethocel Std 10p 0.430 0.510 15.51 1.18
Methocel F50 0.338 0.520 35.13 1.54
Avicel PH 102 0.333 0.454 27.34 1.46
ED1 0.545 0.662 25.52 1.59
EC1 0.565 0.651 27.02 1.52
CD1 0.529 0.649 26.69 1.57
CS1 0.552 0.622 25.89 1.60
3. Evaluation of extended release Indomethacin tablet:
Evaluation of extended release Indo tablet was characterized with respect to the Thickness, Hardness, % friability and Drug content (Table 10). The thickness was observed in between 5.46±0.05 mm to 5.84±1.21 mm. The hardness of tablet
Bawankar R. D. et al., J. Sci. Res. Phar. 2014, 3(3), 86-95
Table No. 10: Characteristics of extended release Indomethacin tablets
(*Represents mean ± S.D.); (n = 3); (T indicates tablet code, remaining indicate design of solid dispersion code)
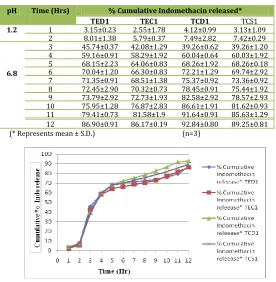
4. In vitro dissolution study and release kinetics of Indomethacin tablets:
In vitro dissolution study of prepared 700 mg extended release tablets namely TED1, TEC1, TCD1 and TCS1 (Table 11, Fig.
11) replicating sustenance Indo release were 86.90±0.91, 86.17±0.19, 92.84±0.80 and 89.25±0.81 respectively for 12 hours (as found in SD) and following release kinetics by Higuchi Plot with r2 values ranging from 0.9458 to 0.9605 (Table 12).
Table No, 11: Cumulative % drug release of tablets prepared using solid dispersion of Indo
pH Time (Hrs) % Cumulative Indomethacin released*
TED1 TEC1 TCD1 TCS1
1.2 1 3.15±0.23 2.55±1.78 4.12±0.99 3.13±1.09
2 8.01±1.38 5.79±0.37 7.49±2.82 7.42±0.29
6.8
3 45.74±0.37 42.08±1.29 39.26±0.62 39.26±1.20
4 59.16±0.91 58.29±1.92 60.04±0.64 60.03±1.92
5 68.15±2.23 64.06±0.83 68.26±1.92 68.26±0.18
6 70.04±1.20 66.30±0.83 72.21±1.29 69.74±2.92
7 71.35±0.91 68.51±1.38 75.37±0.92 73.36±0.92
8 72.45±2.90 70.32±0.73 78.45±0.91 75.44±1.92
9 73.79±2.92 72.73±1.93 82.58±2.92 78.57±2.93
10 75.95±1.28 76.87±2.83 86.61±1.91 81.62±0.93
11 79.41±0.73 81.58±1.9 91.64±0.91 85.63±1.29
12 86.90±0.91 86.17±0.19 92.84±0.80 89.25±0.81
(* Represents mean ± S.D.) (n=3)
Fig. 11: Cumulative % Indo release from TED1, TEC1, TCD1 and TCS1
Table No. 12: Kinetic treatment of data of dissolution profiles of optimized batches
Batches Variables Zero
order
First order
Hixson Crowell
Korsmeyer Peppas
Higuchi Plot
TED1 r 2 0.9087 0.8187 0.8654 0.3673 0.9458
n 0.1237 0.0024 0.0119 1.3330 0.2349
K 9.4468 0.6243 2.3642 -3.5659 4.5808
TEC1 r 2 0.9242 0.8284 0.8774 0.3632 0.9512
n 0.1256 0.0025 0.0123 1.4243 0.2366
K 7.4842 0.5523 2.1388 -3.8208 4.8021
TCD1 r 2 0.9404 0.8385 0.8938 0.3816 0.9605
n 0.1406 0.0024 0.0128 1.2973 0.2171
K 7.0421 0.6492 2.2774 -3.4471 4.7731
TCS1 r 2 0.9288 0.8320 0.8839 0.3750 0.9550
n 0.1331 0.0025 0.0125 1.3701 0.2252
K 7.5817 0.6025 2.2276 -3.6534 4.7734
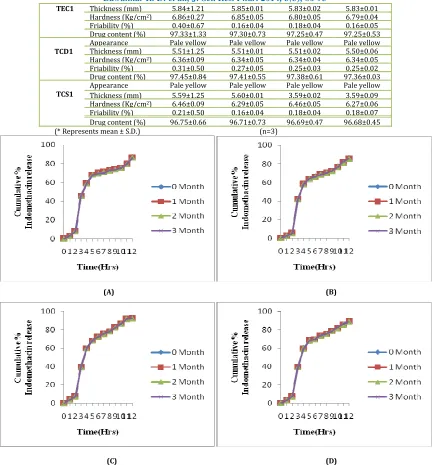
5. Stability studies:
Formulation TED1, TEC1, TCD1 and TCS1were kept for stability at 400 ± 20C and 75 ± 5% RH for 3 months. Sampling was
done after every one month and evaluation was done. No significant changes in appearance, thickness, hardness, friability, drug content and cumulative % drug release were observed during study as shown in Table 13 & Fig. 12.
Table No. 13:Evaluation of formulation TED1, TEC1, TCD1 and TCS1 kept for stability at 400C /75%RH
Tablet Parameter* 0 month 1 month 2 month 3 month
TED1
Appearance Pale yellow Pale yellow Pale yellow Pale yellow
Thickness (mm) 5.46±.005 5.47±0.01 5.45±0.02 5.42±0.01
Hardness (Kg/cm2) 6.56±0.10 6.52±0.05 6.47±0.04 6.46±0.04
Friability (%) 0.21±0.30 0.13±0.05 0.15±0.03 0.14±0.03
Drug content (%) 96.01±1.26 95.95±0.55 95.93±0.61 95.92±0.49
Appearance Pale yellow Pale yellow Pale yellow Pale yellow
Formulation Thickness* (mm) Hardness* (Kg/cm2) %Friability* Drug content* (%)
TED1 5.46±0.05 6.56±0.10 0.21±0.30 96.01±1.26
TEC1 5.84±1.21 6.86±0.27 0.40±0.67 97.33±1.33
TCD1 5.51±1.25 6.36±0.09 0.31±0.50 97.45±0.84
Bawankar R. D. et al., J. Sci. Res. Phar. 2014, 3(3), 86-95
TEC1 Thickness (mm) 5.84±1.21 5.85±0.01 5.83±0.02 5.83±0.01
Hardness (Kg/cm2) 6.86±0.27 6.85±0.05 6.80±0.05 6.79±0.04
Friability (%) 0.40±0.67 0.16±0.04 0.18±0.04 0.16±0.05
Drug content (%) 97.33±1.33 97.30±0.73 97.25±0.47 97.25±0.53
TCD1
Appearance Pale yellow Pale yellow Pale yellow Pale yellow
Thickness (mm) 5.51±1.25 5.51±0.01 5.51±0.02 5.50±0.06
Hardness (Kg/cm2) 6.36±0.09 6.34±0.05 6.34±0.04 6.34±0.05
Friability (%) 0.31±0.50 0.27±0.05 0.25±0.03 0.25±0.02
Drug content (%) 97.45±0.84 97.41±0.55 97.38±0.61 97.36±0.03
TCS1
Appearance Pale yellow Pale yellow Pale yellow Pale yellow
Thickness (mm) 5.59±1.25 5.60±0.01 3.59±0.02 3.59±0.09
Hardness (Kg/cm2) 6.46±0.09 6.29±0.05 6.46±0.05 6.27±0.06
Friability (%) 0.21±0.50 0.16±0.04 0.18±0.04 0.18±0.07
Drug content (%) 96.75±0.66 96.71±0.73 96.69±0.47 96.68±0.45
(* Represents mean ± S.D.) (n=3)
(A) (B)
(C) (D)
Fig. 12: In-vitro release profiles of formulation A) TED1, B) TEC1, C) TCD1 and D) TCS1 kept for stability at 400 ± 20C and 75 ± 5% RH
for 3 months
CONCLUSION
T
he present study demonstrated that combination of hydrophilic polymers (namely Methocel F50, Eudragit® RL100) and hydrophobic polymers (namely Ethocel Std 10p, Eudragit® RS100) could be successfully employed for formulating extended release solid dispersions of Indomethacin. The investigated tablets containing extended release solid dispersions of Indomethacin were capable of maintaining constant plasma concentration throughout 12 hrs. This can be expected to improve solubility and dissolution characteristics, reduce the frequency of administration, reduce G.I. irritation problem37, avoiding problem of recrystallization and decrease the dose dependent side effects associated with repeated administration of conventional Indomethacin tablet.ACKNOWLEDGEMENTS
T
he authors would like to gratefully acknowledge the faculty members of Institute of Pharmaceutical Education and Research, Borgaon (Meghe), Wardha for their advice and criticism during the work.REFERENCES:
1. Sekiguchi K., Obi N. Studies on absorption of eutectic mixture I. A comparison of the behavior of eutectic mixture of sulfathiazole and that of ordinary sulfathiazole in man. Chem. Pharm. Bull., 1961; 9: 866-872.
2. Chiou WL., Riegelman S. Pharmaceutical applications of solid dispersion system. J. Pharm. Sci., 1971; 60(9): 1281-1302. 3. Goldberg AH., Gibaldi M., Kanig JL., Mayersohn M. Increasing
dissolution rates and gastrointestinal absorption of drugs via solid dispersion in eutectic mixtures IV. Chloramphenicol-urea system. J. Pharm. Sci., 1966; 55: 581-583.
4. Goldberg AH., Gibaldi M., Kanig JL. Increasing dissolution rates and gastrointestinal absorption of drugs via solid dispersion in eutectic mixtures II. Experimental evaluation of eutectic mixture: Urea-acetaminophen system. J. Pharm. Sci., 1966; 482-487.
5. Goldberg AH., Gibaldi M., Kanig JL. Increasing dissolution rates and gastrointestinal absorption of drugs via solid dispersion in eutectic mixtures III. Experimental evaluation of Griseofulvin-succinic acid solution. J. Pharm. Sci., 1966; 55: 487-492.
Bawankar R. D. et al., J. Sci. Res. Phar. 2014, 3(3), 86-95
7. Vasconcelos T, Sarmento B, Costa P. Solid dispersions as strategy to improve oral bioavailability of poor water soluble drugs. Drug Discovery Today, 2007; 12(23–24): 1068– 1075.
8. Brahmankar DM, Jaiswal SB. Biopharmaceutics and Pharmacokinetics, A Treatise. Vallabh Prakashan, 1st Edition,
2003; 21-22: 335-337, 347-351.
9. Jain NK., Sharma SN. A textbook of professional Pharmacy. Vallabh Prakashan, 4th Edition, New Delhi, 2001; 334-342. 10. Rawlins EA. Bentleys textbook of pharmaceutics, Bailliere
tindall publication, 8th Edition, London, 1992; 25-29. 11. Chien YW. Novel Drug Delivery System, Marcel Dekker Inc,
New York, 2nd Edition., 1992; 1-2.
12. Panigrahy RN., Chinnala KM: Formulation and evaluation of Indomethacin solid dispersion by using hydrophilic polymers. International Journal of Pharma Research and Health Sciences, 2014; 2(1): 87-95.
13. Hajare AA., Jadhav PR. Improvement of solubility and dissolution rate of Indomethacin by solid dispersion in Polyvinyl Pyrrolidone K30 and Poloxomer 188. Asian J. Pharm. Tech., 2012; 2(3): 116-122.
14. Kulkarni S., Gupta SP., Upmanyu N., Tonpay SD. Solubility enhancement of water insoluble drug for ophthalmic formulation. International Journal of Drug Delivery, 2011; 3: 141-148.
15. Yadav VB., Yadav AV. Enhancement of solubility and dissolution rate of Indomethacin with different polymers by compaction process. International Journal of ChemTech Research, 2009; 1 (4): 1072-1078.
16. Mahmoud EB., Fetih G., Mohamed F. Improvement of solubility and dissolution rate of Indomethacin by solid dispersions in gelucire 50/13 and PEG 4000. Saudi Pharmaceutical Journal, 2009; 179(3): 219-239.
17. Oth MP., MOC AJ. Sustained release solid dispersions of indomethacin with Eudragit RS and RL. International Journal ofPharmaceutics, 1989; 55: 157-164.
18. Leuner, C., Dressman, J. Improving drug solubility for oral delivery using solid dispersions. Eur. J. Pharm. Biopharm.,
2000; 50: 47–60.
19. Craig DQ. M. The mechanism of drug from solid dispersions. J. Pharm. Sci., 2001; 60: 1281-1302.
20. Pouton, CW. Formulation of poorly water-soluble drugs for oral administration: Physicochemical and physiological issues and the lipid formulation classification system. Eur. J. Pharm. Sci., 2006; 29: 278–287.
21. Majerik, V. Bioavailability enhancement of an active substance by supercritical antisolvent precipitation. J. Supercrit. Fluids, 2007; 40: 101–110.
22. Alsaidan. Improved dissolution rate of Indomethacin by adsorbents. Drug Dev. Ind. Pharm., 1998; 24(4): 389–394. 23. Taylor, LS, Zografi, G. Spectroscopic characterization of
interactions between PVP and indomethacin in amorphous molecular dispersions. Pharm. Res., 1997; 14: 1691–1698. 24. Simonelli A.P. Dissolution rates of high energy
polyvinylpyrrolidone (PVP)-sulfathiazole co precipitates. J. Pharm. Sci., 1969; 58: 538–549.
25. Chiou, W.L., Riegelman, S. Preparation and dissolution characteristics of several fast-release solid dispersions of griseofulvin. J. Pharm. Sci., 1969; 58: 1505–1510.
26. Six Karel., Verreck G., Peeters J., Brewster M., Guy Van Den Mooter. Increased physical stability and improved dissolution properties of Itraconazole, a Class II drug, by solid dispersions that combine fast and slow dissolving polymers. J. Pharm. Sci., 2004; 93(1): 124-131.
27. Yuksel, N. Enhanced bioavailability of piroxicam using Gelucire 44/14 and Labrasol: in vitro and in vivo evaluation. Eur. J. Pharm. Biopharm., 2003; 56: 453–459.
28. Serajuddin, AT. Solid dispersion of poorly water-soluble drugs: early promises, subsequent problems, and recent breakthroughs. J. Pharm. Sci., 1999; 88: 1058–1066. 29.United States Pharmacopoeia XXIV NF 19, United States
Pharmacopoeial Convention. Rockville, 2000; 2235. 30.United States Pharmacopoeia XXIV NF 19, United States
Pharmacopoeial Convention. Rockville, 2000; 2236. 31. Townend J. Practical Statistics for Environmental and
Biological Scientists. England, John Wiley and Sons Ltd.,
2002; 270-276.
32. Nakanishi K., Solomon PH. Infrared Absorption Spectroscopy, Holden-Day, Inc.: San Francisco, 1977. 33. Silverstein RM., Webster FX. Spectrometric Identification of
Organic Compounds. John Wiley & Sons, Inc. New York, VI Edition, 1998; 95–97.
34. Hamed H, Shattawy El., Garnet EP., Kildsig DO. Aspartame-Direct Compression Excipients: Preformulation Stability Screening Using Differential Scanning Calorimetry. Drug Dev. Ind. Pharm., 1981; 7(5): 605-619.
35. Loftsson T., Olafsdottir BJ., Frioriksdottir H., Jonsdottir S. Cyclodextrin complexation of NSAIDs: Physiochemical considerations. Eur. J. Pharm. Sci., 1993; 1: 95–101. 36. Arancibia JA., Escandar GM. Complexation study of
diclofenac with β-cyclodextrin and Spectrofluorimetric determination. Analyst, 1999; 124: 1833-1838.
37. Alsaidan. Improved dissolution rate of Indomethacin by adsorbents. Drug Dev. Ind. Pharm., 1998; 24(4): 389–394.
How to cite this article:
Bawankar R. D., Dewani S. P., Yeole P. G.: Formulation, Characterization and Evaluation of Extended release Solid Dispersion of a Poorly Water Soluble drug. J. Sci. Res. Phar, 2014; 3(3): 86-95.