W mass and Triple Gauge Couplings at Tevatron
Pierre Pétroff1,a
1Laboratoire de l’Accélérateur Linéaire B.P. 34 Orsay 91898 France
Abstract. The W mass is a crucial parameter in the Standard Model (SM) of particle physics, providing constraints on the mass of the Higgs boson as well as on new physics models via quantum loop corrections. On the other hand, any deviation of the triple gauge boson couplings (TGC) from their values predicted by the SM would be also an indication for new physics. We present recent measurements on W boson mass and searches for anomalous TGC (aTGC) in Wγ, Zγ, WW, WZ and ZZ at Fermilab Tevatron both by CDF and DØ Collaborations. The CDF Collaboration has measured the W boson mass using data corresponding to 2.2 f b−1
of integrated luminosity. The measurement, performed using electron and muon decays of W boson, yields a mass of MW =80387±19 MeV. The DØ Collaboration has measured MW =80367±26 MeV with data corresponding to 4.3 f b−1of integrated luminosity in the channel W→eν. The combination with an earlier DØ
result, using independant data sample at 1 f b−1 of integrated luminosity, yields M
W =80375±23 MeV. The limits on anomalous TGCs parameters are consistent with the SM expectations.
1 W mass measurement at the Tevatron
1.1 Analysis Strategy
At the Tevatron, W bosons are primarily produced in qq annihilation, qq→W +X, where X can include QCD ra-diation that results in measurable hadronic recoil in events. W →lνldecays, where l=e orµ, are selected with high
purity by the CDF and DØ (l=e only) detectors and used to measure the mass of the W boson.
MW is determined using three kinematic variables
measured in the plane perpendicular to the beam di-rection: the lepton ( peT,µ) and neutrino (pνT) transverse momentum distributions and the transverse mass mT =
q
2peT,µpνT(1−cos∆φ), where∆φis the opening angle be-tween the lepton and neutrino momenta. The magnitude and direction of pνT is inferred from the missing transverse energy (6E~T).
A parametrized Monte Carlo simulation (FAST MC) is used to predict the shape of the transverse mass distribu-tion as well as the lepton and neutrino pTdistributions as a
function of MW. The W boson mass is extracted by fitting
the MW prediction of the Monte Carlo simulation to the
data with a binned maximum-likelihood fit.
The line-shapes prediction depend on the kinematic dis-tributions of the W decay products and detector effects, which are constrained from control samples and theo-retical calculations. The kinematic distributions are de-termined by several effects inluding internal QED radi-ation, the intrinsic W boson transverse momentum, and the proton parton distribution functions (PDFs). Elec-tron efficiency, hadronic recoil modelling, calorimeter
ae-mail: petroff@lal.in2p3.fr
response both to electromagnetic shower and hadronic shower and calorimeter fiducial acceptance are among the most important detector effects for both experiments. The parametrized fast simulation enables a study of these ef-fects at a level below 1 part in 104.
1.2 Event Generation and Simulation
Kinematics are simulated using RESBOS [1] which is a next-to-leading order generator including non-perturbative effects at low boson pT [4]. The PDFs used in RESBOS,
are CTEQ6.6 [3]. They affect the W boson mass mea-surement through their effects on the kinematics of decay charged leptons. The dominant effect from QED radiation to the W boson mass measurement comes from radiation of photons from the final state charged lepton. These pro-cesses are simulated by combining the PHOTOS program [2] with RESBOS.
The techniques used by CDF and DØ Collaborations to determine the single most important ingredient, namely the lepton energy scale are very different. The CDF measurement exploits precise measurements of track mo-menta in the inner tracker, while the DØ mesurement re-lies on a detailed understanding of electron showers in the calorimeter.
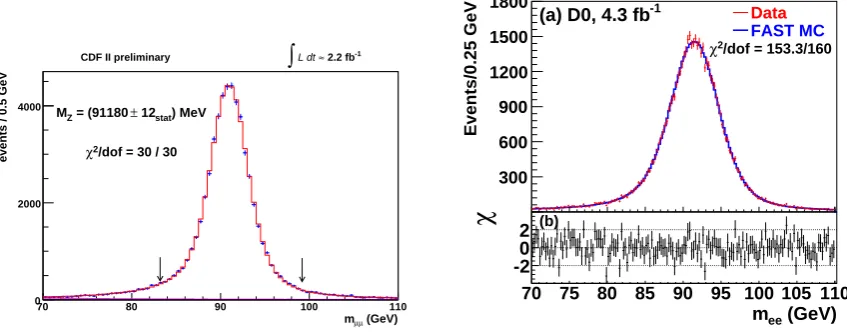
At CDF, the high statistics J/ΨandΥ(1S )→µ µ quarko-nia, are used to set the momentum scale. Fig 1 (left) shows the measurement of the Z-boson mass in the dimuon chan-nel. The Z boson mass measured is MZ=91180±12stat ±10systMeV, in good agreement with the world average
(91188±2 MeV).
The electromagnetic calorimeter energy scale is set using the peak of the E/p electron distribution from W → eν DOI: 10.1051/
C
(GeV)
µ µ
m
70 80 90 100 110
events / 0.5 GeV
0 2000 4000
) MeV
stat
12
±
= (91180
Z
M
/dof = 30 / 30
2
χ
-1 2.2 fb ≈ L dt
∫
CDF II preliminary
(GeV)
ee
m
70 75 80 85 90 95 100 105 110
χ
-20
270(b)75 80 85 90 95 100 105 110
Events/0.25 GeV
300 600 900 1200 1500 1800
Data FAST MC
-1
(a) D0, 4.3 fb
/dof = 153.3/160 2
χ
Figure 1. CDF (left): The Z→µµmass fit, showing the data (points) and the best fit simulation template (histogram). The arrows indicate the fitting range. DØ (right):(a) Distribution of the di-eelctron invariant mass in Z→e+e−sample. The shape of the distribution of the FAST MC simulation, normalised to the data, is superimposed. (b) Bin-by-bin difference between data and prediction, divided by the statistical uncertainty in the data.
and Z→ee samples. The Z→ee mass is fitted to cross-check the energy scale and the non-linearity. A value of MZ=91230±30stat±14systMeV is obtained, consistent
with the world average. The tail of the E/p distribution is used to tune the absolute number of radiation lengths in the tracker material.
At DØ the calorimeter energy scale is calibrated using Z→
e+e−. The corrections for energy lost in uninstrumented
re-gions are based on a comparison between data and detailed GEANT-based simulation of the DØ detector. The precise mesurements of the Z boson mass from LEP [7], is used to determine the absolute energy scale of the calorimeter. The MWmeasurement presented here is effectively a
mea-surement of the ratio of W and Z boson masses. Figure 1 (right) shows a comparison of the Z boson mass distribu-tions for data and fast simulation.
The hadronic energy in the event contains the hadronic system recoiling from the W boson, the effects of low en-ergy products from spectator parton collisions and other beam collisions, final state radiation, and energy from the recoil particles that enter the electron selection window. The hadronic response and resolution is calibrated using the mean and width of theηimbdistribution in Z→ee (and
µµ for CDF) events in bins of pT of the leptons. Here,
ηimb is defined as the projections of the sum of
dielec-tron (dimuon) transverse momentum and the vector sum of the transverse components of the energies measured in the calorimeter cells excluding those associated with the reconstructed electron.
1.3 Results
Kinematic distributions of background events passing the event selection cuts are included in the templates fits with their estimated normalizations. The backgrounds in the W boson samples are Z→ee (µµ) in which one e (µ) es-capes detection, multijet in which a jet is misidentified as an electron with (6E~T) arising from misreconstruction, and
Table 1. CDF and DØ : Uncertainties
Uncertainty (MeV) CDF DØ
lepton energy scale and resolution 7 17 Hadronic recoil energy scale and resolution 5 6
Backrounds 3 2
Parton distributions 10 11
QED radiation 4 7
pT(W) model 5 2
Total systematic uncertainty 15 22
W boson statistics 12 13
Total uncertainty 19 26
W →τν→ e (µ)ννν. CDF has also evaluated pion and kaon decays in flight and cosmic ray backgrounds for the µ decay channel. Background fractions is about 7% for muons(CDF) and 2% for electrons (CDF and DØ ). Concerning DØ the final MWuncertainty as well as most
of the other uncertainties, are driven by the limited Z statis-tics (see Table 1). The final MWuncertainty in CDF relies
on precise measurements of track momenta in the inner tracker based on the huge J/Ψ andΥ(1S ) statistics (see Table 1). The largest source of uncertainty in the model of W production and decay is the finite precision of the PDFs for both experiments.
The W boson mass is measured by performing a binned maximum-likehood fit to the lepton plT, neutrino pT and mT distributions for each lepton channel (electron
channel only for DØ ). The result of the fits to the mT
kine-matic distribution is shown in Fig. 2 both for CDF (right) and DØ (left).
By combining all six fits and taking into account correla-tions [8] CDF has published [5] the following result: MW =80387±12stat±15syst=80387±19 MeV.
DØ is using mT and electron peT in the combination only
as the result from6E~T does not have any significant weight
) (GeV)
ν µ
(
T
m
60 70 80 90 100
Events / 0.5 GeV
0 5000 10000 15000
) (GeV)
ν µ
(
T
m
60 70 80 90 100
Events / 0.5 GeV
0 5000 10000
15000 W →µν
/dof = 58 / 48
2
χ
(GeV)
T
m
50 60 70 80 90 100
χ
-20
250 60 70 80 90 100
Events/0.5 GeV
10000 20000 30000 40000
Data FAST MC Background -1
(a) D0, 4.3 fb
/dof = 37.4/49 2
χ
Figure 2. The W transverse mass fit for muon channel in CDF (left).The W transverse mass fit for electron channel in DØ (right). The background contributions to the template are overlaid and arrows indicate the fitting range for both distributions
.
[GeV]
t
m
140 150 160 170 180 190 200
[GeV]
W
M
80.25 80.3 80.35 80.4 80.45 80.5
=50 GeV
H
M MH=125.7 MH=300 GeV MH=600 GeV
σ 1 ± Tevatron average
kin t
m
σ 1 ± world average
W
M
=50 GeV
H
M MH=125.7 MH=300 GeV MH=600 GeV
68% and 95% CL fit contours measurements t
and m W w/o M
68% and 95% CL fit contours measurements H
and M t , m W w/o M
GfitterSM
Sep 12
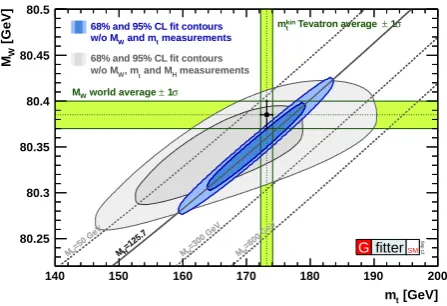
Figure 3. Indirect prediction for the masses of the top quark and the W boson from internal consistency of the SM. This prediction uses the direct measurement of the candidate Higgs boson dis-covered at the LHC recently. The direct measurements of the W boson mass (the world average dicussed in Sec 1.3) and the Teva-tron average of direct measurements of the top quark mass[12] are also shown.
MW =80367±13stat±22syst=80367±26 MeV.
DØ further combines this result [6] with the earlier mea-surement [9] to obtain the new DØ Run II results: MW =80375±11stat±20syst=80375±23 MeV.
The results of the two experiments are of comparable pre-cision, and the measurements are in good agreement. All results from the Tevatron are combined, using again the methods from Ref.[8], to yield the new Tevatron average [10]: MW = 80387±16 MeV. Combining Tevatron and
LEP results [7] yields the new world average: 80385±15 MeV.
1.4 Testing the Standard Model (SM)
Electroweak fit [11] is a powerful tool for the comparison of direct and indirect constraints on the Higgs boson mass.
Moreover, assuming the boson recently discovered at LHC with a mass of 126 GeV is the Higgs boson, electroweak fits can test the validity of the SM. This is shown in Fig. 3 which shows the indirect prediction for the masses of the top quark and the W boson from internal consistency of the SM. This predicton uses the direct measurements of the mass of the candidate Higgs boson. From [11] the indirect constraints prefer a Higgs boson that is consistent within the new boson discovered at LHC at the 1.2σlevel, with the mass of the new boson. More precise measurements of MWare therefore needed to tighten the indirect constraints
and make the test of SM even more stringent.
2 Triple Gauge Couplings at Tevatron
2.1 Methods
Measurements of the associated production of two vector bosons (γ, W, Z) are important tests of the electroweak sector of the SM. The production of a diboson final state can occur by particle-antipaticle annihilation (t-channel) or by boson self-interaction (s-channel). Observing triple gauge couplings (TGCs), not permitted in the SM or with different intensity with respect to the SM predictions, would be a sign of new physics.
In the presence of new physics, observables such as pro-duction cross-sections, TGCs, and various kinematic dis-tributions, are expected to deviate from their SM predic-tions. The charged TGCs present in W+W−, WZ, and Wγ production are∆gV
1,∆κV andλV (V=Z orγ) where∆
rep-resents the deviation from SM predictions. In the SM,
∆gV
1 = ∆κV = λV =0. Using constraints due to gauge
invariance, κZ and λZ can be expressed as a function of
the other parameters and the weak mixing angle θW as:
κZ=g1Z−(κγ−1) tan2(θW).
The neutral TGCs hV
i (i=3,4), studied in Zγproduction,
are not allowed in the SM tree-level, and their values are predicted to be zero.
The pT or ET distributions of fully reconstructed
[GeV/c]
T
Z p
0 50 100 150 200 250 300 350
Events / 10 GeV/c
2 4 6 8 10 12
14 Data
WZ γ Z
Z+jets ZZ
t t
= 0.10 Z λ
= 0.90 Z κ ∆
= 0.20 Z 1 g ∆
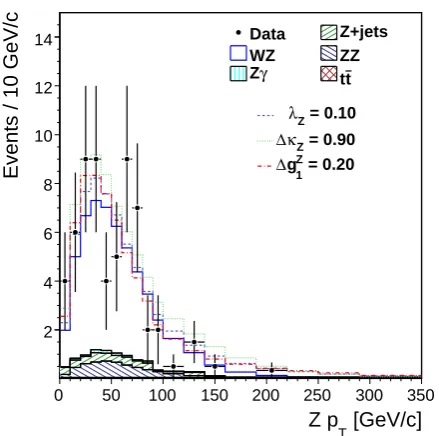
Figure 4. CDF: The Z pT distribution for data compared to the SM expectation for signal (WZ) and background. Also pre-sented is how the signal expectation would change with anoma-lous TGCs near the observed limits.
are used to extract limit on aTGC parameters. These dis-tributions are compared with Monte Carlo predictions for different set of coupling constants in order to evaluate 95% C.L. limits. The CDF and DØ collaborations are produc-ing many competitive measurements in the diboson sector. The most updated results will be presented below.
2.2 Anomalous TGCs limits
The measurement of the production cross section of WZ events in p ¯p collisions has been performed by the CDF collaboration [15] with a data sample corresponding to 7.1 f b−1 of integrated luminosity. The events are
recon-structed in final states with three charged leptons and miss-ing transverse energy from a neutrino. The shape and nor-malization of the pT spectrum of the Z boson (see Fig. 4)
are used to place 95% C.L. limits on anomalous ZWW TGCs. The one-dimensional limits for a cut-off Λ =2.0 TeV are:
−0.39<∆κZ <0.90 −0.08<∆λZ<0.10 −0.08<∆gZ
1 <0.20
the DØ collaboration has recently published [16] searches of the anomalousγWW and ZWW TGCs from WW and WZ production using lepton plus dijet final states. A com-bination with results from Wγ[17], WW [18] and WZ [19] production with leptonic final states has been used to set the most stringent limits at hadron collider to date. The analyzed data correspond to up to 8.6 f b−1.
The effects of aTGCs is to modify the high boson trans-verse momentum relative to its SM prediction. Therefore the corresponding pTj jand pll
Tare used to set 95% C.L.
lim-its on aTGCs (see Fig 5). No deviation from SM is found
(GeV)
jj T
p
0
50
100
150
200
250
300
Events / Bin
2
10
3
10
4
10
DataWVW/Z+l.f. W/Z+h.f. Top Multijets Uncert. = 0.1,
λ
= 0.2
γ
κ ∆
-1
DØ, L = 4.3 fb
(a)
(GeV)
ll T
p
0 20 40 60 80 100 120 140 160 180 200
Events / Bin
0
5
10
15
20
25
30
35
DataWZ DY Other bgd. Uncert.
= -0.05,
λ
= -0.06 Z 1 g
∆
-1
DØ, L = 8.6 fb
(b)
Figure 5. (a) The pTj j distribution summed over electron and muons channels from WW +WZ→lνj j (l=µ, e) production for data and SM MC predictions ("l.f." denotes light-partons and "h.f." denotes heavy-partons). Also shown are expected distribu-tions for an aTGC model with∆κγ=0.2 andλ=0.1. (b) The PllT distribution summed over eee, eµµ,µee andµµµchannels from
WZ→lνll production for data, SM MC prediction and for aTGC
model withλ=-0.05 and∆gZ
1 =-0.06.
in data. The limits at 95% C.L. from 8.6 f b−1WZ→lνll
are:
−0.07< λ <0.089 and−0.055<∆gZ
1 <0.137
while the limits from 4.3 f b−1WW+WZ→lνj j are: −0.27<∆κγ<0.37
−0.075< λ <0.080
−0.071<∆gZ
1 <0.137
Finally the overall combination gives the following 95% C.L. limits:
−0.158<∆κγ <0.255
−0.036< λ <0.044
−0.034<∆gZ
1 <0.084
Based on the combination of all diboson production and decay channels, the most stringent 68% C.L. constraints to date, are set on the W boson magnetic dipole and elec-tric quadrupole moments:
µW =2.012+−00..035034in e/2MWunit
qW=−0.995+−00..042043in e/M2Wunit.
In beyond-the-SM scenarios, with enhanced Zγcouplings, the photon ET spectrum is modified due to an
enhance-ment in the production of high-ET photon [20]. The CDF
the Z→ νν¯decay channel and 5.1 f b−1 in the Z →l+l− (l=µ,e) decay channels [21]. With an energy cut-offofΛ =1.5 TeV. the CP-conserving parameters that describe Zγ couplings are set to be:
|hγ,3Z|<0.022 and|hγ,4Z|<0.0009
These limits are the most stringent limits to date.
The DØ Collaboration has used the transverse momen-tum spectrum of the photon to place limits on anomalous ZZγand Zγγ couplings [22]. Data corresponding to an integrated luminosity of 6.2 f b−1 in p ¯p → Zγ→ l+l−γ
(l=e, µ) production has been analysed. The aTGCs limits are combined with a previous DØ Zγanalysis [23] result-ing in a total integrated luminosity of 7.2 f b−1 in the llγ decay channel and 3.6 f b−1in theννγdecay channel. Ap-plying an energy cut-offofΛ =1.5 TeV the limits at 95% C.L. are set to be:
|hZ3|<0.026 and|hZ4|<0.0013
|hγ3|<0.027 and|hγ4|<0.0014
These limits are comparable to those found in the most recent CDF result reported above.
2.3 Conclusion
A new precision measurement of the W boson mass per-formed by CDF and DØ Collaborations has improved the precision of the Tevatron average to 16 MeV, which com-bined with the LEP average slightly reduces the new world average to 15 MeV. These improvments in the experimen-tal precision on MWlead to precise indirect constraints on
the mass of the Higgs boson. The direct measurements of the mass of the Higgs boson candidate discovered at the LHC agree, at 1.2σ level, with indirect constraints. Even if this is a remarkable success for the standard model, more precise measurements of MW are needed to tighten
the indirect constraints and make this test of SM even more stringent. The precision of both CDF and DØ experiments is expected to improve significantly once the full data set (almost 10 f b−1) has been analysed.
The CDF and DØ Collaborations have presented recent results of diboson production using the data collected at the Tevatron between 2002-2011. The limits on anoma-lous TGCs parameters are competitive with previous re-sults from the LEP and first rere-sults from the LHC. They are consistent with the SM expectations. CDF and DØ can anticipate 2 to 10 times more data (depending on the chan-nels), to cope with the full integrated luminosity (10 f b−1)
at Tevatron. This will result in an increase of the aTGCs sensitivities by a factor 3 to 5 after a combination of the CDF and DØ results.
References
[1] C. Balazs, and C.P. Yuan, Phys. Rev. D56 (1997) 5558.
[2] E. Barberio, and Z. Was, Comput. Phys. Commun. 79 291 (1994)
[3] P.M. Nadolsky, H.L. Lai, Q.H. Cao, J. Huston, J. Pumplin, D. Stump, W.K. Tung, and C.P. Yuan, Phys. Rev. D78, 3004 (2008).
[4] F. Landry, R. Brocks, P.Nadolsky, and C.P. Yuan, Phys. Rev. D67, 073016 (2003).
[5] T.Aaltonen et al., The CDF Collaboration, Phys. Rev. Lett. 108, 151803 (2012).
[6] V.M. Abazov et al., The DØ Collaboration, Phys. Rev. Lett. 108, 151804 (2012).
[7] ALEPH Collaboration, DELPHI Collaboration, L3 Collaboration, OPAL Collaboration, LEP Electroweak Working Group, and SLD Electroweak and Heavy Fla-vor Groups, Phys. Rept. B 427, 257 (2006).
[8] A. Valassi, Nucl. Instrum. Methods Phys. Res., Sect A500, 391 (2003).
[9] V.M. Abazov et al. (DØ Collaboration), Phys. Rev. Lett. 103, 141801 (2009).
[10] The Tevatron electroweak working group for the CDF and DØ collaborations, FERMILAB-TM-2532-E, arXiv:1204.0042 (2012).
[11] M. Baak et al. (Gfitter Group), Eur. Phys. J. C72 2205 (2012).
[12] T. Aaltonen et al., (CDF and DØ Collaborations), Phys. Rev. D86, 092003 (2012).
[13] K. Hagiwara, J. Woodside and D. Zeppenfeld, Phys. Rev. D41, 21113 (1990).
[14] C. Amsler et al. (Particle Data Group), Phys. Lett. B667, (2008) 1.
[15] T. Aaltonen et al., The CDF Collaboration, Phys. Rev. D86, 031104 (2012).
[16] V.M. Abazov et al., The DØ Collaboration, Phys. Lett. B718, 451 (2012).
[17] V.M. Abazov et al., The DØ Collaboration, Phys. Rev. Lett. 107, 241803 (2011).
[18] V.M. Abazov et al., The DØ Collaboration, Phys. Rev. Lett. 103, 191801 (2009).
[19] V.M. Abazov et al., The DØ Collaboration, Phys. Rev. D80, 053012 (2009).
[20] U. Baur and E.L. Berger, Phys. Rev. D47, 4889 (1993)
[21] T. Aaltonen et al., The CDF Collaboration, Phys. Rev. Lett. 107, 051802 (2011).
[22] V.M. Abazov et al., The DØ Collaboration, Phys. Rev. D85, 052001 (2012).