DOI: 10.1051/epjconf/20135304001 C
Owned by the authors, published by EDP Sciences, 2013
HiRes and TA spectrum measurements
Douglas R. Bergman
afor the HiRes and Telescope Array collaborations
bDept. of Physics and Astronomy, University of Utah, Salt Lake City, UT 84112, USA
Abstract. The High Resolution Fly’s Eye and Telescope Array experiment are separate experiments, although there is significant overlap in both equipment and personnel. Despite using different measurement techniques the two experiments provide nearly identical measurements of the UHECR cosmic ray spectrum, with agreement in overall flux level and the positions of the spectral features of the Ankle and the GZK Cutoff. This similarity arises despite using entirely different detector techniques. What unites the measurements from the two experiments is the experimental methodology of a thoroughgoing use of Monte Carlo detector simulations which are required to produce distributions of observables which are the same as those in the actual data. The detector simulation is then used to estimate exposures and acceptances which are not directly measurable. The procedure of verification through data/MC comparisons removes many of the systematic errors associate with model assumptions inherent in the MC simulation.
1. HIRES MONOCULAR MEASUREMENTS
The High Resolution Fly’s Eye Experiment (HiRes) operated from 1997–2006 on Dugway Proving Grounds in Utah. It measured extensive air showers (EASs) from ultra-high energy cosmic rays (UHECRs) using the fluorescence method. It has been described in greater detail previously [1,2]. The experiment consisted of two sites, HiRes-I and HiRes-II, separated by 12.6 km. The separation was chosen to provide a large aperture for viewing EASs in stereo. In this presentation, however, only the monocular results from each site acting separately will be discussed. The HiRes Collaboration included scientists from Columbia University, Los Alamos National Laboratory, the University of Montana, the University of New Mexico, Rutgers University , the University of Tokyo and the University of Utah.
Each of the two HiRes sites consisted of fluorescence telescopes. The telescopes used a 5.2-m2
primary mirror to collect fluorescence light which was focused onto a 16×16 array of photomultiplier tubes (PMTs) in the focal plane. Each PMT views 1 square degree of the sky giving the telescope an instrumented field-of-view of 14◦×16◦. These telescopes were arranged in rings covering nearly the full 360◦ in azimuth at each site. At HiRes-I there was one ring of telescopes covering from 3◦–17◦in elevation, while at HiRes-II there were two rings covering 3◦–31◦.
The analysis of the data begins with a pattern matching stage which looks for nearly coincident signals in a set of contiguous PMTs within each telescope and in neighboring telescopes. The PMT signals should for a line in both space (angle on the sky) and in time (successive signals separated by fractions of a microsecond from one tube to the next). The spatial correlation of the tube pointing directions for cosmic ray events is used to define the Shower-Detector Plane (SDP) containing the line of the shower core and the point of the detector. For observations in stereo mode, the intersection of the two SDPs, one from each site, completely defines the shower geometry. For observations in monocular mode, the relative timing of the PMT signals must be used. Assuming the the shower front moves at the
ae-mail:[email protected]
bFor the full authorlist see Appendix “Collaborations” in this volume.
RP, Data
RP (m)
Events/km
RP, Data/MC Ratio
20.24 / 18
A0 0.9979 0.4262E-01 A1 -0.2615E-05 0.4472E-05
RP (m)
Data/MC Ratio
1 10 102 103
0 5000 10000 15000 20000 25000 30000 35000 40000
0 0.2 0.4 0.6 0.8 1 1.2 1.4 1.6 1.8 2
0 5000 10000 15000 20000 25000 30000 35000 40000
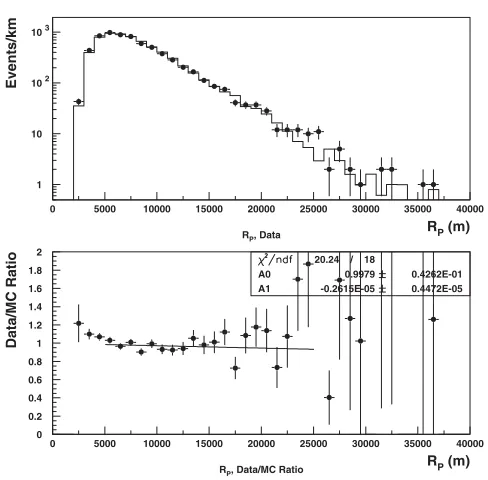
Figure 1. Data/MC comparison of impact parameter at HiRes-II. Shown below the main comparison is the ratio of data to MC.
speed of light, one can show that the time of signals reaching the detector should have the form
ti−t0=Rp
c tan
−−i
2 (1)
wheretiis the measured time of a signal coming from an anglei along the SDP (measured from the horizon). The fit parameters areRp, the impact parameter of the shower on the detector,, the angle the shower makes with respect to the ground in the SDP andt0, the earliest possible time for a signal
to reach the detector (it is also the time when the shower reaches the point of closest approach to the detector).
Unless the observed track has a very great extent in the three parameters are highly correlate leading to poorer resolution of the shower geometry within the SDP plane than of the SDP itself. Nonetheless, monocular analysis is still useful as it will have a considerably larger aperture for detecting UHECR air showers at high energies and will have a much lower low-energy threshold.
With the geometry determined, the shower profile is reconstructed. To determine the best estimate of shower development parameters, we used the so-called Inverse MC (IMC) method. In this technique, shower development is assumed to follow the Gaisser-Hillas profile, and theNmaxandXmaxparameters
are varied to find the best fit. The name of the technique comes from the fact that for each set of GH parameters, the same detector simulation program is used to find the expected PMT signals as is used in calculating the overall detector aperture. The fit is performed by comparing individual PMT responses between data and IMC predictions.
Figure 2. Data/MC comparison of the core distance on the ground at HiRes-I. The comparison is shown in three energy bands to emphasize how the shape changes and that the MC reproduces these changes.
ψ, Data ψ (deg)
Events/5 deg
ψ, Data/MC Ratio
30.53 / 18
A0 0.8984 0.5606E-01 A1 0.1046E-02 0.5997E-03
ψ (deg)
Data/MC Ratio
1 10 102 103
20 40 60 80 100 120
0 0.2 0.4 0.6 0.8 1 1.2 1.4 1.6 1.8 2
20 40 60 80 100 120
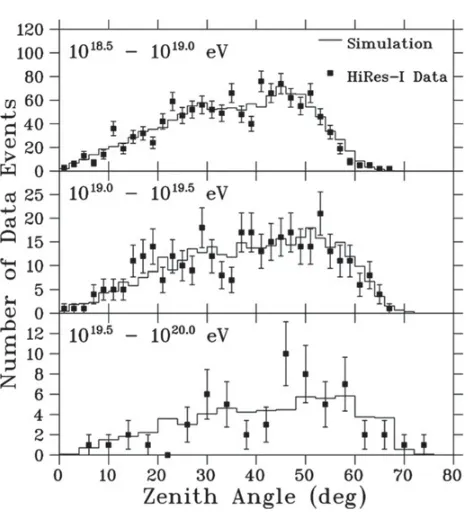
Figure 4. Data/MC comparison of the zenith angle at HiRes-I. The comparison is shown in three energy bands.
LTF χ2/DOF, Data χ 2
Events
LTF χ2/DOF, MC, Ratio
12.21 / 17
A0 1.045 0.3772E-01 A1 -0.1431E-01 0.1195E-01
χ2
Data/MC Ratio
1 10 102 103
0 2 4 6 8 10 12 14 16 1 0
0 0.2 0.4 0.6 0.8 1 1.2 1.4 1.6 1.8 2
0 2 4 6 8 10 12 14 16 18 2
8 2
0
log10(E) (eV)
Flux*E
3/10
24
(eV
2 m -2 s -1 sr -1)
HiRes-I Monocular HiRes-II Monocular
χ2
/DOF = 70.3/NA
γ1=3.25
log10E1=18.65
γ2=2.81
P(46.2,14)=2.83x10⁻⁸
10
-1
1 10
17 17.5 18 18.5 19 19.5 20 20.5 21
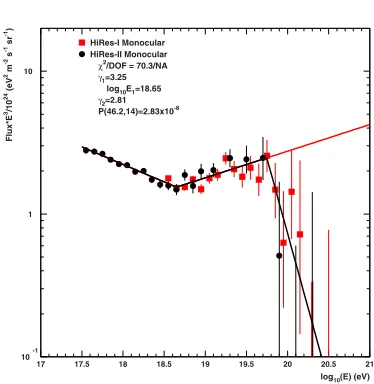
Figure 6. The UHECR spectrum as measured by HiRes-I and HiRes-II including a broken power-law fit.
- axis [m] u
Distance along the
-4000 -2000 0 2000
S ]
µ
Tim
e
[
24 26 28 30 32 34 36 38 40
Figure 7. An example fit of an event showing time vs counter position. The counter position is projected onto the shower direction projected onto the ground.
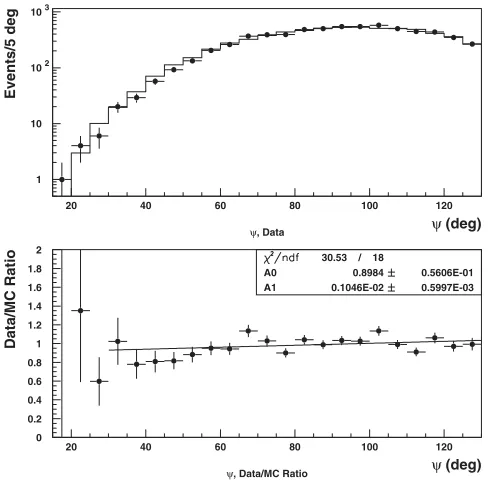
We compare variables which impinge directly on the aperture: the distance to showers and their angular distribution. Figure1shows the dataa4/MC comparison of the impact parameter at HiRes-II. Figure2shows a comparison of the distance on the ground between the detector and the shower impact point in three energy bands for HiRes-I. Figure3 shows the distribution of at HiRes-II. Figure 4 shows the distribution of zenith angles at HiRes-I. Finally, Figure5shows the agreement in the fit2 distribution at HiRes-II. Agreement in the fit quality implies that the resolution measurements made in the MC simulation are applicable to the data.
After calculating the aperture of the experiment as a function of energy, it is straightforward to calculate the spectrum. The spectrum of UHECRs as measured by both HiRes-I and HiRes-II is shown in Figure6. HiRes was the first experiment to observe the GZK Cutoff. The significance of the cutoff at 1019.75eV is determined by counter the number of events observed above this energy and comparing
Lateral distance [m] 3
10
2
VEM / m
-1
10 1 10
2
10
Figure 8. A fit to the LDF. The value of the fit at 800 m is used in determining the shower energy.
(E/eV)
10
log
17 17.5 18 18.5 19 19.5 20 20.5 21
T
rigger E
fficiency
-3
10
-2
10
-1
10 1
Figure 9. The efficiency of the TA SD array as a functino of energy. Energies above 1018.2eV are used in the
analysis, corresponding to efficiencies above 8%.
monocular apertures, 13 events were observed while 43 events were expected in the case of no break. This corresponds to a 5.3result.
The position of the cutoff as measured by HiRes can be qualified by finding the energy at which the integral spectrum falls to half of what would have been expected without the cutoff. For HiRes the log of this energy is 19.73±0.07 agreeing nicely with the prediction of Berezinsky et al [3] of 19.72. This results assumes that the bulk of UHECR primaries are protons, in agreement with all HiRes composition measurements.
2. TELESCOPE ARRAY SURFACE DETECTOR MEASUREMENTS
10-3 10-2 10-1 1 10 102 103
0.5 1 1.5 2 2.5 3 3.5 4 4.5
Dethinned
Non-thinned
RMS
Mean
Distance from Shower Core (km)
Energy Deposited per Counter (MeV)
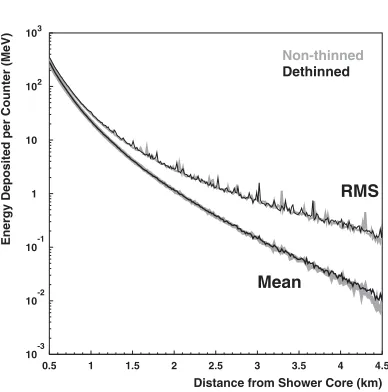
Figure 10. The mean energy deposit as a function of distance to the shower core and the RMS of the energy deposit distribution. The results of a Corsika run with no thinning (grey) are compared to the results of a Corsika run with thinning which has been subject to a dethinning preceedure.
[Degree]
θ
0 10 20 30 40 50
0 100 200 300 400 500
Figure 11. Data/MC comparison of the zenith angle distribution.
of the HiRes and AGASA collaborations. The detector is described in greater detail elsewhere [4,5]. The SDs each have an active area of 3 m2, consisting of two layers of 1-cm thick scintillator. The light
from the scintillators are collected by wave-shifting fibers to photomultiplier tubes, one each for the top and bottom sections. The three FD sites each contain two rings of mirrors, viewing 3◦–31◦in elevation, and views∼110◦in azimuth. The azimuthal fan from the three sties are arranged to fully cover the SD array at energies above 1019eV.
/dof
2 χ
0 1 2 3 4 5 6 7 8 9 10
0 100 200 300 400 500 600
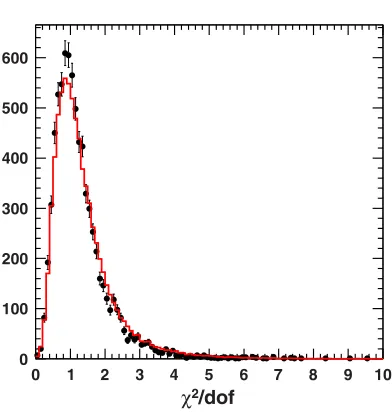
Figure 12. The distribution of2of the LDF fit. The good comparison implies that the resolution calculations are
aso good.
(Q/VEM)
10
log
0 0.5 1 1.5 2 2.5 3
0 1000 2000 3000 4000 5000
Figure 13. Data/MC comparison of the distribution of energy deposits per counter in all counters.
emphasized that the energy normalization does not come solely from the Middle Drum site which uses refurbished HiRes mirrors and PMTs.
Analysis of the SD events begins by finding the barycentric average of the hit counters. The space and time distribution is then combined in a fit to find the most likely core position and primary cosmic ray direction. An example of the time of each counter vs counter position is shown in Figure7. Once the core and direction are found, the charge particle lateral distribution is fit to determine the density of charged particles 800 m from the shower core,S(800).S(800) is the primary energy-dependent variable used in TA SD analyses. An example LDF fit is shown in Figure8.
)]
-2
[ S800/(VEM m
10
log
0.5 1 1.5 2 2.5 3
1 10
2
10
3
10
Figure 14. Data/MC comparison ofS(800) values.
) θ sec(
1 1.1 1.2 1.3 1.4 1.5
(S800)
10
log
0 0.5 1 1.5 2 2.5 3
18 18.5 19 19.5 20 20.5
eV
20.5
10
eV
17.8
10
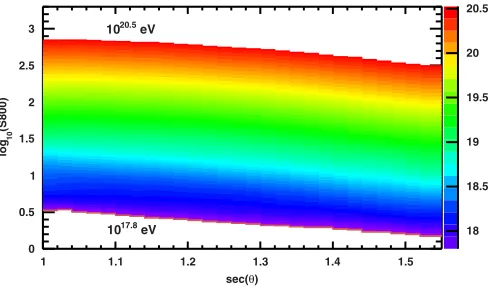
Figure 15. The look-up table used to estimate the energy of an air-shower based on its zentih angle anS(800) measurement.
can be considerably extended by careful estimation of the acceptance efficiency at lower energies. Figure9shows the calculated efficiency of the SD array. It is the result of careful MC simulation like the fluorescence case, with verification of the simulation through data/MC comparisons. This is the first time such a thoroughgoing use of the data/MC comparison method has been performed in an SD spectrum measurement. To generate the required size MC sample requires the use of thinning during simulation of showers. The statistical effects of thinning are removed by a de-thinning proceedure [6]. The result of the dethinning preceedure are compared with the same shower generated with no thinning as shown in Figure10.
We show data/MC comparisons which impact the efficiency directly: zenith angle, LDF2, energy
deposit per counter andS(800). These are shown in Figures11–14.
(E/eV)
10
SD, log
17 17.5 18 18.5 19 19.5 20 20.5 21
(E/eV)
10
FD, log
17 17.5 18 18.5 19 19.5 20 20.5 21
Figure 16. Comparison of rescaled SD energies with energies measured by the FD detectors.
Figure 17. The spectrum of UHECRs as measured by the TA surface detector. The spectrum is fit to a broken power law, with the spectral slopes and break points as noted.
look-up table is displayed in Figure15. Finally, the energy is scaled to match the FD energy scale by comparing the energies of events seen by both the SD and any (and all) of the three FD sites. A scatter plot of the SD and FD energies (after the SD energy re-scaling) is shown in Figure16.
Figure 18. A compilation of the HiRes monocular and TA SD spectrum measurements highlighting the close agreement between the measurements.
References
[1] Abu-Zayyad et al. Proceedings of the 26th ICRC (Salt Lake City) (1999) vol. 5, p. 349 [2] J. H. Boyer et al., Nucl. Inst. Meth. A 482, 457 (2002)
[3] V. Berezinsky et al., Phys. Rev. D 74, 0403005 (2006), [hep-ph/0204357] [4] H. Tonuno et al., Nucl. Inst. Meth. A 676 (2012)