SPEECH FUNDAMENTAL PERIOD ESTIMATION USING PATTERN CLASSIFICATION
IAN HOWARD
5/06/1991 V2.0
DEPARTMENT OF PHONETICS AND LINGUISTICS UNIVERSITY COLLEGE LONDON
ProQuest Number: 10610960
All rights reserved
INFORMATION TO ALL USERS
The qu ality of this repro d u ctio n is d e p e n d e n t upon the q u ality of the copy subm itted.
In the unlikely e v e n t that the a u th o r did not send a c o m p le te m anuscript and there are missing pages, these will be note d . Also, if m aterial had to be rem oved,
a n o te will in d ica te the deletion.
uest
ProQuest 10610960
Published by ProQuest LLC(2017). C op yrig ht of the Dissertation is held by the Author.
All rights reserved.
This work is protected against unauthorized copying under Title 17, United States C o d e M icroform Edition © ProQuest LLC.
ProQuest LLC.
789 East Eisenhower Parkway P.O. Box 1346
ABSTRACT
The problem investigated concerns the robust estimation of fundamental period, only on the basis of representative speech pressure waveforms. The work has involved the design and development of a set of algorithms. The main intended application is in pattern processing acoustic and cochlear implant hearing aids. Essentially the task is to infer from the acoustic evidence available the points in time at which vocal fold closures occur. Its accomplishments both gives fundamental period information on a cycle-by- cycle basis and provides information concerning whether voicing is present.
The task of detecting the point of closure of the vocal folds is formulated as a pattern recognition problem, and the pattern recognition technique employed uses the multi-layer perceptron (MLP). The first system configurations investigated were based on a pre processing of the speech pressure waveform by a wide-band filterbank analyzer. This gave an input to the classifier which consisted of a set of adjacent time frames from the output of the filterbank. The output from the classifier was defined as being in one of two classes. In the first there is a period epoch marker at a given output frame, in the second there is not. This first classifier was trained to generate an output which signified the presence of a vocal fold closure at the centre of its input window. The fundamental periods between successive vocal-fold closures defined by these epoch markers, are given the name Tx. The labelling of both training and test data was performed semi-automatically by means of an algorithm that makes use of the output of a laryngograph.
be run in real-time on a portable DSP system. A real-time system was implemented in conjunction with Mr. John Walliker. First patient results using this system are reported following perceptual assessments made by Dr. Andrew Faulkner.
A number of objective assessment techniques were developed and used to permit quantitative comparisons between fundamental period estimation algorithms to be carried out. These involved both quantitative comparisons between frequency contours and between time excitation epoch markers. Using these comparisons, various different configurations of the MLP-Tx algorithm were evaluated over a wide range of speakers and environmental conditions. The performance of the MLP-Tx algorithm was also compared against that of established fundamental frequency estimation algorithms, and its performance in competing noise was found to be better than that obtainable by the use of the peak-picking approach previously employed.
ACKNOWLEDGEMENTS
The author would like to express his gratitude to Professor Adrian Fourcin for providing the opportunity to work in his department and for suggesting a suitable area in which to study for the degree of Doctor of Philosophy.
The speech filing system used for speech data handling (SFS) was written by Dr. Mark Huckvale, in conjunction with whom the pattern processing system (PPS) was developed. Many thanks are also due to Dr. Mark Huckvale for reading and commenting on the chapter on pattern recognition techniques.
The peak-picker algorithm used for some of the comparisons was written by Dr. David Howard and Andy Eaton.
Sarah Palmer helped with some of the recordings.
Remi Brun constructed the constant distance microphone mounting device, and also helped with some of the recordings.
Julian Daley and John Walliker built the preamplifier and high pass filter board for the Knowles microphone used for some of this work.
The author would also especially like to thank Dr. Andrew Faulkner and Dr. Stuart Rosen for reading and commenting on the draft manuscript.
The author would also like to thank his other colleagues and the staff in the Phonetic and Linguistics department for their help, and the many speakers who gave up their time to be recorded for the training, evaluation and testing databases.
Finally the author would like to thank Professor Eric Ash for his initial help in providing the chance to study for a PhD at University College London.
This work was initially supported by the Medical Research Council of Great Britain, then carried out by the author in his own time and finally with support from Laryngograph Trust.
TABLE OF SYMBOLS
A/D Analogue to digital
ANN Artificial neural network
BW Bandwidth
Cj Covariance matrix
exp Natural exponent
dB Decibel
8y/8x Representation of a partial differential
Dj Decision boundary i
DL Difference limen
Dx Frequency histogram of Fx values E Total error in MLP output
Ep Error in MLP output, for pattern p EPI External Pattern Input group at UCL ERB Equivalent rectangular bandwidth
FT Fourier transform
Fj Squashing function in MLP
Fx Larynx fundamental frequency
Hz Frequency in Hertz
Ipi Input pattern p for node i in MLP Ljj Loss matrix for Bayesian classifier
Ln Natural logarithm
Lx Output waveform from laryngograph M Number of pattern classes
Mj Mean vector
MLP Multi-layer perceptron
MLP-Tx Name o f MLP algorithm for fundam ental p eriod estimation
ms Milliseconds
PPS P(WJX) P(XIWS) RNID ROC SFS SNR Tp> Tx UCL VOT W* Wjj X a ° pj
r
o
3.141592654, the natural constant Pattern processing system, used at UCL
Conditional probability of pattern class W; given data vector is X Conditional probability of data vector X given pattern class W;. Conditional average risk in Bayesian classifier
Royal National Institute for the Deaf Receiver Operating Characteristic Speech Filing System, used at UCL Signal to noise ratio
Target pattern p for output node i in MLP Larynx fundamental period value
University College London Voicing onset time
Pattern class i
Weight between nodes i and j in MLP Data vector
Momentum term for MLP Error term for MLP
Learning rate constant for MLP Representing a small change
TABLE OF CONTENTS
A BSTRA CT... 2
ACKNOWLEDGEMENTS... 4
TABLE OF SY M BO LS... 6
TABLE OF C O N TEN TS... 8
LIST OF FIGURES... 22
CHAPTER 1: THE AIMS OF THE W O R K ... 30
1.1 AIMS OF THE W O R K ... 30
LL1 Speech fundamental period estimation . . . ... 30
1.1.2 Applications of speech fundamental period estim ation... 31
Cochlear im p lan ts... 31
Speech C o d in g ... 32
Speech and Speaker Recognition ... 33
Glottal-synchronous speech analysis ... 33
1.2 ORGANIZATION OF THE THESIS ... 34
CHAPTER 2: THE PRODUCTION AND DESCRIPTION OF S P E E C H 37 2.1 SPEECH PRODUCTION... 37
2.1.1 In troduction... 37
2.1.2 The speech s ig n a l... 37
2.1.3 Origins of speech ... 37
2.1.4 The hierarchical nature of the speech s ig n a l... 38
2.1.5 Descriptions of the speech signal ... 39
2.3 PHONETIC LEVELS OF D E SC R IPT IO N ... 41
2.3.1 Phonemes ... 42
2.3.2 A llophones... 42
2.3.3 Consonants... 43
2.3.4 Vowels ... 44
2.3.5 Intonation ... 46
2.5 DIGITAL REPRESENTATIONS OF THE SPEECH WAVEFORM . . 46
2.5.1 Parametric m o d els... 47
2.5.2 Acoustic variability of sp ee c h ... 47
2.2 VOICED E X C IT A T IO N ... 48
2.2.1 Vocal Fold V ibration... 48
2.2.2 Mechanism of vocal fold vibration ... 49
2.2.3 Laryngographic descriptions of Voiced s p e e c h ... 50
2.2.4 Laryngograph signals for different voice q u a litie s... 50
2.2.5 Normal v o i c e ... 51
2.2.6 Breathy v o ic e ... 51
2.2.7 Creaky voice ... 51
2.2.8 Falsetto v o ic e ... 52
2.2.9 Mixed excitation... 52
2.2.10 Problems in using the laryngograph... 52
2.2.11 Discrepancies between the speech signal and the laryngograph signal ... 53
CHAPTER 3: ISSUES IN SPEECH FUNDAMENTAL FREQUENCY AND PERIOD ESTIMATION ... 68
3.1 INTRODUCTION... 68
3.1.1 Fundamental frequency and pitch ... 68
3.1.2 Approaches to speech a n a ly s is ... 69
3.1.3 Simplified model of speech e x c ita tio n ... 69
3.2 FUNDAMENTAL PERIOD, FUNDAMENTAL FREQUENCY AND P IT C H ... 70
3.2.1 Definition of fundamental period ... 70
3.2.2 Period-by-period or average m easurem ents... 71
3.2.3 The perception of spectral and virtual pitch ... 72
3.2.4 Some important models of pitch perception ... 73
3.2.5 The pitch of speech... 74
3.2.6 Difference limens for changes in fre q u e n c y ... 75
3.2.7 The precision of speech p ro d u ctio n ... 75
3.3 PROBLEMS IN SPEECH FUNDAMENTAL PERIOD AND FREQUENCY ESTIMATION ... 76
3.3.1 Basic difficulties... 76
3.3.2 Requirements for fundamental frequency estimation algorithms . 76 3.3.3 Sources of gross errors in fundamental period and period estimation ... 77
Strong first formant in vicinity of second harm onic... 78
3.3.4 The required operating frequency r a n g e ... 78
3.3.5 Required measurement resolution and accuracy ... 79
Requirements for profoundly deaf EPI p a tie n ts... 80
3.3.6 Accuracy limitations due to time quantization of sampled signals 80 3.3.7 Required maximum rate of change of speech fundamental period 81 3.4 CATEGORIZATION OF SPEECH FUNDAMENTAL FREQUENCY ESTIMATION ALGORITHMS ... 81
3.4.1 Preliminary classification... 81
3.4.2 Types of a lg o rith m ... 82
CHAPTER 4: ESTABLISHED METHODS OF SPEECH FUNDAMENTAL FREQUENCY/PERIOD ESTIM ATION... 88
4.1 TIME DOMAIN SPEECH FUNDAMENTAL PERIOD ESTIMATION 88 4.1.1 In tro d u ctio n ... 88
4.1.2 Fundamental harmonic extraction ... 89
Analysis of zero-crossing extractor to avoid gross inaccuracies . . . 90
Linear pre-processing ... 91
Tracking filte rs ... 91
4.1.3 Structural an aly sis... 93
Envelope modelling ... 94
Peak P i c k e r ... 94
Analysis of extrema ... 96
Peak detection and global co rrectio n ... 96
Pitch C h a in in g ... 97
Gold-Rabiner Algorithm ... 98
4.1.4 Simplification of temporal structure... 99
Inverse filtering ... 100
Epoch detection ... 102
4.1.5 Multi-channel an aly sis... 103
4.2 SHORT-TERM SPEECH FUNDAMENTAL FREQUENCY E S T IM A T IO N ... 105
4.2.1 In tro d u ctio n ... 105
4.2.2 The principle of short-term analysis ... 105
Characteristics of short-term analyzers... 106
Problems with irregular speech excitation ... 107
Computational considerations... 107
4.2.3 Lag domain a n a ly s is ... 108
Centre-clipping... 109
The SIFT A lg o rith m ... 110
Average Magnitude Difference Function (AMDF) ... I l l 4.2.4 Frequency-domain analysis... I l l Harmonic product sp e c tru m ... 112
Frequency and Period h isto g ra m s... 113
Harmonic pattern matching ... 113
Psychoacoustically-based fundamental frequency estimation . . . . 114
Cepstrum P ro cessin g... 114
4.3 LARYNGEAL MEASUREMENT OF SPEECH FUNDAMENTAL PERIOD ... 116
4.3.1 In tro d u ctio n ... 116
Contact m icrophones... 117
Electro-glottograph... 117
4.3.2 The laryngograph ... 117
CHAPTER 5: FUNDAMENTAL PERIOD ESTIMATION USING THE LARYNGOGRAPH ... 141
5.1.1 Intro d u ctio n... 141
5.1.2 Automatic reference fundamental period estim ation... 141
5.1.3 Interactive fundamental period estimation algorithm ... 144
CHAPTER 6: TECHNIQUES FOR COMPARING FUNDAMENTAL FREQUENCY/PERIOD ESTIMATION A LG O RITH M S... 150
6.1 INTRO D U CTIO N ... 150
6.1.1 Organization of this c h a p te r... 150
6.1.2 The need for quantitative comparisons of performance ... 150
6.1.3 Fundamental frequency and fundamental period comparisons . . 151
6.2 ESTABLISHED COMPARISON TECHNIQUES ... 151
6.2.1 Frequency c o n to u rs... 152
6.2.2 Visual comparison of frequency contours... 152
6.2.3 Frequency histograms ... 152
6.2.4 Problems with subjective measurements... 153
6.2.5 Quantitative comparison of frequency co n to u rs... 153
Gross and fine e rro rs ... 153
Voicing transitions e rro rs ... 155
6.2.6 Implementation of frequency contour comparisons ... 156
Check frame r a t e s ... 156
Estimate time difference between test and reference contours . . . 156
Calculation of errors in voicing determination ... 157
Calculation of gross e r r o r s ... 157
Calculation of fme error s ta tis tic s ... 157
Calculation of contour statistics with respect to different labels . 158 6.3 NEW COMPARISON TEC H N IQ U ES... 158
6.3.2 Period marker comparison metrics ... 159
Hits, misses and false a la r m s ... 159
Absolute marker jitter and period jitter ... 159
6.3.3 Dynamic programming alignment of test and reference period m a rk e rs ... 160
Constant time shift alig n m en t... 160
Dynamic time-warping a lig n m e n t... 161
6.4 PROBLEM ARISING WITH COM PARISONS... 162
6.4.1 The basic problem ... 162
6.4.2 Relationship between hits and false a larm s... 162
6.4.3 Receiver operating characteristic... 163
6.4.4 Setting ’hit’ rate of test and reference algorithms to the same v a l u e s ... 164
6.4.5 Setting period marker count to the same as the reference period marker c o u n t ... 165
CHAPTER 7: PATTERN RECOGNITION TECHNIQUES ... 173
7.1 BASIC CONCEPTS IN PATTERN RECOG NITION... 173
7.1.1 In troduction ... 173
7.1.2 Definition of a P a tte rn ... 173
7.1.3 Supervised and unsupervised pattern recognition... 173
7.1.4 Geometric interpretation of patterns and pattern recognition . . . 174
7.1.5 Learning as functional approximation ... 175
Functional approximation using a look-up table ... 175
7.1.6 An example of a simple pattern recognition ta s k ... 177
7.1.7 Basic structure of a pattern recognition s y s te m ... 179
M easurem ent... 179
Pre-processing ... 180
Determination of the decision function ... 180
7.2 CLASSIFICATION USING DISTANCE FU N C TIO N S... 181
7.2.1 Template matching; nearest neighbour pattern classification . . . 181
7.2.2 k-nearest neighbour pattern classification... 182
7.2.3 Cluster seeking algorithm s... 182
7.2.4 Unsupervised pattern recognition ... 184
7.3 CLASSIFICATION USING LIKELIHOOD FU N CTIO N S... 184
7.3.1 In tro d u ctio n ... 184
7.3.2 Bayes’ c la s sifie r... 185
7.3.3 Bayes’ classifier for Gaussian p a tte rn s... 187
7.4 BRIEF REVIEW OF ARTIFICIAL NEURAL NETWORKS ... 187
7.4.1 In tro d u ctio n ... 188
7.4.2 Characteristics of biological n e u ro n s ... 188
7.4.3 Basic characteristics of artificial neural network models ... 189
7.4.4 Comparison between traditional classifiers and artificial neural networks ... 190
7.4.5 Origins of artificial neural networks ... 190
7.4.6 Early models of the nervous system ... 190
7.4.7 The Hebb learning rule ... 191
7.4.8 Early computer simulations of neural netw orks... 191
7.4.9 The p e rc e p tio n ... 192
7.4.10 The Pandemonium m o d e l... 192
7.4.11 Widrow and Hoff learning r u l e ... 193
7.4.12 Limitations of linear networks ... 195
7.4.13 Hopfield netw orks... 196
7.4.14 Problems of training multi-layered n etw o rk s... 197
7.4.15 The N eocognitron... 197
7.4.16 Simulated annealing... 198
7.3.17 The Boltzmann m achine... 199
7.4.18 The multi-layer p e rc e p tio n ... 200
The generalized delta-rule ... 201
Advantages of the multi-layer perceptron... 201
7.4.19 Networks that employ unsupervised tra in in g ... 202
7.5 IMPORTANT ASPECTS OF THE MULTI-LAYER PERCEPTRON . 204 7.5.1 In tro d u ctio n ... 204
7.5.3 Effect of cascading linear n etw orks... 205
7.5.4 Limitations of linear networks ... 205
7.5.5 The effect of "hidden units" on the classification capabilities of a n e tw o rk ... 206
7.5.6 Mathematical analysis of le a rn in g ... 207
7.5.7 The delta r u l e ... 207
7.5.8 The generalized delta rule ... 210
7.5.9 Sigmoid squashing fu n c tio n ... 212
7.5.10 Starting condition for n etw o rk s... 213
7.5.11 Performance of the M L P ... 214
7.5.12 Using "Momentum terms" during training ... 214
7.5.13 Adaption of the learning rate and the momentum te r m ... 215
7.5.14 The number of patterns used to estimate weight changes . . . . 216
7.5.15 Selective emphasis training of the M L P ... 217
7.5.16 Similar techniques to selective emphasis ... 218
7.5.18 Relationship between capacity and required training examples 219 7.5.19 Generalization of the training data to testing d a t a ... 219
CHAPTER 8: BASIC CONCEPTS AND PRELIMINARY EXPERIMENTS IN SPEECH FUNDAMENTAL PERIOD ESTIMATION USING PATTERN CLASSIFICATION... 231
8.1 BACKGROUND TO THE DEVELOPMENT OF THE MLP-Tx ALGORITHM ... 231
8.1.1 In tro d u ctio n ... 231
8.1.2 Initial work task at UCL ... 231
8.1.2 Use of the laryngograph to indicate v o ic in g ... 232
8.1.3 Speech voicing determination using pattern classification 232 8.1.4 Experiment using pattern classification to estimate voicing . . . 233
Database for voicing determination ex p erim en ts... 233
8.2 INITIAL MLP-Tx EXPERIMENTS ... 234
8.2.1 Similarities between voicing determination and fundamental period estimation ... 235
8.2.2 Initial system structure... 235
Wideband spectrogram ... 236
MLP-Tx wideband filte rb a n k ... 236
Selection of frame rate ... 237
Pattern vector g en eratio n ... 237
8.2.3 Preliminary attempts at fundamental period estim ation... 238
Labelling training and testing data with excitation markers . . . . 238
8.3 FIRST MLP-Tx EXPERIMENTS ON A LARGE D A TA BA SE 239
8.3.1 Data for the MLP-Tx experiment ... 239
Adding noise to the speech sig n a l... 240
8.3.2 Training the networks ... 240
8.3.3 Qualitative evaluation of results ... 241
8.3.4 Quantitative evaluation of results ... 243
8.2.5 Conclusions on preliminary results ... 244
CHAPTER 9: MORE DETAILED DISCUSSION OF ISSUES IN SPEECH FUNDAMENTAL PERIOD ESTIM ATION USING PATTERN CLASSIFICATION... 263
9.1 LIMITATIONS OF PRELIMINARY EXPERIMENT ... 263
9.1.1 Preliminary experiment ... 263
9.1.2 Limitations in the testing d a ta ... 263
9.1.3 Lack of optimization of MLP-Tx parameters ... 263
9.1.4 Limited output period marker time reso lu tio n ... 264
9.1.5 Organization of this c h a p te r ... 264
9.2 DATABASE CONSIDERATIONS ... 264
9.2.1 Required range of speech and speakers... 264
9.2.2 Choice of reading passages ... 264
9.2.3 Selection of recording environments ... 265
9.2.4 Time delay between speech and laryngograph sig n als... 265
9.2.5 Effect of head m o v e m e n ts... 266
between the two sig n als... 267
9.2.8 Selection of number of speakers ... 267
9.2.9 Training, preliminary testing and final testing data s e t s 268 9.2.10 Training data ... 268
9.2.11 Preliminary testing data s e t ... 268
9.2.12 Final testing data s e t ... 269
9.3 INPUT SIGNAL CONDITIONING AND RECORDING OF THE DATABASE ... 269
9.3.1 Recording the test datab ases... 269
9.3.2 Choice of sampling rate for digital a c q u isitio n ... 270
9.3.3 Automatic alignment of the speech and laryngograph signals . . 270
9.3.4 Initial bootstrap a lig n m e n t... 271
9.3.5 Checking speech p o la rity ... 271
9.4 USING DIFFERENT PRE-PROCESSING SC H E M E S... 272
9.4.1 The task of the pre-processing stage ... 272
9.4.2 Symmetrical input w in d o w ... 273
9.4.3 Asymmetric input w in d o w ... 273
9.4.5 Direct operation on the sampled speech pressure waveform . . . 274
9.4.6 Filterbank to approximate wide band spectrogram ... 274
9.4.7 Pre-processing using an ’Auditory filterbank’ ... 274
9.6 TRAINING THE MLP CLASSIFIER ... 275
9.6.1 Long training tim e s ... 275
9.6.2 Adaption of the learning rate and the momentum term ... 275
9.6.3 The number of patterns used to estimate weight c h a n g e s 275 9.6.4 Sorting the pattern v e c to r s ... 276
9.7 SELECTIVE EMPHASIS TRAINING OF THE M L P ... 276
9.7.1 Emphasise incorrectly recognized p a tte r n s ... 276
9.7.2 De-emphasis of the importance of boundaries... 277
9.7.3 Faster training with selective emphasis ... 278
9.8 TRAINING DIFFERENT CONFIGURATIONS OF THE MLP-Tx ALGORITHM ... 278
9.8.1 Training different MLP-Tx configurations ... 278
9.8.2 Effect of different updates (patterns per group used for batch
learning) ... 279
9.9 POST-PROCESSING TECHNIQUES ... 279
9.9.1 Task of the post-processor... 279
9.9.2 Threshold with local in h ib itio n ... 280
9.9.3 Secondary network continuity c la s sifie r... 280
9.10 COMPARING BEST MLP-Tx CONFIGURATIONS AGAINST ESTABLISHED TECHN IQUES... 281
9.10.1 Standard fundamental frequency analysis techniques for comparison ... 281
9.10.2 Discussion of r e s u lts ... 282
9.10.3 Conclusions ... 283
CHAPTER 10: EXAMINATION OF MLP-Tx NETWORK FU N C T IO N 303 10.1 EXAMINING MLP O U T PU T S... 303
10.1.1 Introduction ... 303
10.1.2 Analysis of correct output from the MLP-Tx a lg o rith m 303 10.1.3 Analysis of failures of the MLP-Tx algorithm ... 304
Double-pulse generation at tra n sitio n s... 304
Reduction in pulse height at transitions ... 305
10.2.1 Weight patterns represented as Hinton d ia g ra m s ... 306
10.2.2 Weight patterns represented as time-waveforms ... 306
10.2.3 Power spectra of the weight time-waveforms ... 307
10.2.4 Internal activations ... 307
Normal operation ... 307
Internal activation during double pulse error condition ... 308
CHAPTER 11: REAL-TIME IMPLEMENTATION OF THE MLP-Tx ALGORITHM ... 334
11.1 COMPUTATIONAL LOAD CO NSIDERATIONS... 334
11.1.1 Introduction ... 334
11.1.3 Desirability of integer arithmetic and a look-up ta b le ... 335
11.1.4 Limit on computation ... 335
11.1.5 Processor cycles for f il t e r s ... 336
11.1.6 Processing load for previous filterbank s y s t e m ... 336
11.1.7 Processor cycles for M L P ... 336
11.1.8 Reduced computation filterbank ... 337
11.1.9 Reduced computation MLP ... 337
11.2 SIMULATION OF HARDWARE IM PLEM ENTATION 338 11.2.1 Introduction ... 338
11.2.2 Investigation into the effects of quantization... 338
11.2.3 Qualitative evaluation of the effect of quantization ... 339
11.2.4 Quantitative assessment of the effect of qu an tizatio n... 339
11.2.5 Investigation into the effects of using a look-up table ... 340
11.2.6 Qualitative evaluation of the effect of a look-up table ... 340
11.2.7 Quantitative assessment of the effect of a look-up t a b l e 341 11.3 PERCEPTUAL EVALUATIONS OF THE REAL-TIME MLP-Tx ALGORITHM IN THE EPI HEARING A I D ... 341
11.3.1 Introduction ... 341
MLP-Tx algorithm used for perceptual te s ts ... 342
11.3.2 Perceptual assessment t a s k ... 342
11.3.3 Comparing amplified speech presentation against fundamental period estimate presentation using the MLP-Tx a lg o rith m 343 11.3.4 Comparing the peak-picker against the MLP-Tx algorithm as the source of fundamental period information ... 344
CHAPTER 12: CONCLUSIONS... 358
12.1 SPEAKER DEPENDENT INITIAL EX PERIM EN TS... 358
12.1.1 Preliminary experiment ... 358
12.2 SPEAKER INDEPENDENT EXPERIMENTS USING REVERBERANT SPEECH ... 358
12.2.1 New d a ta b a s e ... 358
12.2.2 Three types of pre-processing... 359
12.2.3 Selective emphasis training... 359
12.2.4 Frequency contour comparisons ... 359
12.3 REAL TIME IMPLEMENTATION AND PERCEPTUAL RESULTS 360 12.3.1 Real-time im plem entation... 360
12.3.2 Perceptual results for normal subjects and profoundly deaf p a tie n ts ... 360
R E FER EN C ES... 361
APPENDIX A. 1: PATTERN PROCESSING S Y S T E M ... 388
APPENDIX A.2: COMPUTER ANALYSIS PR O C E D U R E S... 396
APPENDIX A.3: TEXT FOR THE RAINBOW P A S S A G E ... 422
APPENDIX A.4: TEXT FOR ARTHUR THE RAT ... 423
APPENDIX A.5: SUBJECT QUESTIONNAIRE FOR R E C O R D IN G S 426 APPENDIX A.6: LIST OF ROOMS USED FOR RECO RD IN G S... 433
APPENDIX A.7: LIST OF FILENAMES AND THEIR CORRESPONDING S P E A K E R S ... 434
APPENDIX A.8: FREQUENCY DISTRIBUTION HISTOGRAMS FOR TRAINING AND FINAL TESTING DATA ... 439
LIST OF FIGURES
Figure 2.1 The speech chain. 54
Figure 2.2 Cross-section through the human vocal tract. 55 Figure 2.3 Variability of formant frequencies across speakers. 56
Figure 2.4 Cross-section through the larynx. 57
Figure 2.5 Front and rear views of the larynx. 58
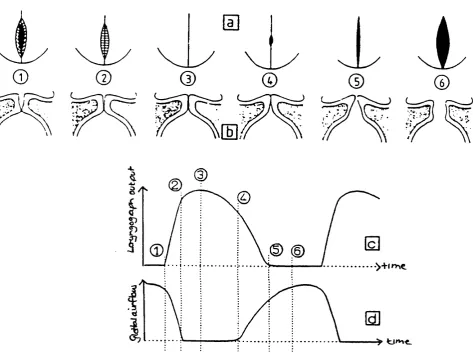
Figure 2.6 The relationship between vocal fold motion and the laryngograph
waveform, during normal speech. 59
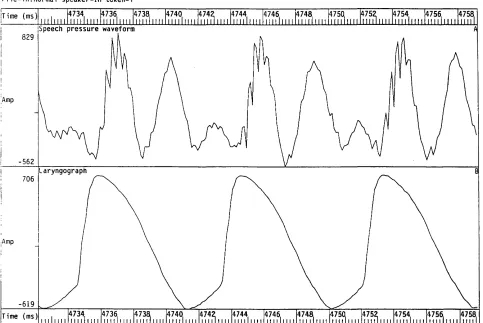
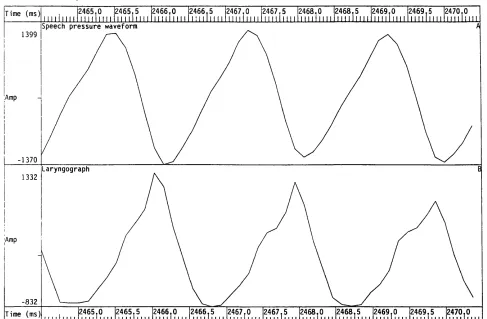
Figure 2.7 Speech pressure waveform and laryngograph waveform for an example
of normal speech. 60
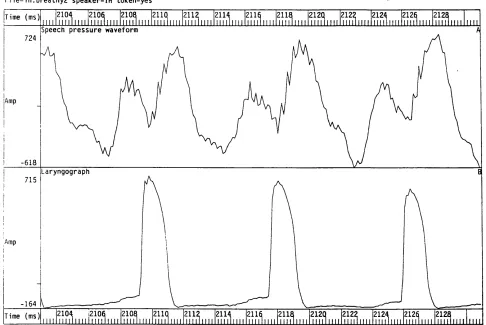
Figure 2.8 Speech pressure waveform and laryngograph waveform for an example
of breathy voice quality. 61
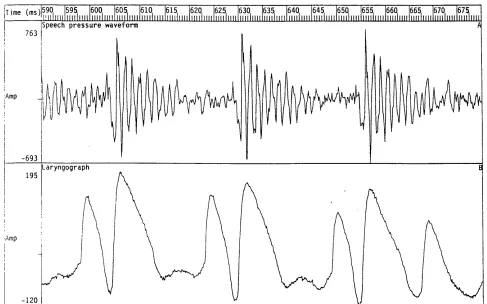
Figure 2.9 Speech pressure waveform and laryngograph waveform for an example
of creaky voice quality. 62
Figure 2.10 Speech pressure waveform and laryngograph waveform for an
example of falsetto voice quality. 63
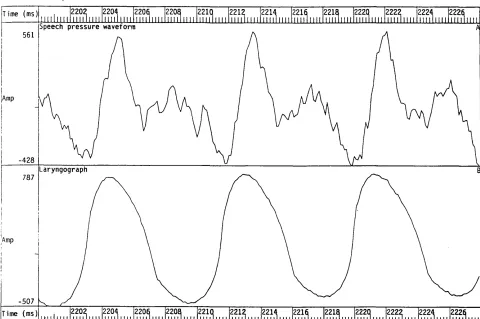
Figure 2.11 Speech pressure waveform and laryngograph waveform for a voiced
fricative. 64
Figure 2.12 Unwanted excursion in laryngograph output waveform. 65 Figure 2.13 Evidence of vocal fold vibration in the speech pressure waveform, but
little in the laryngograph signal. 66
Figure 2.14 Evidence of vocal fold vibration in the laryngograph waveform, but only a small amount in the acoustic speech pressure waveform. 67
Figure 3.1 Diagram showing voice source parameters. 84
Figure 3.2 Speech pressure waveform exhibiting two peaks per fundamental
period. 85
Figure 3.3 Temporally simple speech pressure waveform. 86 Figure 3.4 Block diagram illustrating the basic stages involved in speech
fundamental frequency/period, estimation. 87
Figure 4.1 Classification of time-domain fundamental period estimation
algorithms. 119
Figure 4.2 Sub-classification of fundamental harmonic detection techniques using
threshold analyzers. 120 Figure 4.3 Effect of rapid changes in formants on the estimated fundamental
frequency derived using a threshold analysis. 121
Figure 4.4 Sub-classification of structural analysis fundamental period estimation
techniques. 122
Figure 4.5 Operational waveforms in the peak-picker. 124 Figure 4.6 Generation of period twins in the pitch chaining algorithm. 124 Figure 4.7 Schematic diagram for the Gold-Rabiner algorithm. 125 Figure 4.8 Relationship between measurements - n^ and the corresponding
features of the waveform used in the Gold-Rabiner algorithm. 126 Figure 4.9 Behaviour of basic measurements in the Gold-Rabiner algorithm for
two simple waveforms. 126
Figure 4.10 Operation of the basic extractor used in the Gold-Rabiner
algorithm. 127
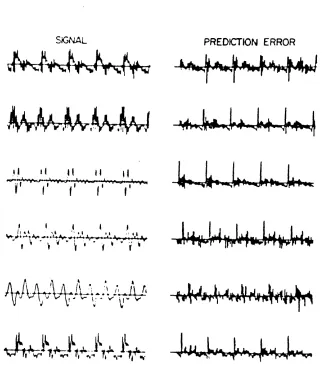
Figure 4.11 Sub-classification of temporal simplification techniques. 128 Figure 4.12 Speech signals and their corresponding LPC prediction error. 129 Figure 4.13 Schematic diagram for multi-channel epoch detector used by
Yaggi. 130
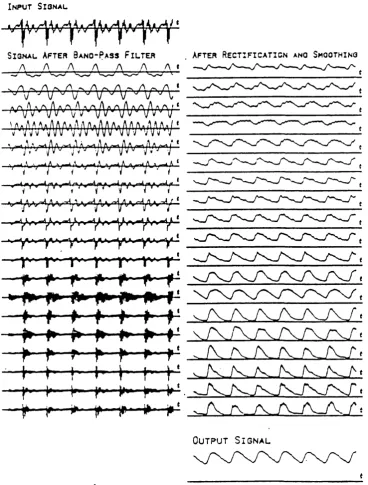
Figure 4.14 Operational waveforms from multi-channel epoch detector used by
Yaggi. 131
Figure 4.15 Output waveforms from epoch detector based on the identification of
discontinuities in the speech waveform. 132
Figure 4.16 Sub-classification of short-term fundamental frequency estimation
algorithms. 133
Figure 4.17 Schematic diagram for a frequency-domain fundamental frequency
analyzer. 134
Figure 4.18 Voiced speech and its corresponding short-term auto-correlation. 135
Figure 4.19 Function used to centre-clip speech. 136
Figure 4.20 Effect of centre clipping on a simplified speech waveform. 136
Figure 4.21 Block diagram of the SIFT algorithm. 137
Figure 4.22 Example of the spectral compression to estimate fundamental
Figure 4.23 Logarithmic power spectrum of voiced speech and its corresponding
cepstrum. 139
Figure 4.24 Block diagram of the cepstrum algorithm. 140 Figure 5.1 Laryngograph waveform exhibiting single well-defined peak differential
per excitation period. 146
Figure 5.2 Laryngograph waveform exhibiting poorly defined peak differential per
excitation period. 147
Figure 5.3 Flow-chart of the operation of the automatic fundamental period
estimation program. 148
Figure 5.4 Typical operator’s view using the interactive period marker estimation
program (Ixia). 149
Figure 6.1 Illustration of types of errors used to quantify a test frequency
contour. 166
Figure 6.2 Effect of relative time delay on standard deviation of the fine frequency
differences. 167
Figure 6.3 Illustration of a required information from period marker
comparisons. 168
Figure 6.4 Plot of the cross-correlation between reference period markers and
MLP-Tx test period markers. 169
Figure 6.5 Illustration of the operational stages in the fundamental period marker
comparisons. 170
Figure 6.6 Illustration of the time-warp path resulting from real period marker
data. 171
Figure 6.7 A close-up of the time-warp path shown in figure 6.6 172 Figure 7.1 An example of a 2-dimensional patterns representing the height and
weight of a group of subjects. 221
Figure 7.2 Schematic diagram of all the operational stages in a pattern recognition
system. 222
Figure 7.3 Schematic diagram for a multi-class Bayes’ pattern classifier system. 223
Figure 7.4 Schematic diagram for a perceptron. 224
Figure 7.5 Comparison of threshold function with a sigmoid function. 225 Figure 7.6 Diagram showing the pattern classifier decision boundaries required to
solve the XOR problem. 226 Figure 7.7 Schematic diagram of multi-layer perceptron with different number of
layers. 227
Figure 7.8 Schematic diagram showing relationship between decision boundaries
and layers in the multi-layer perceptron. 228
Figure 7.9 Flow chart for multi-layer perceptron learning algorithm using back-
propagation. 229
Figure 7.10 Flow chart for multi-layer perceptron learning algorithm using back-
propagation with selective emphasis. 230
Figure 8.1 Voicing determination by envelope detection of the laryngograph
waveform. 246
Figure 8.2 Schematic diagram for the JSRU 19-channel vocoder. 247 Figure 8.3 Receiver operating characteristics for voicing estimation algorithms
operating on anechoic speech. 248
Figure 8.4 Receiver operating characteristics for voicing estimation algorithms operating on speech with additive white noise at OdB SNR. 249 Figure 8.5 Wideband spectrogram (300Hz bandwidth) for a short section of male
speech. 250
Figure 8.6 Input and output signals for initial wideband filterbank MLP-Tx
algorithm. 251
Figure 8.7 Very first output generated by the MLP-Tx algorithm. 252 Figure 8.8 Schematic diagram of the MLP-Tx algorithm used for the first
experiments employing a moderately sized database. 253 Figure 8.9 Overall system schematic diagram for the various stages in the MLP-
Tx fundamental period estimation system. 254
Figure 8.10 Power spectrum for the canteen noise. 255
Figure 8.11 Plot showing the output from the wideband MLP-Tx algorithm on
20dB SNR speech. 256
Figure 8.12 Plot showing the frequency contour from the MLP-Tx algorithm on
20dB SNR speech. 257
Figure 8.13 Output from the MLP-Tx algorithm operating on speech with added
Figure 8.14 Same as in figure 8.13, but with an expanded time-scale. 259 Figure 8.15 Frequency contour from the MLP-Tx algorithm operating in the
presence of "canteen noise" at a OdB SNR. 260 Figure 8.16 Receiver operating characteristic for the MLP-Tx algorithm and the
peak-picker. 261
Figure 8.17 Jitter histograms for the MLP-Tx algorithm and the peak-picker. 262 Figure 9.1 The input conditioning strategy used for the MLP-Tx algorithm. 284 Figure 9.2 Plot illustrating the effect of speech inversion on frequency
contours. 285
Figure 9.3 Plot showing the different occurrence times of MLP-Tx period marker
estimates, depending upon the speech polarity. 286
Figure 9.4 Use of the cross-correlation between the reference and MLP-Tx period
markers as a means of polarity determination. 287
Figure 9.5 Alignment achieved using cross-correlation between the MLP-Tx and
laryngograph period markers. 288
Figure 9.6 Different pre-processing schemes used for the MLP-Tx algorithm. 289 Figure 9.7 Different window configurations tested with the MLP-Tx algorithm. 290 Figure 9.8 Output waveforms from wideband filterbank. 291 Figure 9.9 Output waveforms from auditory filterbank. 292 Figure 9.10 Diagram showing a piece of input speech and the corresponding
wideband and auditory filterbank outputs. 293
Figure 9.11 Definition of the regions around period excitation time markers. 294 Figure 9.12 Identification of thresholds around a period excitation marker. 294 Figure 9.13 Flow diagram for the operation of simple threshold with local
inhibition post-processing algorithm. 295
Figure 9.14 Schematic diagram illustrating principle of using a secondary pattern
classifier for post-processing. 296
Figure 9.15 Bar-graph showing the gross errors generated by the six algorithms
on final test data. 297
Figure 9.16 Bar-graph showing the chirp errors generated by the six algorithms
on final test data. 298
Figure 9.17 Bar-graph showing the drop errors generated by the six algorithms on
final test data. 299 Figure 9.18 Bar-graph showing the standard deviation of fine frequency
differences generated by the six algorithms on final test data. 300 Figure 9.19 Bar-graph showing the voiced to unvoiced errors generated by the six
algorithms on final test data. 301
Figure 9.20 Bar-graph showing the unvoiced to voiced errors generated by the six
algorithms on final test data. 302
Figure 10.1 Diagram showing normal response of direct speech MLP-Tx
algorithm. 310
Figure 10.2 Diagram showing same as figure 10.1, but with an expanded time-
scale. 311
Figure 10.4 Diagram showing strongest erroneous double-pulse response of direct speech MLP-Tx algorithm at nasal-vowel transitions. 313 Figure 10.5 Diagram showing same as figure 10.4, but with an expanded time-
scale over initial nasal .."na.." transition region. 314 Figure 10.6 Diagram showing erroneous generation of unwanted period marker
pulse from the direct speech MLP-Tx algorithm on male speech. 315 Figure 10.7 Same as figure 10.6 with expanded time-scale. 316 Figure 10.8 Erroneous reduction on MLP-Tx pulse height at nasal-vowel transitio3J7
Figure 10.9 Effect of using a secondary MLP-Tx algorithm trained on the output from a primary (that is, normal) MLP-Tx algorithm. 318 Figure 10.10 Same as figure 10.9 with expanded time-scale. 319 Figure 10.11 Weight patterns for the original wideband (9-channel) filterbank
MLP-Tx algorithm. 320
Figure 10.12 Weight diagrams as in figure 10.11, but this time for nodes 5-9 in
layers 1-2. 321
Figure 10.13 Weight diagrams as in figure 10.11, but this time for nodes 0-9 in
layers 2-3. 322
Figure 10.14 Weight diagrams as in figure 10.11, but this time for output node in
layers 3-4. 322
Figure 10.15 Weights in direct speech MLP-Tx algorithms, with no hidden units,
Figure 10.16 Power spectrum corresponding to the weight time-waveform shown
in trace A in figure 10.15. 324
Figure 10.17 First layer weights for MLPs with 10 hidden units in direct speech
MLP-Tx, represented as time-waveforms. 325
Figure 10.18 First layer weights for MLPs with 5 hidden units in direct speech
MLP-Tx, represented as time-waveforms. 326
Figure 10.19 The power spectrum corresponding to the weight time-waveform for hidden node 0 shown in trace A in figure 10.18. 327 Figure 10.20 The power spectrum corresponding to the weight time-waveform for
hidden node 1 shown in trace B in figure 10.18. 327 Figure 10.21 The power spectrum corresponding to the weight time-waveform for
hidden node 2 shown in trace C in figure 10.18. 328 Figure 10.22 The power spectrum corresponding to the weight time-waveform for
hidden node 3 shown in trace D in figure 10.18. 328 Figure 10.23 The power spectrum corresponding to the weight time-waveform for
hidden node 4 shown in trace E in figure 10.18. 329 Figure 10.24 The output from the first layer nodes in the original wideband
filterbank (9-channel) MLP-Tx algorithm. 330
Figure 10.25 The output from the second layer nodes in the original wideband
filterbank (9-channel) MLP-Tx algorithm. 331
Figure 10.26 Output from first layer units in direct speech MLP-Tx algorithm,
showing double-pulse error condition. 332
Figure 10.27 Same as in figure 10.26, but with an expanded time-scale. 333 Figure 11.1 Schematic diagram for the MLP-Tx algorithm of reduced
computational complexity. 345
Figure 11.2 Diagram illustration the effect of quantization. 346 Figure 11.3 Bar-graph showing the gross errors generated for different levels of
quantization on women evaluation data set. 347
Figure 11.5 Bar-graph showing the chirp errors generated for different levels of
quantization on women evaluation data set. 348
Figure 11.6 Bar-graph showing the drop errors generated for different levels of
quantization on women evaluation data set. 348
Figure 11.7 Bar-graph showing the voiced-to-unvoiced errors generated for different levels of quantization on the women evaluation data set. 349
Figure 11.8 Bar-graph showing the unvoiced-to-voiced errors generated for different levels of quantization on the women evaluation data set. 349 Figure 11.9 Illustration of the effect of look-up table size on the output from the
reduced computational complexity MLP-Tx algorithm. 350 Figure 11.10 Bar-graph showing the gross errors generated for different look-up
table sizes. 351
Figure 11.11 Bar-graph showing the standard deviation of fine frequency differences errors generated for different look-up table sizes. 351 Figure 11.12 Bar-graph showing the chirp errors generated for different look-up
table sizes. 352
Figure 11.13 Bar-graph showing the drop errors generated for different look-up
table sizes. 352
Figure 11.14 Bar-graph showing the voiced-to-unvoiced errors generated for
different look-up table sizes. 353
Figure 11.15 Bar-graph showing the unvoiced-to-voiced errors generated for
different look-up table sizes. 353
Figure 11.16 Overall correct and voicing information reception in audio-visual consonant identification using the MLP-Tx algorithm and direct speech
presentation for subject SI. 354
Figure 11.17 Overall correct and voicing information reception in audio-visual consonant identification using the MLP-Tx algorithm and direct speech
presentation for subject SI 1. 355
Figure 11.18 Overall correct and voicing information reception in audio-visual consonant identification using the MLP-Tx algorithm and the peak-picker
algorithm for two normal subjects. 356
CHAPTER 1: THE AIMS OF THE WORK
1.1 AIMS OF THE WORK
1.1.1 Speech fundamental period estimation
This work is concerned with the design and development of an algorithm (MLP-Tx) that can perform speech fundamental period estimation. The algorithm has been specifically developed to perform fundamental period estimation for a signal processing hearing aid designed by the EPI group at UCL which seeks to provide from the acoustic speech signal an output which corresponds to that from the laryngograph (Walliker et al., 1986; Rosen et al., 1987).
The novel aspect of the work stems from the fact that the task is formulated as a pattern recognition problem and the MLP-Tx algorithm, based on a multi-layer perceptron pattern classifier, was trained-by-example to perform the required task. The data that was used to train the algorithm was composed of speech that was semi-automatically labelled for fundamental period location using a pair of algorithms that made use of the output of a laryngograph, which was recorded simultaneously with the speech. The fundamental periods were delineated in terms of the closure of the vocal folds as a function of time, as defined by the location of the maximum positive differential in the output of the laryngograph.
One of the strengths of the MLP-Tx algorithm is that the fundamental period estimates are made on a cycle-by-cycle basis. Consequently irregularities in vocal fold vibration can be detected by the algorithm, whereas many other algorithms would tend to smooth the period values. Creaky voice can be dealt with effectively using the MLP-Tx algorithm, whereas many other algorithms treat this important larynx excitation as being unvoiced due to its intrinsic irregularity.
The MLP-Tx algorithm is also suitable for real-time implementation because of the simple uniform structure of the MLP, and the inherently small (about 10ms) input to output delay. This small delay is important to prevent a lack of synchronization between the speech signal and gestures and lip movements made by a speaker. A practical real-time implementation for use in hearing aids for the profoundly hearing impaired has been carried out in conjunction with John Walliker (Howard & Walliker
1989; Walliker & Howard, 1990).
There are many other applications for fundamental period estimation algorithms, some of which are discussed below, since this an important component in the description of vocal fold vibration. There is a genuine need for algorithms that are robust and will operate in real environmental conditions.
It is important to be able to assess the performance of a fundamental period estimation algorithm, so that improvements can be evaluated and so that its performance with respect to other techniques can be gauged. To this end some work on speech fundamental period estimation algorithm comparison techniques was also carried out.
1.1.2 Applications of speech fundamental period estimation
Cochlear implants
One application for algorithms that can perform speech fundamental period estimation is in signal processing hearing aids (Fourcin et al., 1983). Such hearing aids are of value to the profoundly deaf. They operate by extracting basic elements of speech and presenting this reduced representation in a suitable format to the patient either acoustically or directly onto the cochlea by electrical stimulation. It has been shown that presenting voice fundamental period feature alone can be more beneficial to some patients than presenting an amplified version of the whole speech signal (Rosen et al., 1987). The main reason for this is that the auditory systems of this class of patients has a very restricted channel capacity which is less than that required to encode adequately the whole speech signal. Consequently presentation of the whole speech signal maybe
confusing and even painful, whereas a basic fundamental period (frequency) signal can be made much easier for the patient to interpret usefully.
In the case of single channel cochlear implants, the information from the pattern element extractor sent into the hearing system of the patient must all be present in the one signal (unlike in multi-channel implants). This is the approach adopted by the EPI group at UCL (Walliker et al., 1986). The elements used by the EPI group are chosen to be simplified aspects of speech that, when suitably coded, are matched to the residual discriminative abilities of the patients (Fourcin, 1979; Faulkner, Ball & Fourcin, 1990; Walliker et al., 1985).
Speech fundamental frequency is a particularly useful feature to present to the profoundly deaf because it is almost completely invisible to the lip-reader and consequently it provides an aid to lipreading and the development of voiced speech production. There is particular benefit to be derived from the use of an algorithm that can perform fundamental period estimation on a cycle-by-cycle basis for such signal processing hearing aid applications. This is because preservation of the irregularity present in the original speech excitation is beneficial because the patient can then hear creaky and other irregular voice characteristics (Abberton et al., 1985). For these applications the algorithm must run in real-time with a processing delay between input and output should be as small as possible, and no more that a maximum of 40ms, or the signal looses its usefulness (McGrath & Summerfield ,1985). The MLP-Tx algorithm is therefore particularly suitable for such applications, because it possesses both of these qualities.
Speech Coding
techniques in speech processing that will reduce the data-rate necessary for communication by speech, since it reduces costs.
Much work has been carried out in the field of speech coding with the goal of reducing the data-rate needed for speech transmission. For example especially important contributions have been made by Dudley (1939), Gabor, (1947), Lawrence, (1953), Schroeder (1966), and Gold & Rader, (1967). In essence, such schemes work by taking advantage of the observation that there is a correlation between adjacent time samples of the speech signal. Consequently it is not necessary to transmit each original data sample, as would be the case if all the data samples were un-correlated.
Many coding schemes that aim to reduce the data-rate in the transmission of speech assume a source-filter model of speech production and require the determination of speech fundamental frequency (Willis, 1829; Fant, 1960). Such schemes can be considered as speech analysis/synthesis systems, and include Gabor’s system, Dudley’s vocoder, the channel vocoder (Flanagan, 1972) and copy synthesis (Lawrence, 1953).
Speech and Speaker Recognition
Another application of information relating to speech excitation is in automatic speech recognition. The incorporation of such information into the recognition process has been demonstrated as beneficial to the recognition task (Atal, 1974; Rosenberg & Sambur,
1975). In addition, fundamental period information has been shown to be useful in speaker recognition, by both man and machine (Atal, 1972; Abberton, 1974; Abberton, 1976).
Glottal-synchronous speech analysis
The individual identification of speech fundamental period is also useful in providing a means to carry out glottal-synchronous analysis o f speech. The idea behind this technique is that when, for example, performing a short-time spectral analysis of the speech, the window for the analysis is selected on a period-by-period basis to include
I rMoufc. only one period, rather than using a fixed window size for the analyses. It has been found that such an approach can give better estimates of the vocal tract transfer function than using fixed window analysis (Hunt & Harvenberg, 1986; Pearce & Whitaker, 1986; Hunt, Zwierzynski & Carr, 1989). To carry out this task requires the identification of the vocal fold closure points, and this is on of the tasks performed by the MLP-Tx algorithm.
1.2 ORGANIZATION OF THE THESIS
The body of the thesis is organized in the following manner:
Chapter 2 provides a brief discussion of acoustic, articulatory and phonetic descriptions of the speech signal. Properties of the voice source are then examined, with particular reference to their correlates with the output of a laryngograph.
Chapter 3 explores some of the issues involved in speech fundamental frequency and period estimation. The basic requirements for algorithms that are to perform such a task are discussed and these include the required frequency resolution for a given application and the benefits of average or cycle-by-cycle estimates. A description of the different approaches used in fundamental frequency estimation is then given.
Chapter 4 gives a more detailed discussion of the operation of some established techniques used for speech fundamental frequency and period estimation. Among those mentioned are the Gold-Rabiner algorithm, the SIFT algorithm, Auto-correlation analysis and the Cepstrum algorithm. Finally, the use of the laryngograph for fundamental period estimation is introduced.
Chapter 6 describes some standard techniques for assessing the performance of speech fundamental frequency estimation algorithms. In addition, some methods newly developed for the present work are discussed and explained. Details of how both established and new sets of comparisons were implemented is then given.
Chapter 7 provides a brief overview of pattern recognition. Some classical approaches to pattern classification are discussed and these include the Nearest neighbour and k- means classifiers, and classification based on the use of likelihood functions, such as the Bayes’ classifier. The more recent field of artificial neural networks is then introduced. There is then a more in-depth description of a currently popular connectionist technique, the multi-layer Perceptron (MLP). Methods for reducing training times for the MLP are then described.
Chapter 8 formulates speech fundamental period estimation as a pattern recognition problem. The basic idea is discussed and qualitative results to some initial experiments are given.
Chapter 9 investigates the problem of speech fundamental period estimation using pattern classification in greater depth. Issues concerning input pre-processing and output post-processing are discussed. The requirement for the appropriate databases, to train and test the MLP-Tx algorithm, are examined. These issues are experimentally investigated, and quantitative results are given for different system configurations. A final set of experiments was then carried out on a different set of test data, in which three of the best MLP-Tx algorithm configurations were compared with established fundamental frequency estimation techniques.
Chapter 10 takes a closer look at the operation of some of the MLP networks. The patterns of MLP weights are displayed and the intermediate node activations are given for some of the algorithms during the process of detecting a fundamental period epoch marker. The sources of error in the MLP-Tx algorithm are examined, to give a basis for future improvements.
Chapter 11 considers the problems involved of running the MLP-Tx algorithm in real time using a digital signal processing chip. Computational complexity is then considered and a reduced computation algorithm is described. The effects of quantizing the weights and using a look-up table for the sigmoid non-linearity are investigated. Perceptual evaluation by Dr. Andrew Faulkner are then described briefly with normal and profoundly deaf listeners of the real-time MLP-Tx algorithm in its intended role in the EPI signal processing hearing aid. The results obtained demonstrate that the real time MLP-Tx algorithm outperforms the peak-picker algorithm in the presence of pink noise.
Chapter 12 then gives a brief review of the main points emerging from the thesis.
CHAPTER 2: THE PRODUCTION AND DESCRIPTION OF SPEECH
2.1 SPEECH PRODUCTION
2.1.1 Introduction
This chapter provides a basis for the subsequent discussion of the speech related problems encountered as different stages of the work in this thesis. Firsdy there is a general discussion of the origin and nature of the speech signal. There then follows articulatory, phonetic and mathematical descriptions of speech. Finally, voiced speech is discussed together with its relationship to the output from a laryngograph.
2.1.2 The speech signal
Speech provides human beings a means for the transmission of a complex message using sound. It is a signal that is very resistant to interference. Speech may still be intelligible even when the signal is distorted or heavily contaminated with interfering noise, although the quality of the speech will be reduced by such a process.
2.1.3 Origins of speech
The development of spoken language in humans was limited by constraints of evolution (Borden & Harris, 1980). Speech communication must be consistent with the available broadcast facilities (the speech centres in the brain and human vocal apparatus) and decoding system (the human auditory system). The organs of the body used for the production of speech, the vocal organs and respiratory apparatus, were originally evolved to permit breathing of air and the chewing and swallowing of food. However in the course of evolution, they have also been used to provide a means of communication using sound.
The use of speech as a means of communication is only possible because the code for the signal, that is the language system, is known to both speaker and listener. This
system determines the important sound contrasts and prosody.
2.1.4 The hierarchical nature of the speech signal
The hierarchical nature of the speech signal arises from its structured generation process (Borden & Harris, 1980). Some of the stages are illustrated in figure 2.1. Within the human brain, the speech centres contain information concerning the generation of speech. The phonological system used, the grammar and syntax of the language and the vocabulary are all implicitly represented. A possible description of the processes involved in speech production could be as follows: Let us suppose the top of this structure involves a cognitive level of representation where different system activity relates to different "ideas". The first step in speech generation involves a process which effectively arranges ones thoughts into the desired linguistic form and selects appropriate words and phrases to describe one’s intended message. In addition these units must then be put into the correct temporal order as required by the grammar of the language. Then consideration to the different sound contrasts necessary for the given language and accent must be made. This could be thought of as corresponding to a phonemic level of processing. The message must next give rise to the signals necessary to control the muscles in the vocal apparatus. Finally, the physical behaviour of air in the vocal apparatus gives rise to an acoustic disturbance that radiates from the lips, and/or nose, carrying the message. The overall result of this coordinated activity is the radiation of sound from the speaker, a small part of which finally reaches the listener. Thus in the speech production process, there is a transformation between a linguistic to a physiological to an acoustic representation of the message. These successive layers form a hierarchically organised structure which can be used as a basis for similarly structured computer-based analysis of speech, as described in the next section.
2.1.5 Descriptions of the speech signal
There arc several different ways in which one can describe speech. One may use the ideas of information theory and consider speech from the point of view of its information content (Shannon, 1968). Alternatively one may characterize speech as a signal which somehow carries the message information and look at properties of the acoustic speech waveform using parametric descriptions of the acoustic waveform (Rabiner & Schafer, 1978). In addition, one may adopt the approach of phoneticians and describe speech in terms of phonetic sound qualities which are related to the actions of the articulators in the vocal apparatus (Wells & Colson, 1971).
2.1 Descriptions of speech
2.2.1 Articulatory Levels of Description
One also can describe speech at the articulatory level, in terms of the behaviour of the anatomy of the vocal tract (Wells & Colson, 1971). The vocal apparatus, a cross-section through which is given in figure 2.2, provides a means by which nerve impulses from the brain may give rise to the acoustic speech signal. The final speech pressure waveform that is radiated at the lips and nose will depend upon the nature of the excitation and also the position of the articulators. Because the vocal tract transfer function and the excitation arc both a function of time, the spectrum of speech is not stationary. By controlling the action of both the articulators and the vocal folds simultaneously, the brain may thus generate a signal in which the underlying message has been suitably coded for acoustic transmission.
The vocal apparatus is a complex sound generator. For voiced speech production, the larynx is the source of the sound and the vocal tract is a time-varying acoustic filter which modifies the laryngeal excitation depending on the position of the articulators. Voiced speech excitation is discussed in more detail in a later section. For voiceless excitation, the sound source is due to turbulent airflow at a point of construction in the vocal tract, and the location of this point is again dependent upon the position of the
articulators. Frication occurs only when the flow of air through constrictions in the vocal tract exceeds a certain critical value. Above this value, determined by the Reynolds number for air, the flow of air becomes turbulent. This turbulence gives rise
car'd to an acoustic disturbance that is noise-like in character. That is, un-correlated with a/s. flat spectrum.
The power needed to generate the sound largely comes from the breathing mechanism; the sources of air are often referred to as the air streams. The most common air stream due to exhaling from the lungs is known as pulmonic egressive. In addition there are oral and pharyngeal air-streams due to air movement caused by the action of the mouth and pharynx respectively. The respiratory system can be controlled by the brain so that breathing fits in to suit the speech. Mainly exhaled air is used for speaking, and expiration may last over 10 seconds in some cases.
2.2.2 The vocal tract
The vocal tract consists of two irregular tubes. There is a passage that connects the larynx to the pharynx, to the mouth and then to the outer air. In addition, when the soft-palate is lowered, there is another passage between the larynx to the nostrils to the outer air. The acoustic behaviour is the result of reflections and standing waves in these tubes and is dependent on the natural frequencies of vibration and damping within the system.
The dimensions of the vocal tract determine its resonant, or formant, frequencies. The relationship between these resonances is known as the formant structure. The vocal tract can be controlled by will to generate changes in this formant structure that are perceptibly different to a listener by the action of different articulators. Formant structure is important because it provides one means to distinguish sounds.
addition, the opening at the lips can be altered, the soft-palate can be opened and closed, and the jaw can be raised and lowered. The vowel systems in languages exploit all of these methods to change the formant structure.
The motion of the articulators is constrained by their anatomy and the muscles that move them. Consequently they can only move at a limited rate from one position to another. As a result of this the present location of the articulators will have some effect on their future position. These effects manifest themselves in the speech signal as assimilation effects.
2.3 PHONETIC LEVELS OF DESCRIPTION
A description of speech that is related to the articulatory descriptions is one based upon the phonetic qualities of speech (Wells & Colson, 1971; O ’Connor, 1973; Ladeford, 19^5). The field of phonetics is the study and description of speech sounds. It is concerned with what sounds we produce and how we produce them.
Phonetic descriptions are based on perceptible differences in the way the vocal tract of the speaker is used to produce speech sounds. Most languages, including English, can be described in terms of a set of distinctive sound units that are known as phonemes. A table of the phonemes of English, together with examples of them, is given in table 2.1.
A phonetician can write down a representation of speech sounds using a phonetic transcription, which consists of a set of symbols. At the segmental level these symbols indicate the place and manner of articulation as well as the presence or absence of voicing. The manner of articulation refers to the kind of articulation used, for example nasal, rolls, plosive, lateral, affricate. A description of the setting of the lips is also important and it is required to know their rounding, spreading and protrusion. Suprasegmental aspects of speech, such as the intonation of an utterance has a linguistic component that may be described in terms of a fall, rise, rise-fall, fall-rise, etc.
2.3.1 Phonemes •
The important point about phonemes is that they are sound units that are contrastive with respect to one another and can be used to discriminate between words. A phonetician shows that two sounds (allophones) are phonemes by finding what is known as a minimal pair to demonstrate that a contrast exists between them. This is a pair of different words that are distinguished on the basis of the phoneme under investigation. The contrastiveness of a particular pair of sounds depends upon the given language and even the dialect Consequently a given phonemic transcription system may not be suited for transcribing other languages. Phonemes can themselves be classified into vowels, diphthongs, semivowels and consonants.
2.3.2 Allophones
A phoneme has variants known as allophones. The allophones of a phoneme constitute a set of sounds that do not change the meaning of a word, are similar to each other and occur in phonetic contexts different from one another (Ladefoged, 1975).
The allophones belonging to a given phoneme may either be arranged into complementary distribution or in free variation. If two allophones are in complementary distribution, this refers to the fact that the particular allophone used is dependent on the context (that is, the neighbouring phonemes). If two allophones are in free variation, the particular allophone used is freely selected and not dependent on context. Sounds that are in complementary distribution or free variation are only said to represent the same phoneme if they are phonetically similar. That is, they must have most of their phonetic features in common and they must sound similar to native speakers of the language.