Dependence of EC-Driven Current on the EC-Wave Beam
Direction in LHD
∗
)
Yasuo YOSHIMURA, Shin KUBO, Takashi SHIMOZUMA, Hiroe IGAMI,
Hiromi TAKAHASHI, Masaki NISHIURA, Satoru SAKAKIBARA, Kenji TANAKA,
Kazumichi NARIHARA, Takashi MUTOH, Hiroshi YAMADA, Kazunobu NAGASAKI
1),
Nikolai B. MARUSHCHENKO
2)and Yuri TURKIN
2) National Institute for Fusion Science, Toki 509-5292, Japan1)Institute of Advanced Energy, Kyoto University, Uji 611-0011, Japan
2)Max-Planck-Institut for Plasmaphysik, EURATOM Association, TI Greifswald, Germany
(Received 27 December 2010/Accepted 29 March 2011)
Electron cyclotron current drive (ECCD) experiments were conducted in the Large Helical Device to in-vestigate the characteristics of EC-driven current and its profile and the possibility of controlling current and rotational transform profiles by ECCD. Successful ECCD helps prevent magnetohydrodynamic instabilities in plasmas. Scanning the EC-wave beam direction with a long pulse width of 8 s revealed a systematic change in the plasma current. The current’s direction was reversed by a reversal of the beam direction. The direction agrees with the prediction of Fisch–Boozer theory regarding EC-wave beam injection from low-field side. The max-imum driven current is 9 kA with an EC-wave power of 100 kW. The optmax-imum beam direction that maximizes the driven current is investigated with the help of ray-tracing code. This direction depends on the magnetic field, efficiency of power absorption, and fraction of the power absorbed by trapped electrons.
c
2011 The Japan Society of Plasma Science and Nuclear Fusion Research
Keywords: ECCD, electron cyclotron current drive, plasma current, LHD, TRAVIS DOI: 10.1585/pfr.6.2402073
1. Introduction
Electron cyclotron current drive (ECCD) is an attrac-tive tool for controlling plasmas. By using a well-focused EC-wave beam, the plasma current can be driven locally so that ECCD can control the plasma current and rota-tional transform profiles, which affect magnetohydrody-namic (MHD) activity [1-3]. In tokamak-type plasma con-finement devices, the effectiveness of ECCD for stabilizing the neoclassical tearing mode, which is a harmful MHD ac-tivity, has been demonstrated by driving current within the magnetic island [4-7]. Moreover, ECCD can be suitable for supporting ohmic plasma current startup in tokamaks.
Also, for stellarators that do not need plasma current for plasma confinement, the current profile control capa-bility enables fine plasma control. ECCD can maintain an optimized profile of the rotational transformι/2πor locally modify theι/2πprofile. Eliminating or shifting the ratio-nal surfaces suppresses instabilities related to the existence of the surfaces. In the Wendelstein 7-AS stellarator, well-constructed ECCD experiments were conducted and the results were investigated in detail [8]. Moreover, in He-liotron J [9-12] and the Compact Helical System (CHS) [13, 14], ECCD was successfully observed. In the Large
author’s e-mail: [email protected]
∗)This article is based on the presentation at the 20th International Toki
Conference (ITC20).
Helical Device (LHD), ECCD was attempted and changes in the plasma current and rotational transform profiles by co- and counter-ECCD were reported [15, 16].
Constraints on the beta valueβand its local gradient dβ/dρ at ρ = 0.5 (ρ: normalized minor radius) because of the onset of magnetic fluctuations caused by them/n =2/1 unstable mode (m: poloidal andn: toroidal mode numbers) as a dominant component were observed in the LHD [17,18]. Stabilization of them/n=2/1 mode by elim-inating theι/2π=0.5 surface, resulting in the improvement ofβby more than 30%, has been confirmed [17]. The dis-charges described in Refs. [17] and [18] were performed with a magnetic field of 0.5 T for a high-βexperiment, and the ι/2π = 0.5 surface was eliminated using a large co-current drive with tangential neutral beam injection. How-ever, controlling the ι-profile by ECCD would improve plasma performance and provide experimental flexibility in discharges with higher magnetic fields.
This study describes the results of a recent ECCD ex-periment in the LHD and emphasizes the dependence of the plasma current on the EC-wave beam injection angle for ECCD. The LHD and the system for the ECCD ex-periment are briefly described in Sec. 2. Section 3 de-scribes an observation of plasma current in an EC-wave beam injection angle scan experiment. In Sec. 4, the ex-perimental data are compared with results calculated
us-c
2011 The Japan Society of Plasma
ing the TRAVIS code [19], which was originally devel-oped for the investigation of electron cyclotron heating (ECH)/ECCD/electron cyclotron emission (ECE) at Wen-delstein 7-X. The study is summarized in Sec. 5.
2. LHD and ECCD System
The LHD is a helical device with a toroidal period number m = 10 and a polarity of l = 2. A magnetic field structure with a rotational transform for plasma con-finement is generated entirely by external superconducting coils such as two helical coils and three pairs of poloidal coils [20]. The major radius, or the position of the mag-netic axis Rax of the LHD plasma, can be varied in the
range 3.42-4.1 m. The average plasma minor radius is ∼0.6 m, and the maximum magnetic field at the magnetic axis is ∼3 T. These values and the characteristics of the magnetic field structure, such as rotational transform pro-file and magnetic field along the magnetic axis, depend on
Rax.
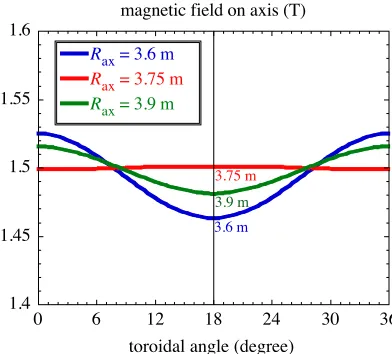
The magnetic field distributions along the magnetic axis for threeRax cases are plotted in Fig. 1 as functions
of toroidal angle. AtRax=3.75 m, the magnetic field on
the magnetic axis is nearly constant whereas atRax=3.6
or 3.9 m, magnetic ripples of∼5% exist. The ECCD ex-periments described in this study were performed with a magnetic configuration ofRax =3.75 m to minimize the
effect of magnetic ripples, that is, mirror-trapping effect on ECCD. The magnetic field on the axis is∼1.5 T, which is the second harmonic resonance field for a frequency of 84 GHz.
The EC-wave beam injection systems on the LHD provide a two-dimensionally steerable mirror that enables beam direction control. One of the beam injection systems used for the ECCD experiment consists of two inner-vessel
Fig. 1 Magnetic field distributions along magnetic axis for mag-netic axis positionsRax=3.6, 3.75, and 3.9 m. AtRax= 3.75 m, magnetic ripples are negligible, minimizing the trapping effect for electrons near the magnetic axis.
mirrors. One of the mirrors transforms the EC wave, which is radiated from a waveguide inserted in the LHD vacuum vessel, to a focused circular Gaussian beam. The other plane mirror is used to change the beam direction. The beam waist of the focused beam has a radius (1/eradius of the electric field amplitude) of 30 mm on the equatorial plane. The injection system is installed at the bottom port of the LHD (1.5-L port), and the beam is injected from the low magnetic field side (LFS). The toroidal angle at the 1.5-L port is defined as 0 (or 36) degrees.
3. Results of ECCD Experiment
3.1
Time evolution of plasma current in
LHD
The EC-wave beam direction should be toroidally tilted for ECCD. Figure 2 shows a schematic represen-tation that illustrates the experimental configuration, EC-wave beam directionN//, and plasma current direction.N//
is defined as the cosine of the angle between the beam unit vector and the tangent of the magnetic axis at the cross point of the beam and the magnetic axis. According to the Fisch–Boozer theory [21], an EC-wave beam injected from the LFS with positive (negative)N//couples primar-ily with electrons moving in the negative (positive)Ip
di-rection, thus the wave is expected to generate an EC-driven current in the positive (negative)Ipdirection.
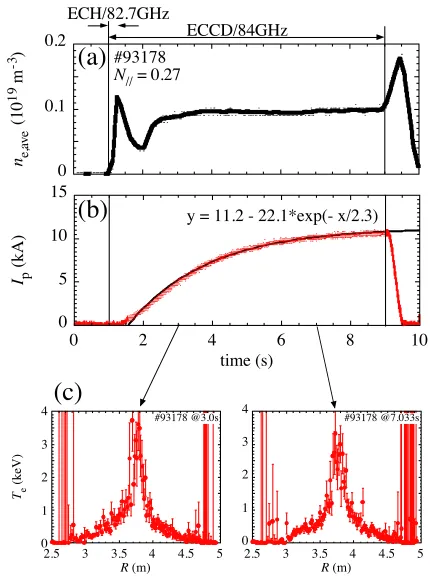
Figure 3 shows an example of discharge waveforms in the ECCD experiment. The plasma was generated at 1 s with 82.7 (220 kW, 300 ms) and 84 GHz (100 kW) EC
Fig. 2 Schematic representation of the experimental configura-tion of EC-wave beam injecconfigura-tion showing the direcconfigura-tion of
Fig. 3 Example of time evolution of the line-average electron density (a), plasma current (b) and electron temperature profiles at 3 and 7 s (c) for positive ECCD (N//=0.27). Density was kept constant at 0.1×10¹⁹m−3, and temper-ature profile was kept nearly constant; current requires
∼6 s to reach saturation. An exponentially saturating curve with a time constant of 2.3 s fits the current evo-lution well.
waves; it was sustained by the 84-GHz wave for 8 s. The 84-GHz wave was obliquely injected and aimed at the magnetic axis withN//of 0.27 and with right-hand circu-lar pocircu-larization, which is close to the X mode in the case of oblique injection. The power absorption efficiency of a pure X-mode wave was calculated to be∼90% using the experimentally obtained plasma parameters and their pro-files. On the other hand, that of an O-mode wave is∼6%. We confirmed that plasmas could not be sustained eff ec-tively by an obliquely injected EC-wave beam with left-hand circular polarization (nearly O-mode).
Except for an initial variation, the line-average elec-tron density,ne,ave, was kept nearly constant at 0.1×10¹⁹
m−3for 6.5 s until the end of the discharge [Fig. 3 (a)]. The
electron temperature,Te, and its peaked profile were also
kept constant with a central electron temperatureTe0 of
∼3.5 keV [Fig. 3 (c)]. On the contrary, the plasma current,
Ip, continued to increase during the discharge. An
expo-nentially saturating fitting curve is also plotted with the time evolution ofIpin Fig. 3 (b); from the fitting, the time
constant of the current saturation is evaluated to be 2.3 s. Here, ne,ave, Te, and Ip are measured with a far-infrared
interferometer, Thomson scattering measurement system, and Rogowski coil surrounding the plasma, respectively.
Applying a simpleL/Rmodel (L: plasma inductance,R: plasma resistance) to the plasma using a volume-average
Te of 0.4 keV, the time constant is estimated to be 4.3 s.
Although a discrepancy exists between the time constants obtained experimentally and with theL/Rmodel, the time constant is in the range of a few seconds or more. Thus, for reliable measurement of the EC-driven current, long-pulse discharges are necessary.
3.2
Dependence of plasma current on
EC-wave beam direction
An N//-scan experiment was performed to optimize the ECCD. The magnetic configuration wasRax=3.75 m
withBax=1.477 T.Baxwas slightly reduced from the
sec-ond harmonic resonant field of the 84-GHz wave, 1.5 T, to consider the Doppler effect. For example, atN// =0.27, electrons having a parallel energy,mev//2/2, of 0.77 keV
sat-isfy the second harmonic Doppler-shifted resonance con-dition 2ωc=ω−k//v//on the magnetic axis. Here,me,v//,
ωc,ω,k//denote the electron mass, electron velocity
par-allel to the magnetic field, angular electron cyclotron fre-quency, angular frequency of the heating wave, and wave number parallel to the magnetic field, respectively.
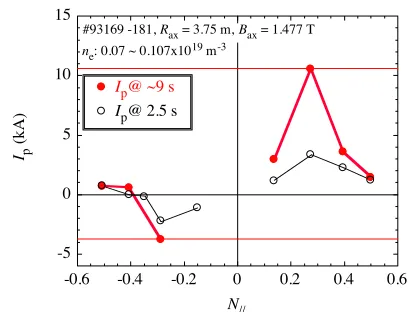
The EC-wave beam direction was toroidally scanned while maintaining the beam’s aiming position on the mag-netic axis. Plasmas were generated and sustained as de-scribed in Sec. 3.1. for Fig. 3. The wave polarization was right-hand circular for non-zeroN//. The electron density was kept rather low at around 0.1× 10¹⁹ m−3. The
de-pendence of the plasma currentIp at 9 and 2.5 s onN//is
plotted in Fig. 4. The lack ofIp data at 9 s means that the
discharge could not be sustained for 8 s. Ip changes
di-rection according to the change in the sign ofN//, and the direction ofIpagrees with that predicted by Fisch–Boozer
theory. AtN//values of 0.27 and−0.29,Ipshows positive
and negative maxima, respectively. Simply assuming the bootstrap currentsIBSof the plasmas with variousN//to be
equal, andIBS =∼1 kA consideringIpvalues at large|N//|,
the maximum driven current IECCD in the positive Ip
di-rection is estimated to be∼9 kA, and the maximumIECCD
in the negativeIpdirection is∼ −5 kA. A positive and low
IBS with Rax =3.75 m in the low-βplasma is consistent
with a theoretical prediction [22]. Using the maximum
IECCD of 9 kA withTe0 of 3.5 keV, the current drive effi
-ciency,γ=neRaxIECCD/Pabs, and a nondimensional current
drive efficiency [23] that includes the contribution of elec-tron temperature,ζ =e3n
eRaxIECCD/(ε20PabsTe), are
evalu-ated to be 3.9×10¹⁷AW−1m−2 and 0.036, respectively.
Here,ne,Pabs,e,ε0, andTe are the electron density,
ab-sorbed EC-wave power, unit charge, permittivity of free space, and electron temperature (electron energy in units of C*V here), respectively.
ForN// =0, that is, for normal injection (ECH), the polarization was set to the linear X mode. However, for
Fig. 4 Dependence of plasma currentIp on EC-wave beam di-rectionN//. Ipshows positive and negative peaks against variations inN//.
4. Comparison with TRAVIS Code
Calculation
The ray-tracing code TRAVIS can calculate the EC-wave absorption and EC-driven currentIECCD by using a
practical 3D magnetic field configuration and the proper-ties of the plasmas and EC waves [19]. It was originally developed for ECH/ECCD/ECE studies in the Wendelstein 7-X stellarator. It can also be applied to the LHD by using the LHD magnetic field configuration data file. The exper-imentally obtained dependence of the plasma current on the EC-wave beam direction described in Sec. 3 is com-pared with that calculated using TRAVIS. In Fig. 5, the calculatedIECCD and the power absorption efficiencyηabs
forBax=1.477 T are plotted as functions of the EC-wave
beam directionN//. The dependence ofIp onN//obtained
in the ECCD experiment is well reproduced by the calcu-lation except for the absolute value ofIECCD. The
calcu-latedIECCDshows positive and negative peaks with an
op-timumN//(N//,opt) of∼ ±0.28, andηabsshows poor power
absorption withN// around 0. Thus, for |N//|< |N//,opt|,
the decrease in|IECCD|results from the poor power
absorp-tion. On the other hand, the calculation shows that the decrease in|IECCD|for|N//|>|N//,opt|results from an
in-crease in the fraction of EC-wave power absorbed by the electrons trapped in magnetic ripples. The tendency is like this: the fraction of power absorbed by the trapped elec-trons over total absorbed power is less than 6% for|N//|<
|N//,opt|, whereas that for|N//|>|N//,opt|increases to more
than 30%.
One reason for the discrepancy between the absolute value of the driven current calculated with TRAVIS and that obtained experimentally would be the imperfect set-tings of the polarization as a pure X mode and the beam direction in the experiment.
The TRAVIS calculation with aBaxvalue of just the
second harmonic resonance condition, 1.5 T, was also per-formed. The result was compared with that of theN//scan experiment performed with Bax = 1.5 T. The experiment
Fig. 5 EC-driven currentIECCDand power absorption efficiency calculated with TRAVIS code forBax=1.477 T as func-tions of the EC-wave beam directionN//.
was performed with an EC-wave pulse width of 600 ms. With this pulse width, the plasma current was still increas-ing and was not saturated. However,Ipat 600 ms is nearly
proportional to the saturated Ip with a sufficiently long
pulse discharge. The experimentally obtained|N//,opt|was
∼0.2, smaller than that in the case ofBax=1.477 T.
Sim-ilar to the experimental result, the calculated|N//,opt|also
decreased to∼0.15. Owing to the increase in the magnetic field to 1.5 T, theN//region of poor power absorption be-came narrower. The absorption is poor even in the case of
Bax =1.5 T, because the EC-wave beam path with N//∼0
is nearly tangential to the plane of B=1.5 T. Thus, half of the beam passes by the resonance layer when the beam center is aimed at the magnetic axis. Beam refraction also degrades the power absorption.
The TRAVIS calculation with Bax =1.51 T reveals
that the power absorption was sufficient for anyN//; in par-ticular, for|N//|<0.3, it was larger than 95%. The value of |N//,opt|shifted to∼0.1. The decrease in|IECCD|for|N//|<
|N//,opt|results from insufficientN// to generate EC-driven
current.
Considering the experimental and calculated results with various Bax settings of 1.477, 1.5, and 1.51 T
de-scribed above, the value of|N//,opt|is determined by factors
such as the power absorption related to theBaxsetting and
the ECCD efficiency related to theN//setting.
5. Conclusions
posi-tive and negaposi-tive current directions were identified. With the optimum beam direction, the maximum driven current reached 9 kA.
The dependence of the driven current on the EC-wave beam direction calculated with the TRAVIS code well reproduced the experimentally obtained dependence, except for the absolute value of the driven current. The op-timum beam direction that maximizes the EC-driven cur-rent depends on the magnetic field, efficiency of power ab-sorption, and fraction of the power absorbed by trapped electrons.
Acknowledgments
The authors thank the NIFS stafffor performing the LHD experiments. This work was conducted under the framework of a bidirectional collaborative research pro-gram between Kyoto University and the National Institute for Fusion Science (KOAR010, KLRR304). This work was partly supported by KAKENHI (Grant-in-Aid for Sci-entific Research (C), 21560862).
[1] V. Erckmann and U. Gasparino, Plasma Phys. Control. Fu-sion36, 1869 (1994).
[2] B. Lloyd, Plasma Phys. Control. Fusion40, A119 (1998). [3] R. Prater, Phys. Plasmas11, 2349 (2004).
[4] H. Zohmet al., Nucl. Fusion39, 577 (1999). [5] R. Prateret al., Nucl. Fusion47, 371 (2007). [6] A.C.C. Sipset al., Nucl. Fusion47, 1485 (2007). [7] A. Isayamaet al., Nucl. Fusion49, 055006 (2009). [8] H. Maassberget al., Plasma Phys. Control. Fusion47, 1137
(2005).
[9] G. Motojimaet al., Nucl. Fusion47, 1045 (2007). [10] K. Nagasakiet al., Plasma Fusion Res.3, S1008 (2008). [11] K. Nagasakiet al., Nucl. Fusion50, 025003 (2010). [12] K. Nagasakiet al., Proc. 23rd IAEA Fusion Energy
Con-ference (2010) EXW/P7-19.
[13] Y. Yoshimuraet al., Journal of Korean Physical Society49, S197 (2006).
[14] Y. Yoshimuraet al., Fusion Sci. Technol.53, 54 (2008). [15] T. Notakeet al., Plasma Fusion Res.3, S1077 (2008). [16] Y. Yoshimuraet al., Fusion Sci. Technol.58, 551 (2010). [17] S. Sakakibaraet al., Plasma Fusion Res.1, 003 (2006). [18] K.Y. Watanabeet al., Fusion Sci. Technol.46, 24 (2004). [19] N.B. Marushchenkoet al., Nucl. Fusion48, 054002 (2008);
Marushchenkoet al., Nucl. Fusion49, 129801 (2009). [20] O. Motojimaet al., Phys. Plasmas6, 1843 (1999). [21] N.J. Fisch and A.H. Boozer, Phys. Rev. Lett. 45, 720
(1980).