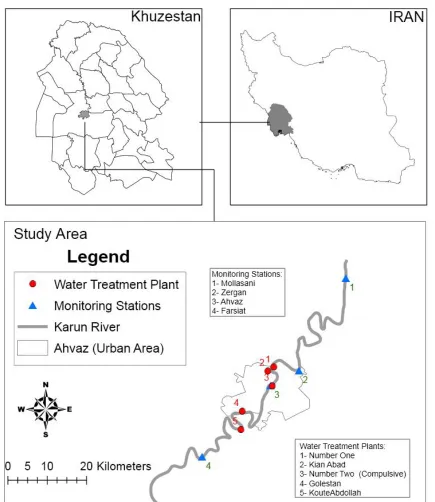
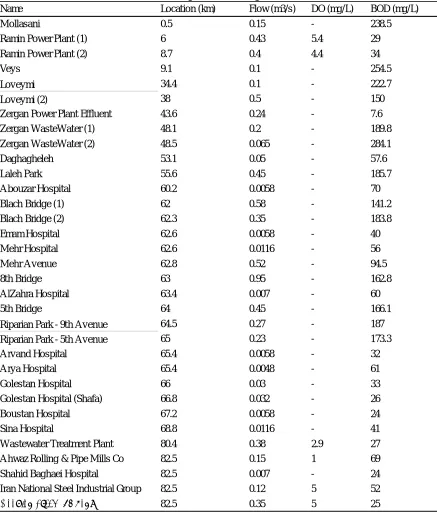
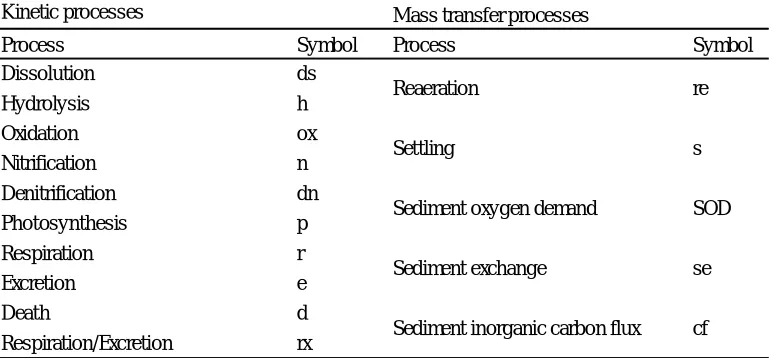
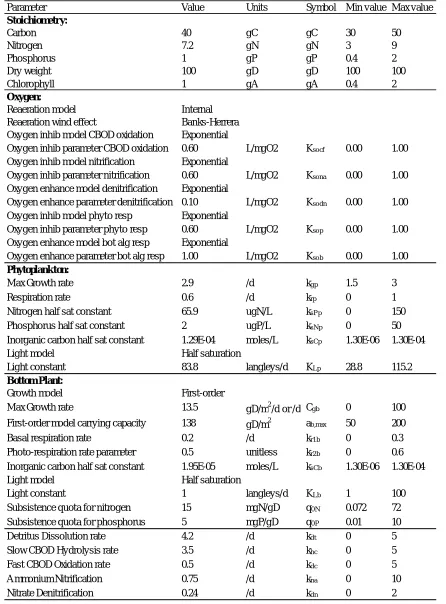
Evaluation of Karun River Water Quality Scenarios Using Simulation Model Results
Full text
Figure


Related documents
The OX-LDLs activate some transcription factors (e.g. NF-kB) in the cells (endothelium, macrophages, smooth muscle cells), which induce the expression of genes encoding adhesion
muscle training improves respiratory muscle function and reduces dyspnea in patients with chronic obstructive pulmonary disease.. Ann Intern Med 1989;
The noise produced by aircrafts (mainly by gas turbine engines) operations in an airport or in the surrounding area depends upon a number of factors including: the types
Using liberal de fi nition, women with multiple infections generally took a longer time to Figure 1 Cumulative probability of persistent detection of the first episode of HPV
In accordance with the paragraph 6, Payment of the General Conditions of Dispute Board Agreement, “if the Parties fail to agree on the retainer fee or the daily fee, the appointing
Published results were supported by the project ‘Popularization of BUT R&D results and support systematic collaboration with Czech students’ CZ.1.07/2.3.00/35.0004 and by
Key words: Mardi Gras Indians, Social Aid and Pleasure Clubs, second lines, Master Plan,.. Cultural Planning, economic development,
The IT product MN67S150 Smart Card IC Version RV08 including IC Dedicated Software (Target of Evaluation, TOE) has been evaluated at an approved evaluation facility using the
