Forschen
Sci
O p e n H U B f o r S c i e n t i f i c R e s e a r c hInternational Journal of Water and Wastewater Treatment
Open Access
Volume:1.2 Research Article
Sensitivity and Precision of Determination
of
210Pb in Groundwater
Shabana EI*, Qutub MMT and Kinsara AA
Faculty of Engineering, Nuclear Engineering Department, King Abdulaziz University, P.O. Box 80204, Jeddah 21589, Saudi Arabia
Received date: 31 July 2015; Accepted date: 26 Sept 2015; Published date: 02 October 2015. Citation: Shabana EI, Qutub MMT, Kinsara AA (2015) Sensitivity and Precision of Determination of
210Pb in Groundwater. Int J Water and Wastewater
Treatment 1(2): http://dx.doi.org/10.16966/2381-5299.109
Copyright: © 2015 Shabana EI, et al. This is an open-access article distributed under the terms of the Creative Commons Attribution License, which permits unrestricted use, distribution, and reproduction in any medium, provided the original author and source are credited.
*Corresponding author: Shabana EI, Faculty of Engineering, Nuclear Engineering Department, King Abdulaziz University, P.O. Box 80204, Jeddah 21589, Saudi Arabia, Tel: 00966500013772; E-mail: [email protected]
Abstract
Monitoring of 210Pb in groundwater of high radon content is of great interest due to its high radio toxicity. Sensitive and reliable radio analytical
methods are required. Due to the complexity of 210Pb determination, quality management of the analytical data has to be established to ensure
the method validation prior to its application to unknown samples. This requires the quantification of the accuracy and precision of the analytical method. However, performances of two existing methods, with little modifications, are examined against standard solutions to ensure validation. The obtained results of the examined methods indicated accuracy levels within ± 22% and precision ranged from 17 to 6% for low and high activities, respectively, in the examined activity range (0.064 to 0.519 Bq L-1). These results are convenient to meet the regulation limit value
(0.1Bq L-1) of 210Pb in drinking water. The obtained results are submitted and discussed in detail.
Keywords:
Groundwater; Water radio analysis; 210Pb; Liquid scintillation counting; Radiation detectionIntroduction
In arid regions, groundwater is the major source of fresh water to the residential human communities. Quality evaluation of groundwater, including radiological quality, is of considerable interest in a purpose of toxicity control. The occurrence of natural radio nuclides in groundwater is due to the possibility of the leaching of the salts of their elements from the rock-bearing minerals [1]. For radiological evaluation of groundwater, uranium and radium isotopes, in addition to 222Rn, usually measured.
However, no adequate attention has been given to the comparatively long-lived 222Rn progenies (210Pb and 210Po).
A previous work [2] was dedicated to study the natural radioactivity in the groundwater of Wadi Nu’man, Mecca province, Saudi Arabia, as an important renewable groundwater source. The study indicated that the water contains high levels (9.8-102.7 Bq L-1) of unsupported 222Rn
and considerable levels (up to 54.7 µg L-1) of natural uranium; 226Ra and 228Ra were of negligible levels (<0.03 and 0.05 Bq L-1, respectively). The
maximum contaminant level (MCL) for 222Rn in drinking water, according
to the national regulations, is about 11 Bq L-1, and for natural uranium is
30 µg L-1. Radon-222 decays to two relatively long-lived progenies (210Pb,
22.3 years and 210Po, 138 days). These 222Rn progenies may be present
and enhanced in the groundwater of high radon content adding extra radiation dose to the users of these waters [3]. There is a potential for these radio nuclides to increase in the groundwater with time as the radon emanation continues from the rock structures. In addition, some atoms of
210Pb and 210Po may escape the bearing rocks and soils to the surrounding
groundwater due to solid/liquid interaction. An extension to this study is required to explore the effect of the continuous radon emanation on the accumulation of 210Po and 210Po in the groundwater of the Wadi.
Due to the different chemical properties of lead and polonium, the radio nuclides 210Pb and 210Po have different pathways in the environment
result in radioactive disequilibria. If both radio nuclides are in equilibrium in the sample of interest, it is convenient only to measure either the parent
or the daughter, depending on which is easier to determine. In this case, often 210Po is much easier. However, in environmental samples, especially
water samples, 210Pb and 210Po cannot be assumed to be in radioactive
equilibrium. Therefore, the determination of both isotopes separately in each sample is necessary. This stresses the importance of the simultaneous determination of 210Pb and 210Po in groundwater, especially the water of
high radon content, which in turn enables a realistic dose assessment. Monitoring of 210Pb and 210Po in the groundwater of high radon content,
especially that is used for drinking and other household uses without treatment, require sensitive and reliable methods to meet their regulation limit requirements in drinking water. A guidance level of 0.1 Bq L-1 is
established by the World Health Organization (WHO) for the presence of both 210Pb and 210Po in drinking water [4].
The existing methods for 210Po determination indicate that the most
widely used technique is the spontaneous deposition of polonium on a silver (or nickel) disc from dilute hydrochloric acid solutions, and subsequent measurement by α-spectrometry [5-11]. It is an excellent method and hence, often used for different matrices due to the application of 208Po or 209Po radiotracers as yield determinants. The technique is
considered to be simple, fast, sensitive, accurate and precise.
On the other hand, due to the complexity of measuring 210Pb, several
attempts have been carried out by many workers to develop reliable radio analytical methods for analyzing this radionuclide. The existing methods can be classified to four main groups:
1. Direct counting of the low-energy γ-ray of 210Pb by γ-spectrometry
using a hyper-pure Ge detector [12].
2. Separation of 210Po, the indirect decay product of 210Pb, and
counting of its α-activity by α-spectrometry in cases where samples attain 210Pb/210Po equilibrium [13].
Forschen
Sci
O p e n H U B f o r S c i e n t i f i c R e s e a r c hOpen Access
acetic acid (EDTA) solution [14,15] or by ion exchange [7,16,17],and then mixing the obtained solution with proper scintillation cocktail and measuring its β-activity or the β-activity of its direct in-growing daughter (210Bi)by liquid scintillation counter.
4. Separation of 210Bi and counting its β-activity [18,19].
Usually, each of these methods offers some advantages and disadvantages. Accept the first method, all procedures are radiochemical methods depend upon the separation of 210Pb or one of its daughters (210Bi
and 210Po) from all other components of the sample and preparation for
counting to get high sensitivity using appropriate scintillation cocktail and counting system. Most methods involved chemical separation steps result in time delays of several days for separation and in-growth of some daughter or granddaughter activity. They are more complex and usually limited to improve lead separation process, but still have the same disadvantages (the lack of yield determinant radiotracer and the interference of 210Bi build
up counts with that of 210Pb counts during measurement). In addition,
due to the fact that 210Pb emits very low-energy β-particles, and when
decays it also emits low energy (46.5 keV) γ-photons. Both emissions are difficult to detect. In consideration of the advantages of the direct γ-ray measurement method, several attempts have been made to optimize this technique. Therefore, although the γ-spectrometry method is direct and apparently convenient, it has considerable disadvantages due to:
a) The attenuation effect due to self-absorption of the low energy γ-ray (the 46.5 keV photon) emitted by 210Pb that strongly depends on the chemical composition of the sample matrix.
b) The small emission fraction of the γ-rays (only 4% of the total disintegrations).
c) The high background γ-radiation, especially in the low energy region of the γ-spectrum, due to the interference of various natural radiation sources.
Accordingly, the many correction factors and the high relative uncertainties from the γ-spectrometric method should be considered. When higher sensitivity and accuracy are required the chemical separation methods will be the right choice where they will be more reliable. The most common are based on lead separation by co-precipitation as sulfate (or recently by ion exchange) and immediate counting to reduce effort and time.
Ion exchange resins have found an increasing use for the separation of
210Pb and the other radioanalytes for analysis. An ion exchange resin
(Sr-resin), based on crown ethers, has been developed by Horwitz et al. [20] as an extraction chromatographic resin for the separation of strontium, lead and polonium. It is based on crown ether (4, 4’ (5’)-bis-(t -butyl-cyclohexano)-18-crown-6). In addition, a lead selective resin (Pb-resin) is also developed for separation of lead, resulted in good chemical yield and higher sensitivity for 210Pb determination.
The aim of this work was to quantify two existing radio analytical methods for 210Pb determination prior to its application for unknown
groundwater samples of Wadi Numan. The methods are the most common methods for 210Pb determination because they are relatively
fast and based on direct 210Pb measurement. They are tested against
standard water samples for accuracy and precision. The first is based on separation of Pb by co-precipitation with Ba as sulfate and dissolving the obtained precipitate by EDTA solution [15]. The other method is based on ion exchange separation of Pb using Pb-resin or Sr-resin (Eichrom Technologies, LLC. Analytical procedures, OTW01, Rev. 2.0). Based on the obtained results, the techniques are evaluated.
Experimental
Sulfate co-precipitation method
This procedure [15] is comparatively very fast but applicable only for (or limited to) samples of negligible levels of 228Ra compared to 210Pb. This
is due to the co-precipitation of Ra with Pb under this co-precipitation condition, and 228Ra interferes with 210Pb during measurement due to their
low energy β-emissions. 228Ra is of low β-energy [E
max=39.0 keV (60%)
and 14.5 keV (40%)] that can partially interfere with that of 210Pb energy
[Emax=16.5 keV (80%) and 63.0 keV (20%)] during counting [15]. However, the water samples of Wadi Nu’man comply with this condition, where the concentration of radium isotopes (226Ra and 228Ra) in the groundwater
were below the detection limit of the counting system in all samples [2]. About 0.5 - 1 L of the water sample was filtered, using 0.45 µm membrane filter, in a clean 1-L beaker. Nineteen mg (0.019 g) of barium nitrate was added and stirred to dissolve. The pH was adjusted to 2-3 using saturated NaOH solution. The sample solution was boiled and iron was reduced (from Fe3+ to Fe2+) by adding few drops of the ascorbic acid solutions,
drop by drop with stirring (colorless clear solution). Six mL of 1M H2SO4 solution was added drop by drop with stirring (Ra and Pb co-precipitated with Ba as sulfate). The sample was lift on the hotplate without stirring for about 15 minutes to develop the precipitate. The sample was cooled to room temperature, centrifuged, and the supernatant was discarded. The precipitate was washed to neutral by distilled water. About 4 mL of 0.25 M alkaline EDTA was added, and the sample was warmed in a water bath for complete dissolution. The sample was evaporated to 2-3 mL, mixed with 12 mL of OptiPhase “Hi Safe” 3 cocktail (from PerkinElmer) and measured using the liquid scintillation counter. For brevity, it will be referred to OptiPhase “Hi Safe” 3 cocktail as “Hi safe” cocktail along the whole work.
According to Wallner [15], the chemical recovery is 95-100%; this means that there is no need for yield correction, which encouraged the examination of this method.
Ion exchange method
This method (Eichrom Technologies LLC, analytical procedures, OTW01, Rev. 2.0)is unlimited to some type of samples.210Pb was
concentrated from a 0.5-1 L of water sample by iron hydroxide scavenge, and separated from iron using modified ion exchange resin. The purified lead fraction was collected and prepared for measurement.
Lead pre-concentration
About 0.5–1L of water sample (or an aliquot convenient to meet the required detection limit) was filtered through 0.45 µm filters into 2-L beaker. The sample was acidified to pH 2 with concentrated HNO3 (0.6 mL per 100 mL). One mL of stable lead carrier and 1 mL of iron carrier were added. The beaker was covered with a watch glass and heated to near boiling for an hour. The watch glass cover was removed and concentrated ammonia solution was added slowly drop by drop with stirring, to get the brown color, and then more 2 mL was added to precipitate iron hydroxide. The solution was stirred, if necessary, and the beaker was allowed to heat for another 30 minutes. The precipitate was left to settle for at least 2 hours (preferably overnight). The supernatant was decanted and the precipitate was transferred to a 50-mL centrifuge tube. The sample was centrifuged and the supernatant was discarded. For washing, the precipitate was mixed with 10 mL of distilled water, centrifuged, and the supernatant was discarded. The precipitate was taken up in 10 mL of 1 M HNO3.
Pb separation using Pb-resin column
Forschen
Sci
O p e n H U B f o r S c i e n t i f i c R e s e a r c hOpen Access
discarded. About 10 mL of 1 M HNO3 was added to the column to removeany Bi or Fe and the eluent was also discarded. About 10 mL of 0.1 HNO3 was added to the column and the eluent was discarded. A clean and labeled centrifuge tube was placed under the column and 20 mL of water was added to the column to elute lead. Very carefully, 4 mL of concentrated H2SO4 was added to each Pb eluent and the solution was allowed to cool for 10-15 minutes. The tube was caped and the solution was mixed well. A white precipitate was formed.
Sample preparation for counting
The solution was centrifuged and the supernatant was discarded. About 10 mL of water was added to the precipitate and mixed well to slurry. The sample was filtered on a pre-weighed 0.1 µm polypropylene membrane filter. The filter was removed and dried in a drying oven for about 15 minutes at 50oC, and cooled to room temperature. The sample was
weighed to calculate the mass of PbSO4 for chemical yield determination. The filter, with the precipitate, was transferred to a polyethylene counting vial and 5 mL of de-ionized water was added and mixed well by vigorous shacking to slurry. Fifteen mL of Hi Safe cocktail or StarGel (gelling cocktail from Merdian) was added and the sample was counted using a liquid scintillation counter.
Sr-resin has been examined for 210Pb determination using this method.
Just Pb-resin column was replaced by Sr-resin column.
Calculations
Low energy β-counts from 210Bi due to its build up during analysis
interfere with 210Pb counts adding more complexity to 210Pb analysis.
If the prepared samples were kept for about 30 days in the fridge to attain 210Pb/210Bi isotopic equilibrium, lead can be counted using the
α/β discrimination counting mode. In this case, the count rate in the β-particle counting window corresponds to the count rate of 210Pb and 210Bi. The 210Pb activity (A) can be calculated using Equation 1:
A (Bq/L) = (C - B) / (60 Ex RxV) (1) Where, C is the sample count rate in the β-counting window (in cpm); B is the blank sample count rate in the same counting window (in cpm); E is the counting efficiency (measured cpm/dpm of a prepared lead standard in the β-counting window under identical conditions as that of the samples); R is the chemical recovery; V is the sample size (in L). The counting efficiency was found to be ranged from 175-185% due to 210Pb
and 210Po.
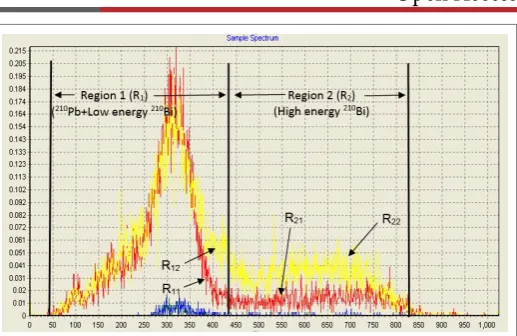
If α/β discrimination counting mode is used for immediate counting to avoid 30 days delay time, the later β-emitters will be counted in the β-particle window in two regions of R1 and R2 channels that corresponding to the β-counts of 210Pb + low energy β-counts of 210Bi and the high energy
β-counts of 210Bi, respectively (Figure 1).
The efficiency of counting 210Pb and the channel number that
corresponds to the maximum β-energy of 210Pb (the right side of region R 1)
have to be determined using a prepared standard source with immediate counting (just 3 hours cooling after 210Pb-separation). The channel
number that corresponds to the maximum β-energy of 210Bi (the right
side of region R2) has to be determined by recounting the same prepared standard source one or two weeks after the 210Pb-separation for clear 210Bi
build up. The channel number range for these regions depends upon the used counting system and the characteristics of the sample counting medium (the sample + the cocktail). It must be determined carefully for specific counter and sample medium. Standard and blank samples were counted for 240-500 minutes.
The total counts in the region of R1 channels represent the counts from
210Pb + low energy β of 210Bi + background counts in this region. Total
counts in the region of R2 channels represent the counts from high energy β of 210Bi + background counts in this region.
To eliminate 210Bi interference with 210Pb counts in R
1, the210Bi
contributions to regions R1 and R2 have to be determined and the correction factor F (the ratio of the counts due to 210Bi in R
1 to that in R2)
has to be calculated using Equation 2:
F = (R12-R11)/(R22-R21) (2) Where, R11 and R21are the total counts from low energy β in R1and high energy β in R2, respectively, when the standard sample is counted few hours after 210Pb separation. R
12 and R22 are the total counts from low
energy β in R1 and high energy β in R2, respectively, when the sample is counted after time (t) of 210Pb separation.
(R12-R11) and (R22-R21) represent the net counts from 210Bi due to its
build up after 210Pb separation in R
1 and R2, respectively, in the period
started at the time of the first measurement and ended at the mid-time of the second measurement.
This factor is used to correct the count rates measured in region R1 to determine the contribution of 210Pb to the total counts in R
1 by eliminating
the counts due to 210Bi growing into the 210Pb region after Pb-separation
(i.e. to eliminate 210Bi interference in R
1). This factor depends upon the
right side channel number of each of the two regions, which in turn depends on the sample medium and the instrument used.
The determination of the value of the correction factor (F) enables immediate counting of the unknown samples directly after 3 hour-cooling. The 210Pb activity concentration (A) was calculated using Equation 3
without 30 days waiting for 210Pb/210Bi secular equilibrium:
A (Bq L-1) = (C
1 – Fx C2) / (60 ExRxV) (3)
Where, C1 is the net count rate of the sample in the channels of region R1 (cpm); C2 is the net count rate of the sample in the channels of region R2 (cpm); E is the counting efficiency of 210Pb; Ris the chemical recovery
of lead separation; V is the sample size (in L). The net count rate in R1 or R2 region equals the count rate of the sample minus the count rate of the blank sample in the same region.
Apparatus
An ultra-low-level liquid scintillation spectrometer, “Quantulus” model 1220 (from PerkinEmer, USA), was used for 210Pb determination.
However, in addition to the dependence of the MDA on the background count rate and the counting efficiency (as in case of LLD), it also depends upon other factors as counting time, sample size and the chemical yield in Figure 1: Spectrum of 210Pb after separation from 210Pb/210Bi/210Po
Forschen
Sci
O p e n H U B f o r S c i e n t i f i c R e s e a r c hOpen Access
the radiochemical separation technique. A detection limit of 6 mBq/L wasobtained based on 700 mL sample size and 240 minutes counting time.
Quality control
Quality management of analytical data has to be established to ensure the reliability of the obtained results with the used analytical procedure (method validation) [21]. This requires the quantification of the accuracy and precision of the analytical method. However, performances of the existing methods are examined against standard solutions prepared by careful dilution of the 210Pb standard reference solution with different
quantities of almost 228Ra-free (<6 mBq L-1) tap water. The dilution
with deionized water was replaced by tap water to model for filtered groundwater samples. Blank samples (tap water samples) were processed with the standard samples in the radiochemical techniques to correct for internal and external counting interferences. The uncertainties are given with the final results at two standard deviation level resulting from the propagation of the random uncertainties in counting statistics incurred anywhere in the entire measurement process. All calculations were made using a designed spread sheet program to reduce effort, time and eliminate personal calculation errors.
Results and Discussion
Examining
210Pb radioanalytical methods
The standard samples were analyzed using the two techniques. Measuring the samples directly after preparation and cooling (before
210Pb/210Bi/210Po equilibrium) requires the determination of the interference
factor (F) in advance. It is the ratio between the number of β-counts due to 210Bi in R
1 channels and that in the R2 channels (Figure 1), to correct for
the fraction of beta counts due to 210Bi build up in the 210Pb channels(R 1
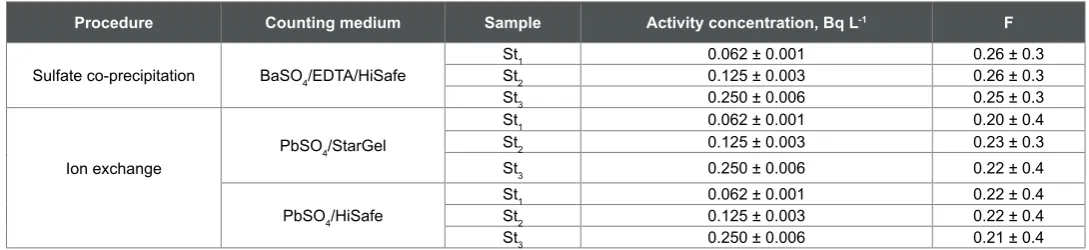
channels) during counting. However, the F factor was first investigated for the used techniques and the obtained results are given in Table1.
The data in Table 1 showed that by using Quantulus, Wallac 1220, liquid scintillation counter, the F factor was found to be 0.26 ± 0.3 with barium sulfate precipitate dissolved in EDTA and mixed with the Hi Safe liquid scintillation cocktail (in the sulfate co-precipitation method). This interference correction factor was found to be lower (0.22 ± 0.4) with the lead sulfate precipitate and the Hi Safe or Star Gel cocktail in the ion exchange method. This means that both cocktails have the same effect on the distribution of 210Bi β-counts. The slightly higher F
values in the sulfate co-precipitation method may be related to a slight quenching effect of EDTA. As expected, the data in Table 1 showed that the distribution of the β-counts of 210Bi did not affected by the standard
activity concentration. In this work, it is slightly affected by the medium in the counting vial. However, this factor has to be determined for the specific 210Pb-radioanalytical method. Vajda et al [16] determined the 210Bi
contribution to R1 and R2 channels, to calculate the F factor, by separating
210Bi from a standard 210Pb-210Bi-210Po solution (in equilibrium) by ion
exchange chromatography from chloride medium and converted the
separated 210Bi medium to nitrate medium to be as that of the 210Pb to
prepare for counting. The later procedure is time consuming and costly, while the present procedure is simple and no extra work is required; just recounting the lead standard after 1 or 2 weeks to determine F.
The sulfate co-precipitation method has been used to measure 210Pb
in the standard samples. Although the original method [15] considered the chemical yield of this method as 95-100% and no need for its determination, a difference in the results between the measured values and reference values was observed; slightly lower values were obtained in most cases. This observation justified the need to examine the chemical yield. However, the chemical yield has been determined carefully and considered resulted in data enhancement Table 2.
The chemical yield of this method was determined gravimetrically and values ranged from 89 to 95% were obtained Table 2. Determination of the chemical yield gravimetrically is less accurate than that determined by the material balance technique (the use of spiking radiotracer) due to added statistical uncertainty, leading to less precision. The counting efficiency of 210Pb was (122 ± 5%), which is satisfactory for measuring low-energy
β-emitter.
The accuracy (deviation from the middle of the confidence interval of the standard sample) in the investigated activity range (0.065-0.519 Bq L-1) lies within ± 22%, and at the activity level around 0.1 BqL-1, it was less
than ± 6.5%. This range is satisfactory in 210Pb determinations.
The results, also, showed that the precision (fluctuation of the measured values around the mean of the total measurements) in the studied activity range, ranged from13.6 and 6.2%, for low and high activities, respectively. At the activity levels around the guide value (0.1 Bq L-1) the obtained
precision was within ± 8%. This work needs experience and skilled hands to achieve such results, however, several attempts were conducted to optimize the procedure and achieve the goal, where the results in Table 1 are the results of the last 3 trials.
As defined by Currie [22], a detection limit of a paired observation of about 0.006 Bq L-1 in 240 minutes counting time was obtained compared
to the guide value (0.1 Bq L-1) of 210Pb in drinking water. However, the
detection limit for measuring 210Pb using this method was satisfactory and
attributed partly to the large sample size (700 mL) and the long counting time (240 minutes), although it is about three times higher than that of measuring its indirect daughter 210Po by α-spectrometry.
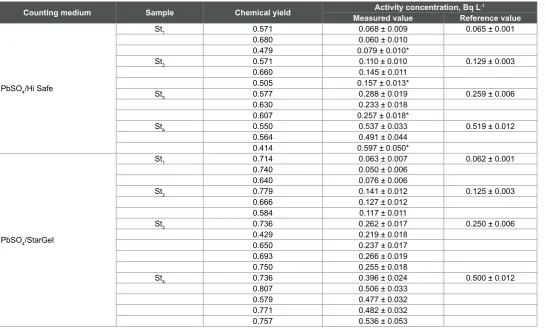
Lead-210 was measured in the same standard samples using the ion exchange separation method. Pb-resin columns and two high performance cocktails were examined within this method and the results are given in Table 3. In an attempt to reduce cost, the used Pb-resin column was regenerated by rinsing the column with 20 mL of 0.1 M ammonium citrate, followed by 20 mL distilled water to be ready for reuse. The data of the regenerated columns are included in Table 3.
The chemical yield values for lead separation ranged from 41 to 80%
Procedure Counting medium Sample Activity concentration, Bq L-1 F Sulfate co-precipitation BaSO4/EDTA/HiSafe
St1 0.062 ± 0.001 0.26 ± 0.3
St2 0.125 ± 0.003 0.26 ± 0.3
St3 0.250 ± 0.006 0.25 ± 0.3
Ion exchange
PbSO4/StarGel
St1 0.062 ± 0.001 0.20 ± 0.4
St2 0.125 ± 0.003 0.23 ± 0.3
St3 0.250 ± 0.006 0.22 ± 0.4
PbSO4/HiSafe
St1 0.062 ± 0.001 0.22 ± 0.4
St2 0.125 ± 0.003 0.22 ± 0.4
St3 0.250 ± 0.006 0.21 ± 0.4
Forschen
Sci
O p e n H U B f o r S c i e n t i f i c R e s e a r c hOpen Access
with an average value of about 68%. This yield is lower than that obtained with the sulfate co-precipitation method (average 92%), resulted in slightly higher uncertainty.
The 210Pb measurement results with the Hi Safe cocktail showed that the
accuracy was within ± 21%, and at the activity level around 0.1 BqL-1, it
was within ±10%. The precision in the studied activity range, ranged from 16.7 to 6.6%, for low and high activities, respectively. At the activity levels around the guide value (0.1 Bq L-1), the obtained precision was about 9%.
The results of the regenerated Pb-resin columns indicated that the reused resin worked properly and showed the same performance as that of the fresh resin (Table 3), reflecting the possibility of reducing the resin purchase cost to 50%.
Cocktails have an effect on the counting efficiency and the distribution of counts within the counting channels, whereas chemical yield depends upon the separation technique and the personal skills. However, cocktail can enhance counting efficiency resulting in improving the precision of determination of the radioanalyte. In the ion exchange method using Pb-resin, the obtained PbSO4 precipitate in the counting vials was suspended in the Star Gel cocktail (instead of covered by Hi Safe cocktail) and counted. The results are included also in Table 3.
The results of Star Gel cocktail with Pb-resin indicated that the accuracy was within ±22 in the studied activity range, and the precision ranged from 12 to 6% for low and high activities, respectively.
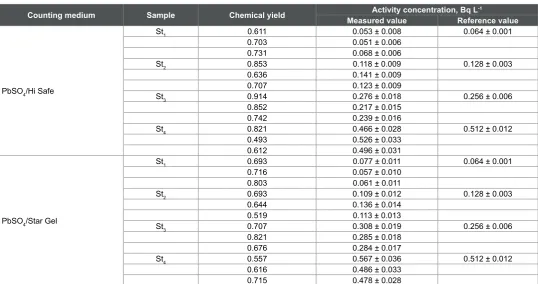
Modified Sr-resin (a resin selective to Sr2+) has, also, a good affinity to
Counting medium Sample Chemical yield Activity concentration, Bq L-1
Measured value Reference value
BaSO4/HiSafe
St1
0.92 0.078 ± 0.009 0.065 ± 0.001
0.94 0.073 ± 0.009
0.89 0.066 ± 0.009
St2
0.94 0.122 ± 0.009 0.130 ± 0.003
0.95 0.136 ± 0.010
0.89 0.129 ± 0.011
St3
0.91 0.263 ± 0.017 0.260 ± 0.006
0.95 0.285 ± 0.018
0.90 0.265 ± 0.017
St4
0.93 0.471 ± 0.029 0.519 ± 0.012
0.94 0.626 ± 0.041
0.90 0.546 ± 0.036
Table 2: Results of measuring 210Pb in standard solutions using sulfate co-precipitation method and Hi Safe cocktail
Counting medium Sample Chemical yield Measured valueActivity concentration, Bq LReference value-1
PbSO4/Hi Safe
St1 0.571 0.068 ± 0.009 0.065 ± 0.001
0.680 0.060 ± 0.010
0.479 0.079 ± 0.010*
St2 0.571 0.110 ± 0.010 0.129 ± 0.003
0.660 0.145 ± 0.011
0.505 0.157 ± 0.013*
St3 0.577 0.288 ± 0.019 0.259 ± 0.006
0.630 0.233 ± 0.018
0.607 0.257 ± 0.018*
St4 0.550 0.537 ± 0.033 0.519 ± 0.012
0.564 0.491 ± 0.044
0.414 0.597 ± 0.050*
PbSO4/StarGel
St1 0.714 0.063 ± 0.007 0.062 ± 0.001
0.740 0.050 ± 0.006
0.640 0.076 ± 0.006
St2 0.779 0.141 ± 0.012 0.125 ± 0.003
0.666 0.127 ± 0.012
0.584 0.117 ± 0.011
St3 0.736 0.262 ± 0.017 0.250 ± 0.006
0.429 0.219 ± 0.018
0.650 0.237 ± 0.017
0.693 0.266 ± 0.019
0.750 0.255 ± 0.018
St4 0.736 0.396 ± 0.024 0.500 ± 0.012
0.807 0.506 ± 0.033
0.579 0.477 ± 0.032
0.771 0.482 ± 0.032
0.757 0.536 ± 0.053
Table 3: Results of measuring 210Pb in standard solutions by the ion exchange method using Pb-resin and the two different cocktails
Forschen
Sci
O p e n H U B f o r S c i e n t i f i c R e s e a r c hOpen Access
Pb2+. This resin was replaced by Pb-resin in the ion exchange procedure
to separate 210Pb for measurement in the standard samples. The separated 210Pb was measured using Hi Safe and Star Gel cocktails (Table 4).
The results in Table 4 indicated that the chemical yield of Pb separation using Sr-resin column ranged from 49 to 91% with an average value of about 70%. The chemical yield values fluctuated within a wide range. Based on the average values, Sr-resin has slightly higher affinity to 210Pb than
Pb-resin under these experimental conditions. Although the chemical yield was slightly better with Sr-resin, compared to the Pb-resin, the precision seemed to be not affected. With HiSafe cocktail, it was ranged from 16.3 to 6% for low and high activity levels, respectively, and with Star Gel, it was ranged from 17.5 to 6.2%, respectively. The accuracy was within ± 20% with both cocktails. For comparison, the results in Tables 2-4 are summarized in Table 5.
Comparing the results in of the examined analytical methods (Table 5), the following conclusions could be drawn:
• The chemical yield was higher in the sulfate co-precipitation method (92% in average).
• Based on the average values, the chemical yield for Pb-separation by Sr-resin (about 70%) was slightly higher than that by Pb-resin (about 68%).
• The examined analytical methods using two different resins and two cocktails showed very comparable results where no clear advantages appeared. Each method can be used to achieve the job of analyzing
210Pb in WadiNu’man groundwater, and meet the regulatory standard.
• The sulfate co-precipitation method is fast, but limited to samples of negligible levels of 228Ra, as Wadi Nu’man groundwater, due
to its interference with 210Pb, whereas the ion exchange method is
applicable to all sample types.
• HiSafe and StarGel cocktails showed very comparable performance
and can replace each other in the analytical procedure. No advantage observed on suspending the precipitate in the StarGel for counting, where the counting efficiency of210Pb was almost the same (122±5)%
with the two cocktails.
Conclusions
From the obtained results within the whole work the following conclusions could be drawn:
• A new, easier and more accurate approach has been introduced to the determination of the correction factor (F) for immediate 210
Pb-counting to get fast results. For future work, it is a new addition to the radiochemical methods that based on Pb separation for counting.
• Accuracy and precision of 210Pb determination using sulfate
co-precipitation method or ion exchange method using modified Pb-selective ion exchange resins were satisfactory and have detection limits capable of meeting the regulation limit value of 0.1 Bq/L.
• The technique of choice is the ion exchange method using Pb-resin with any of the two cocktails due to the ease of the Pb-resin regeneration to reduce cost. In addition, Pb-resin is slightly cheaper than the Sr-resin.
Counting medium Sample Chemical yield Measured valueActivity concentration, Bq LReference value-1
PbSO4/Hi Safe
St1 0.611 0.053 ± 0.008 0.064 ± 0.001
0.703 0.051 ± 0.006
0.731 0.068 ± 0.006
St2 0.853 0.118 ± 0.009 0.128 ± 0.003
0.636 0.141 ± 0.009
0.707 0.123 ± 0.009
St3 0.914 0.276 ± 0.018 0.256 ± 0.006
0.852 0.217 ± 0.015
0.742 0.239 ± 0.016
St4 0.821 0.466 ± 0.028 0.512 ± 0.012
0.493 0.526 ± 0.033
0.612 0.496 ± 0.031
PbSO4/Star Gel
St1 0.693 0.077 ± 0.011 0.064 ± 0.001
0.716 0.057 ± 0.010
0.803 0.061 ± 0.011
St2 0.693 0.109 ± 0.012 0.128 ± 0.003
0.644 0.136 ± 0.014
0.519 0.113 ± 0.013
St3 0.707 0.308 ± 0.019 0.256 ± 0.006
0.821 0.285 ± 0.018
0.676 0.284 ± 0.017
St4 0.557 0.567 ± 0.036 0.512 ± 0.012
0.616 0.486 ± 0.033
0.715 0.478 ± 0.028
Table 4: Results of measuring 210Pb in standard solutions by the ion exchange method using Sr-resin and the two different cocktails
Analytical
procedure cocktailUsed
Chemical yield,% Average (range)
Accuracy,
% Precision,%
Sulfate
coprecipitation Hi Safe 92 (89-95) ± 22 13.6-6.2 Ion exchange
(Pb-resin
Hi Safe
68 (41-80) ± 21 16.7-6.6
Star Gel ± 22 12.0-6.0
Ion exchange (Sr-resin)
Hi Safe
70 (49-91) ± 20 16.3-6.0
Star Gel ± 20 17.5 -6.2
Forschen
Sci
O p e n H U B f o r S c i e n t i f i c R e s e a r c hOpen Access
Although the limitation of the sulfate co-precipitation method tocertain type of samples discourages its use, it is fast and sensitive enough to be helpful under the proper circumstances.
References
1. United Nations Scientific Committee on the Effects of Atomic Radiation (UNSCEAR) (2000) Sources and Effects of Ionizing Radiation. Report to General Assembly, with scientific Annexes, United Nations, New York, NY: UNSCEAR.
2. Shabana EI, Abulfaraj WH, Kinsara AA, Abu Rizaiza OS (2013) Natural radioactivity in the groundwater of Wadi Nu’man, Mecca Province, Saudi Arabia. Radiochimica Acta 101: 461-470.
3. Ladinskaya LA, Parfenov YD, Popov DK, Fedorova AV (1973) 210Pb
and 210Po Content in Air, Water, Foodstuffs, and the Human Body.
Archives of Environ Health 27: 254-258.
4. Guidelines for Drinking Water Quality: Radiological Aspects (2004) World Health Organization (WHO).
5. Flynn WW (1968) The determination of low levels of polonium-210 in environmental materials. Ana Chim Acta 43: 221-227.
6. Holtzman RB (1987) The determination of 210 Pb and 210 Po in biological and environmental materials. J Radioanal Nucl Chem 115: 59-70. 7. Jia G, Belli M, Blasi M, Marchetti A, Rosamilia S, et al. (2001)
Determination of 210Pb and 210Po in mineral and biological environmental samples. J Radioanal Nucl Chem 247: 491-499. 8. Sinojmeri M, Landstetter C, Katzlberger C, Achatz A (2012) Rapid
method for determination of Po isotopes in biological matter. Austrian Agency for Health and Food Safety IRPA XIII, Glasgow.
9. Zhichao L, Zhongyu W (2009) Analysis of polonium-210 in food products and bioassay samples by isotope-dilution alpha spectrometry. Appl Radiat Isot 67: 907-912.
10. Shabana EI, Abd Elaziz MA, Al-Arifi MN, Al-Dhawailie AA, Al-Bokari MM-A(2000) Evaluation of the contribution of smoking to total blood polonium-210 in Saudi population. Appl Radiat Isot 52: 23-26. 11. Shabana EI, Kinsara AA, Yahya AA (2014) Radionuclide content
and state of isotopic disequilibrium in some utilized smoking pastes. Radiochimica Acta 102: 751-756.
12. Bolivar JP, Garcia-Tenorio R, Garcia-Leon M (1996) Radioactive impact of some phosphogypsum piles in soils and salt marshes evaluated by γ-ray spectrometry. Appl Radiat Isot 47: 1069-1075. 13. Paatero J, Hatakka J, Mattsson R, Viisanen Y (1998) Analysis of Daily
210Pb Air Concentrations in Finland, 1967-1996. Radiat Prot Dosim 77: 191-198.
14. Brown SA (2005) Determination of 210Po and 210Pb in hydrometallurgical
samples using liquid scintillation counting. J Radioanal Nucl Chem 264: 505-509.
15. Wallner G (2002) Determination of 226Ra, 228Ra and 210Pb in drinking
water using liquid scintillation counting. In: Möbius S, Noakes JE, Schönhofer F (eds) LSC 2001, Advances in Liquid Scintillation Spectrometry. Tucson: Radiocarbon. 269-274.
16. Vajda N, LaRosa JJ, Zeisler R, Danesi P, Kis-Benedek G (1997) A novel technique for the simultaneous determination of 210Pb and 210Po using a crown ether. J Environ Radioact 37: 355-372.
17. Santos EE, Lauria DC, Amaral ECS, Rochedo ER (2002) Daily ingestion of 232Th, 238U, 226Ra, 228Ra and 210Pb in vegetables by
inhabitants of Rio de Janeiro City. J Environ Radioact 62: 75-86. 18. Desideri D, Guerra F, Meli M, Testa C (1995) Determination of 210Pb
in sediments by extraction chromatography. J Radioanal Nucl Chem 200: 385-396.
19. Wickenden DA, Toole J (1995) Low-level analysis of lead-210 in waters via bismuth-210 measurement. The Science of the total Environment 173/174: 117-123.
20. Horwitz EP, Chiarizia R, Dietz ML (1992) A novel strontium-selective extraction chromatographic resin. Solvent Extraction and Ion Exchange. 10: 313-336.
21. Quevauviller PP (2002) Quality Assurance for Water Analysis, Water Quality Measurement Series, Volume 3. John Wiley & Sons LTD, Chichester.