Treatment of elevated cholesterol in a
representative cross-sectional sample of
4 892 Germans: is there a social gradient?
Ulrich Laaser(1), Juergen Breckenkamp(1), Odile Sauzet(1), Vesna Bjegovic-Mikanovic(2)
Background: effective control of cardiovascular risk factors remains low in most countries and also in germany. We investigate whether socio-economic status has an impact on the level of medical treatment and control (normalized values) of total cholesterol.
Methods: data on blood lipids from 4 892 participants in the last german health survey of 1998 are analysed, adjusting for key determinants in logistic regression analyses. socio-economic status is not determined by educational achievement alone but also including occupation and household income.
results: the actual prevalence of total cholesterol of ≥240 mg/dl was 53.4%. only 3.6% of prevalent cases are under effective treatment. less favourable values of total cholesterol and hdl are displayed by males and in lower social groups, while the middle groups are in an intermediate position. chances to be treated for hypercholesterolemia are significantly less favourable for females (odds ratio (or) estimate: 0.70) and better for the age bands ≥50 (or 2.37) and ≥60 (or 3.57), if a general practitioner is visited (or 1.77), and if living in eastern germany (or 1.89). however, chances are not significantly different according to social status.
conclusions: statistically significant social group differences cannot be detected at the present low level of effective treatment. this may be different if higher levels of control are achieved.
Key words: Hypercholesterolemia; Social Gradient; Germany
(1) Faculty of Health Sciences, University of Bielefeld, Bielefeld, Germany
(2) Center School of Public Health, Faculty of Medicine, University of Belgrade, Serbia
Corresponding author: Juergen Breckenkamp, Faculty of Health Sciences, University of Bielefeld, POB 100131, 33501, Bielefeld, Germany.
e-mail: [email protected] doi: 10.2427/8944
introduction
Elevated total cholesterol remains one of the key cardiovascular risk factors. Recently, Farzadfar et al. [1] found that, since the 1980s, in spite of all mass campaigns and programmes of prevention, the amount of serum cholesterol in the World population remained almost
high prevalence of hypercholesterolemia in lower socio-economic population strata and a lack of lifestyle improvements. Can lower treatment rates and treatment effectiveness in Germany also be explained by a social gradient? For the United States, Merkin et al. [4] did not find any statistically significant difference between socio-economic groups with regard to awareness, treatment and control of high cholesterol based on data from the US National Health and Nutrition Examination Survey 1999-2002. Given the low rates of control in Germany, the aim of this study is to test the hypothesis of statistically significant differences between socio-economic groups for the treatment parameters of cholesterol. In an earlier similar analysis of awareness, treatment and treatment effectiveness of hypertension, no statistically significant differences were found between socio-economic groups [5].
Methods
The most recent data available on hypercholesterolemia for Germany comes from the Federal Health Survey (FHS) [5, 6] with data from 1998. The study population was defined as all persons aged between 18 and 79 years living in private households in Germany. A three stage sampling procedure was used: 1) random selection of 120 communities (sample points) proportional to their size, 2) for communities up to 50 000 inhabitants the sample point represents the whole community, for communities with more than 50 000 inhabitants, a district or an electoral ward was randomly selected. 3) Finally, private addresses were randomly selected from registration offices [7].
Different instruments were used in the survey: a questionnaire on life and health, a medical interview, medical-physical and laboratory examinations [7].
For this analysis, the subset of the FHS participants, for which a medical determination of total serum cholesterol was available, has been used: 4 892 participants, aged 30-69, out of a total of 5 262 participants in that age group, corresponding to 93.0% of the total. Mobile examination teams collected blood samples in 113 cities and communities all over Germany meanwhile laboratory analysis took place at the Robert Koch Institute in Berlin [8]. For almost all (N= 4 890) high density
lipoprotein (HDL) values are also available allowing for the computation of the ratio of total cholesterol by HDL. The categories for elevated cholesterol values provided by US American targets [9] are the following: a patient with total cholesterol greater or equal to 200 mg/dl or 5.2 mmol/l is at borderline risk and a patient with total cholesterol greater or equal to 240 mg/dl or 6.2 mmol/l is considered at risk. For HDL, the limits are lower than 60 mg/dl or 1.5 mmol/l for a borderline risk and lower than 50 mg/dl or 1.3 mmol/l for women and lower than 40 mg/dl or 1.0 mmol/l for men in the “at risk” category (see e.g. [9]). The ratio between total cholesterol and HDL cholesterol (T-CHOL/ HDL-CHOL) was interpreted according to the European Atherosclerosis Society [10]. A ratio ≥5.0 is considered of atherogenetic relevance, while a ratio ≥7.0 is considered a warning. The predictive value of T-CHOL/HDL-CHOL concerning cardiovascular events was recently confirmed (e.g. [11, 12]).
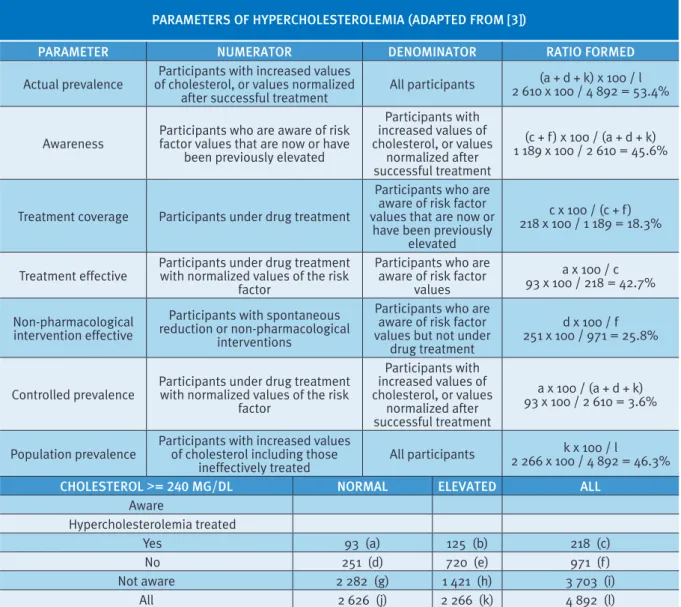
In the survey, the answer “yes” for the item “elevated blood fats, elevated cholesterol” was rated as positive answer. The answers “no”, “I don’t know” and missing values - with the exception of confirmed treatment - were rated as negative answers. Treatment was defined as positive on the basis of relevant cholesterol lowering drug intake i.e. at a dosage of “several times a week” or more. A known hypercholesterolemia was assumed also for those participants who indicated medical treatment but missed an appropriate answer in the questionnaire. For the definition and computation of parameters see Table 1.
[14]. To identify any influence of occupation and household income independently from educational achievement, we also used a three-dimensional Index [15] (for details see [5]). The index is an additive, non-weighted index using the indicators education, occupation and household-income. Each single indicator ranges from 1 to 7 points, with 1 representing the lowest and 7 the highest socio-economic status. The index can take values between 3 and 21 points. Based on this score, 3 socio-economic groups were defined with equally-sized ranges: lower SES (3 to 8 points), middle SES (9 to 14 points), and higher SES (15 to 21 points). As described above, the indicator ‘education’ was defined by the highest academic/professional qualification. Monthly net household income with 11 categories served as basis for the income indicator and ‘occupation’ comprising 20 categories as basis for the occupation indicator [13].
The primary research question is to know if the probability of being treated in case of hypercholesterolemia and the effectiveness of this treatment are dependent on the socio-economic status of the patient. A secondary question is whether the socio-economic status is a predictor of the global level of cholesterol, HDL or the ratio cholesterol/HDL.
statistical analysis
The primary question, whether social status has an impact on the level of medical treatment and control (that is effective treatment) of total cholesterol, is investigated using two logistic regression analyses with N= 1 189 and N= 218 participants, respectively. The first dependent variable of interest is whether the patient with hypercholesterolemia is medically treated (yes or no) and social status is the independent variable. The model was adjusted for known confounders: sex, age groups, visit of a GP, and living in former East or West Germany. The second dependent variable of interest is whether the treatment is effective (normalized values yes or no). Independent variable and confounders are the same for both regression models. Odds ratios and 95% confidence intervals were calculated.
The secondary question is investigated using a regression for the three continuous outcomes cholesterol, HDL or the ratio
cholesterol/HDL as dependent variables and SES as categorical independent variables with the higher SES group as reference. Differences between SES groups for visits to a physician are tested using a Chi-squared test.
Analyses were performed with the statistical software SAS 9.2.
results
The sample analysed comprised of 48.8% males (51.2% females), the distribution over the 10 year age groups from the youngest 30-39 years old to the oldest 60-69 revealed 29.7%, 25.3%, 26.1%, and 18.9%. Table 1 presents the parameters of hypercholesterolemia. Whereas the population prevalence described in Table 1 shows an import issue with medication (ineffective prescriptions, lack of compliance), the actual prevalence needs to be seen as a result of all factors causally effective in the pathogenesis of risk factors. This includes a genetic disposition as well as unhealthy ways of living (see definitions given in Table 1). Out of 2 610 participants (53.4%) with increased values of cholesterol or with values normalised after a successful treatment only 3.6% (93) are under effective treatment control resulting in a population prevalence (increased values of cholesterol whether treated or not) of 46.3%, i.e. spontaneous reduction or non-pharmacological interventions contribute also to normalization (25.8%) (see Table 1 “Non-pharmacological intervention effective”).
Descriptive analyses of the global cholesterol level results are presented in Table 2 as continuous and categorised values. Less favourable values of total cholesterol and HDL are displayed by males and in the lower SES group, with the middle SES group usually in an intermediate position (Table 2). The differences between higher and lower SES group are greater for the cholesterol group “at risk” (16.1% points reduction of population prevalence).
cholesterol divided by HDL summarises these relations with a value of 13.6% for males at risk (females 3.0%) and 8.9% in the lower SES group (higher group 7.2%).
Linear regression analyses with total cholesterol, HDL, and the quotient of total cholesterol divided by HDL show statistically significant differences for sex and SES groups in each model.
Table 3 presents the summary statistics for physician contacts. Statistical tests show that there are significantly more visits to the practitioner for the lower SES group. The average number of visits during the last 12 months to a general practitioner was twice as high in the lower socio-economic group than in the higher one (4.7 vs. 2.3 times). A percentage of 75.6 in the lower SES group as compared
to 59.8% in the higher group had at least one contact with a general practitioner during the last year.
The results of logistic regression analyses of potential determinants of treatment as well as effective treatment are shown in Tables 4 and 5.
Chances to be treated for hypercholesterolemia are significantly less favourable for females (OR 0.70; CI 95% 0.51-0.97) and better for the age bands ≥50 (OR 2.37; CI 95% 1.27-4.44) and ≥60 (OR 3.57; CI 95% 1.91-6.68), if a general practitioner is visited (OR 1.77; CI 95% 1.21-2.59), and if living in Eastern Germany (OR 1.89; CI 95% 1.37-2.60). However, odds ratios are not significantly statistically different from 1 according to social status although there is a tendency to undergo treatment less often in the middle and higher social groups.
TABLE 1
PArAmETErs of hyPErchoLEsTEroLEmiA (AdAPTEd from [3])
PArAmETEr NumErATor dENomiNATor rATio formEd
Actual prevalence of cholesterol, or values normalized Participants with increased values
after successful treatment All participants
(a + d + k) x 100 / l 2 610 x 100 / 4 892 = 53.4%
Awareness Participants who are aware of risk factor values that are now or have been previously elevated
Participants with increased values of cholesterol, or values
normalized after successful treatment
(c + f) x 100 / (a + d + k) 1 189 x 100 / 2 610 = 45.6%
Treatment coverage Participants under drug treatment
Participants who are aware of risk factor values that are now or
have been previously elevated
c x 100 / (c + f) 218 x 100 / 1 189 = 18.3%
Treatment effective Participants under drug treatment with normalized values of the risk factor
Participants who are aware of risk factor
values
a x 100 / c 93 x 100 / 218 = 42.7%
Non-pharmacological intervention effective
Participants with spontaneous reduction or non-pharmacological
interventions
Participants who are aware of risk factor values but not under
drug treatment
d x 100 / f 251 x 100 / 971 = 25.8%
Controlled prevalence Participants under drug treatment with normalized values of the risk factor
Participants with increased values of cholesterol, or values
normalized after successful treatment
a x 100 / (a + d + k) 93 x 100 / 2 610 = 3.6%
Population prevalence Participants with increased values of cholesterol including those
ineffectively treated All participants
k x 100 / l
2 266 x 100 / 4 892 = 46.3%
choLEsTEroL >= 240 mg/dL NormAL ELEvATEd ALL
Aware
Hypercholesterolemia treated
Yes 93 (a) 125 (b) 218 (c)
No 251 (d) 720 (e) 971 (f)
Not aware 2 282 (g) 1 421 (h) 3 703 (i)
Similarly, there is no statistically significant evidence of a relationship between SES group and treatment effectiveness to the exception of the higher treatment effectiveness in the higher group, although with a very broad confidence interval of the OR of 4.43 (CI 95% 1.58-12.37) (due to the small number of treated participants in this group (N=36)). Nevertheless, there is a tendency also in the middle SES group, if treated, to have a more effective treatment even if insignificant due to small power.
The control analysis for treatment using the three-dimensional Winkler-Index [15] including the educational status and also occupation and
household income, revealed almost identical results as with educational status alone, i.e. a significant influence of sex, age 50-69, visiting a general practitioner and living in Eastern Germany but not of social group.
discussion
The first representative health and examination surveys in Western Germany were executed in the framework of the German Cardiovascular Prevention Study (GCP) in the eighties [16]. Although the immediate effects TABLE 2
mEANs ANd PoPuLATioN PrEvALENcE of BLood LiPids (%) ANd quoTiENTs of choLEsTEroL dividEd By hdL AccordiNg To socio-EcoNomic sTATus (EducATioNAL LEvEL)
mEN
N=2 388 N=2 504WomEN LoWEr sEsN=729 middLE sEsN=3 160 highEr sEsN=1 003 N=4 892ALL
AvErAgE vALuEs
Cholesterol (+) (mg/dl) 240.8*** 237.3 248.7*** 238.7*** 233.0 239.1 HDL-Cholesterol (1) (mg/dl) 50.8*** 65.4 57.6*** 58.3*** 58.8 58.3
Cholesterol/HDL
Means of individually calculated
quotients (1) 5.14*** 3.89 4.72*** 4.50*** 4.36 4.50
PoPuLATioN PrEvALENcE (%) choLEsTEroL*
At risk 48.6 44.1 56.1 46.1 40.0 46.3
Borderline 33.2 34.2 27.3 34.2 36.7 33.7
Desirable 18.2 21.7 16.6 19.7 23.3 20.0
hdL-choLEsTEroL (1)*
At risk 25.3 20.6 30.0 22.3 19.5 22.9
Borderline 50.6 20.3 29.6 35.3 38.3 35.1
Desirable 24.1 59.1 40.3 42.4. 42.2 42.0
choLEsTEroL/hdL (1)*
At risk 13.6 3.0 8.9 8.3 7.2 8.1
Borderline 33.0 14.5 27.0 23.0 22.8 23.6
Desirable 53.4 82.5 64.1 68.7 70.0 68.3
* Threshold values Cholesterol malesHDL females HDL Chol/HDL
At risk ≥240 <40 <50 ≥7.0 Borderline 200 - <240 40 - <60 50 - <60 5.0 - <7.0
Desirable <200 ≥60 ≥60 <5.0
National Health Survey, Germany, 1998:
(1) 2 missing values
(+) Significance level calculated with linear regression analyses, in each case with independent variables sex and SES:
of this interventive community study upon the main cardiovascular risk factors were significant [17], long-term changes of the actual prevalence and treatment control remained modest with little (if any) change at the national level. This is even truer for Germany after unification and the results of the 1998 all German survey [3].
The present study confirms there are higher levels of risk for cholesterol and HDL in the lower SES groups without much change over the years but with a higher probability of
being treated for elderly and male persons, if in recent contact with a general practitioner and if living in Eastern Germany. However, as far as the effectiveness of treatment is concerned, these advantages disappear. For anti-hypertensive treatment [5], our previous study also showed no significant differences between socio-economic groups in terms of treatment status. Interestingly, the same findings (however statistically insignificant), showed that a recent visit to general practitioners TABLE 3
PhysiciAN coNTAcTs duriNg PrEvious 12 moNThs PEr socio-EcoNomic sTATus (sEs)
PhysiciAN coNTAcTs iN ThE gENErAL
PoPuLATioN, AgEd 30-69 yEArs LoWEr sEs(N=729) middLE sEs(N=3 160) highEr sEs(N=1 003) (N=4 892)ToTAL
Any visit to a general practitioner(a, b) 75.6%*** 70.7%*** 59.8% 69.2%
Average number of visits to a general
practitioner(b, c) 4.7*** 3.3*** 2.3 3.3
Average number of visits to any
physician including specialists(b, c) 9.9*** 7.6*** 6.1 7.7 National Health Survey, Germany 1998
a Chi2-test: distribution of lower and middle SES, respectively, versus higher SES group: *p <0.05; **p <0.01; ***p <0.001 b missing values set at “0”
c t-test: values of lower and middle SES, respectively, versus higher SES group: *p < 0.05; **p <0.01; ***p <0.001
TABLE 4
LogisTic rEgrEssioN of PoTENTiAL dETErmiNANTs of TrEATmENT of hyPErchoLEsTEroLEmiA ProBABiLiTy of TrEATmENT
N odds rATio 95% coNfidENcE iNTErvAL
fEmALEs 640 0.70 0.51-0.97
mALEs 549 1.00 (Ref.)
AgE 4 (60-69 yEArs) 374 3.57 1.91-6.68
AgE 3 (50-59 yEArs) 429 2.37 1.27-4.44
AgE 2 (40-49 yEArs) 244 1.07 0.52-2.19
AgE 1 (30-39 yEArs) 142 1.00 (Ref.)
visiT of A gP yEs 855 1.77 1.21-2.59
visiT of A gP No 334 1.00 (Ref.)
formEr EAsT gErmANy 319 1.89 1.37-2.60
formEr WEsT gErmANy 870 1.00
highEr sEs 198 0.82 0.48-1.38
middLE sEs 756 0.73 0.50-1.08
LoWEr sEs 235 1.00 (Ref.)
Treatment of hypercholesterolemia YES (N=218) or NO (N=971) of those being aware of currently or formerly elevated cholesterol (1 189/4 982). National Health Survey, Germany, 1998
constitutes a disadvantage in regard to the effectiveness of the treatment of risk factors made in the previous and present studies. We tried to explain that with a potential lack of literacy on both sides.
What could be the explanation for the low level of control for hypertension as well as for hypercholesterolemia (10.8 and 3.6%)? It is unlikely that attitudes and behaviour related to educational status are the main reasons, as differences have no significant effect. Insufficient compliance with treatment could be a reason. But taking into account the higher rate of physician contacts in the lower socio-economic group, this is unlikely to be the right explanation. However, the lack of control could also be explained by inappropriate prescriptions. We think for an effective control of hypercholesterolemia as well as of elevated blood pressures more is required than the usual medical check-up and consultation. Comprehensive community interventions have shown that risk factors can be reduced as in the German Cardiovascular Prevention Study [17] and several other studies of similar population size if efforts are continuous [18]. This approach, however, requires a multi-dimensional programme including, among others, continuing professional development of general practitioners in this field as well as
of related health professions and public health experts, organizational support of self-help groups and permanent presence of the issue in the media. We do not see this in Germany. Significant social group differences, although not there at the moment, may appear if more effective treatment can be established in the future [19].
conclusions
Without a broad community approach the control deficit of hypercholesterolemia and hypertension in Germany will not be compensated. At the present low level of effective treatment, no significant social group differences can be detected. This may be different if higher levels of control are achieved.
aCknowledgements: we are grateful to Professor Dr.
Thefeld, formerly Robert Koch Institute in Berlin, for his advice on the laboratory methods used in the German Health Survey.
ConfliCt of interest: none
TABLE 5
LogisTic rEgrEssioN of PoTENTiAL dETErmiNANTs iN TrEATmENT of hyPErchoLEsTEroLEmiA ProBABiLiTy of EffEcTivE TrEATmENT
vAriABLE N odds rATio 95% coNfidENcE iNTErvAL
fEmALEs 126 0.84 0.44-1.59
mALEs 92 1.00 (Ref.)
AgE 4 (60-69 yEArs) 100 1.20 0.33-4.28
AgE 3 (50-59 yEArs) 82 1.38 0.39-4.96
AgE 2 (40-49 yEArs) 23 0.58 0.13-2.67
AgE 1 (30-39 yEArs) 13 1.00 (Ref.)
visiT of A gP yEs 178 0.59 0.28-1.25
visiT of A gP No 40 1.00 (Ref.)
formEr EAsT gErmANy 86 1.26 0.69-2.29
formEr WEsT gErmANy 132 1.00 (Ref.)
highEr sEs 36 4.43 1.58-12.37
middLE sEs 128 1.93 0.91-4.08
LoWEr sEs 54 1.00 (Ref.)
Treatment effective YES (N=93) NO (N=125) of those with treatment of hypercholesterolemia (N=218). National Health Survey, Germany, 1998
references
[1] Farzadfar F, Finucane MM, Danaei G, et al. National, regional, and global trends in serum total cholesterol since 1980: systematic analysis of health examination surveys and epidemiological studies with 321 country-years and 3.0 million participants. The Lancet 2011; 377(9765): 578-86
[2] Ford ES, Li C, Pearson WS, et al. Trends in
hypercholesterolemia, treatment and control among United States adults. Int J Cardiol 2010; 140(2): 226-35 [3] Laaser U, Breckenkamp J.Trends in risk factor control in Germany 1984-1998: high blood pressure and total cholesterol. Eur J Public Health 2006; 16(2): 217-22 [4] Merkin SS, Karlamangla A, Crimmins E, et al. Education
differentials by race and ethnicity in the diagnosis and management of Hypercholesterolemia: a national sample of U.S. adults (NHANES 1999-2002). Int J Public Health 2009; 54(3): 166-74
[5] Laaser U, Breckenkamp J, Bjegovic V. Treatment of Hypertension in Germany: is there a social gradient? Int J Public Health 2011; 57(1): 185-91
[6] Thefeld W, Stolzenberg H, Bellach BM. The Federal Health Survey: response, composition of participants and non-responder analysis. Gesundheitswesen 1999; 61: S57-61
[7] Bellach BM, Knopf H, Thefeld W. Der Bundes-Gesundheitssurvey 1997/98. Das Gesundheitswesen 1998; 60(Suppl. 2): 59-68
[8] Rehm J, Sempos C, Kohlmeier L, et al. A comparison of serum total cholesterol levels and their determinants between the Federal Republic of Germany and the United States. Eur J Epidemiol 2000; 16(7): 669-75 [9] Mayo Clinic (2012). Cholesterol levels: What numbers should
you aim for? http://www.mayoclinic.com/health/cholesterol-levels/CL00001 and http://www.mayoclinic.com/health/ cholesterol-ratio/AN01761 (accessed 11 June 2012) [10] European Atherosclerosis Society Study Group. Strategies
for the prevention of coronary heart disease: a policy statement of the European Atherosclerosis Society. European Heart Journal 1987; 8(1):77-88
[11] Yang D, Liu X, Xiang M. The correlation between lipids ratio and degree of coronary artery stenosis. High Blood Press Cardiovasc Prev 2011; 18(2): 53-6
[12] Hatmi ZN, Mahdavi-Mazdeh M, Hashemi-Nazari, et al. Relationship between the pattern of coronary artery disease risk factors and lipid ratios with five groups of body mass index in 28566 healthy adults. Acta Med Iran 2011; 49(11): 730-6
[13] Hoffmeister H, Huetter M, Stolzenberg H, et al. Sozialer Status and Gesundheit. Nationaler Gesundheits-Survey 1984–86. Unterschiede in der Verteilung von Herz-Kreislauf-Krankheiten und ihrer Risikofaktoren in der Bevölkerung der Bundesrepublik Deutschland nach Schichten und Gruppen. BGA-Schriften 2/92. München: MMV Medizin Verlag; 1992
[14] Stolzenberg H. Bundes-Gesundheitssurvey 1998. Public Use File BGS98. Dokumentation des Datensatzes, Berlin; 2000
[15] Winkler J, Stolzenberg H. Der Sozialschichtindex im Bundes-Gesundheitssurvey. Das Gesundheitswesen 1999; 61(Special issue 2):178-183
[16] GCP-Study Group.The German Cardiovascular
Prevention Study (GCP): Design and Methods. European Heart Journal 1988; 9: 1058-66
[17] Hoffmeister H, Mensink GBM, Stolzenberg H. Reduction of Coronary Heart Disease Risk Factors in the German Cardiovascular Prevention Study (GCP). Prev Med 1996; 25: 135-45
[18] Puska P, Vartiainen E, Tuomilehto J, Nissinen A. 20-year experience with the North Karelia Project. Preventive activities yield results. Nordisk Medicin 1994; 109(2): 54-5