Left–Ventricular Pressure Relaxation and
Diastolic Function of Isolated Working
Mammalian Hearts at Hypothermia
Stefan F. J. Langer
Institute of Physiology, Charite´ University Medicine, Berlin, Germany.
Corresponding author:
Dr. Stefan F. J. Langer
Guineastr. 14, 13351 Berlin, Germany [email protected]
\
* Corresponding author. E-mail: [email protected] ISSN: 2410-2636 © Barcaray Publishing
© 2019 Author(s). This is an Open Access article distributed under the terms of the Creative Commons Attribution CC-BY-4.0 license CC-BY-4.0 (http://creativecommons.org/ licenses/by/4.0/), which permits use, distribution and reproduction, provided the original work is properly cited. Published by Barcaray (International) Publishing.
Abstract
Background
Hypothermia is well known to elevate the time constant (whatever model is used) of the isochoric left–ventricular pressure fall. Due to different critera in use, it remained unclear whether prolonged diastole in hypothermia is sufficient for complete relaxation Detecting and quantifying incomplete relaxation may become a valuable tool to prevent diastolic heart failure in hypothermia. Methods
Left–ventricular pressure decays in isolated guinea pig and rat hearts are analysed by 4–parametric regression at different temperatures, at sinus rhythm and electrical stimulation. Residual contraction (FRC) is introduced and quantified by extrapolating the model’s pressure forecast to end–systole, subtracting the asymptote, and normalising.
Results
Isochoric pressure decay fits the regression model at all temperatures and heart rates.Residual contraction is virtually absent at
normothermia and remains very small (FRC <3%) down to 31°C. Lower temperatures or pacing induces higher FRC. Eventually,
the isochoric pressure curve becomes considerably elevated and looses its concavity. Conclusions
Despite slower pressure fall, ventricular relaxation remains fairly complete at hypothermia, and depends on considerable autoregulation of the individual heart. It is concluded (not proved) that individual emergence of negative lusitropy may indicate imminent heart failure. Asymptotic pressure is interpreted as ventricular tonus, independent from velocity of relaxation. Gradual increasing time constants may be attributed to a general slowing of bioreactions as temperature falls. Remarkable curve shape changes may be caused by aftercontractions due to elevated Ca2+ sensitivity at hypothermia and high Ca2+ load by pacing.
Keywords: ventricular pressure; myocardial relaxation, diastole, hypothermia; isolated heart
ICFJ — Left–Ventricular Pressure Relaxation at Hypothermia 2
Introduction
Mild hypothermia is a secure and widely used method to reduce cardiac work and metabolism for surgical interventions. Experimental hypothermic heart failure only occurs during rapid or extended cooling as a sudden, rapid, and complex process. Consequently, we do not know much about prodromata and mechanisms of such failure at low temperature. As little or even positive inotropic effects of mild hypothermia has been surmised [1, 2], the diastolic function (lusitropy, relaxation) of the left ventricle became considered as a trigger of hypothermic heart failure. Due to a recent study [3], cooling renders ventricular relaxation incomplete despite its concomitant negative chronotropy. Such conclusion, however, depends critically on the soundness of modeling the isochoric (isovolumic) left–ventricular pressure fall and its extrapolation toward the onset of the subsequent systole.
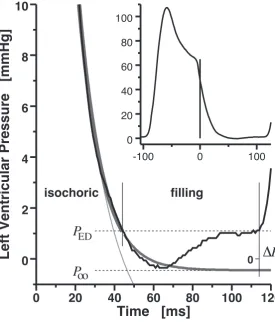
Figure 1 explains the fundamental idea; as a special feature, the method only demands the high–fidelity, phasic left–ventricular pressure (LVP) curve. Ventricular relaxation is described by non–linear regression fit of the isochoric LVP decay. Any
reasonable regression model, p, yields at least one time constant (τ, ”velocity” of
relaxation), and an asymptotic pressure (P∞, deepest possible ”extent” of relaxation).
Extrapolatingpinto the diastolic filling phase, ending attDia, when the following systole
starts, provides us with three rational indices of diastolic function:
• tDiaτ−1 expresses the apparent duration of diastole in units of the apparent
time constant, it remains unaltered if tDia and τ undergo proportional changes.
(The present paper also provides the ratio tFillτ∞−1.)
• FRC = [p(tDia)−P∞] [p(0)−P∞] −1
is the end–diastolic Residual Contraction, given as its fraction (hereafter: percentage) of the maximal possible pressure difference.
• ∆Pterm = LVP(tDia)−P∞ is the maximal pressure augment that may occur
by the actual diastolic inflow (added to the residual volume), where P∞ serves
as an estimate of the equilibrium pressure of the fully relaxed, hypothetically
non–filling ventricle (containing its residual volume only).
The present paper introduces the latter two new indices. It should be noticed that
all three indices depend on the underlying relaxation model (p) which we indicate by
superscripts, if necessary. Table 1 shows respective values observed in isolated small mammalian hearts at normothermia; data from comparable sample sizes are unavailable in the literature.
The present study aims to clarify:
(a) By what means can completeness of left–ventricular relaxation be quantified from
the intraventricular pressure curve?
(b) Does left–ventricular relaxation remain complete at hypothermia (by
0 20 40 60 80 100 120 0
2 4 6 8 10
Time [ms]
Left Ventricular Pressure [mmHg] 0
isochoric filling
Δ
PP
P
ED
oo
-100 0 100 0
20 40 60 80 100
Figure 1. Indexing diastolic function from the left–ventricular pressure course (black).
Data from an isolatedSprague–Dawleyrat heart, working at 37◦C, 75 mmHg mean aortic pressure, 39 mL min−1 cardiac output, sinus rhythm. Time definitions (perpendicular lines): Zero at the steepest decay of the empirical pressure curve, –min LV ˙P; tRlx, re–encounter of
the presystolic (antecedent end–diastolic) pressure;tDia, end of diastole (onset of subsequent
contraction); tFill = tDia −tRlx, diastolic filling time. Pressure definitions: Zero at ambient
barometer pressure;PED, end–diastolic pressure; P∞, asymptotic pressure, extrapolated from the isochoric relaxation model; ∆P = ∆Pterm = PED −P∞. Dark gray: Four–parametric logistic relaxation model (Lg4, parameters fitted to isochoric pressure fall: P0 = 45.9 mmHg,
P∞ = −0.4¯5 mmHg,τ0 = 20.2 ms,τ∞ = 11.0 ms). Light gray: Three–parametric exponential model (Ex3, P0 = 45.9 mmHg, P∞ = −3.5 mmHg, τ = 16.7 ms). Interpretation: (1.) Exponential regression is inapt to extrapolate the isochoric pressure fall if the latter deviates from exponentiality. (2.) The given pressure curve presents with complete relaxation, because the extrapolated pressure fall almost reaches its asymptote before tDia (both models). (3.)
About −P∞(∆Pterm)−1 = 0.4/1.5 = 27% of the diastolic filling work has been done by
ICFJ — Left–Ventricular Pressure Relaxation at Hypothermia 4
Table 1: Lusitropy of isolated small animal hearts at standard working conditions
G. Pig SD Rat Ferret
Sample size: 182 223 20
C80C90 C80C90 C80 C90
tBI ms 246.5277217 284210 209237180 244170 261.5304233 305226
tDia ms 63.58248 8641 729948 11245 62.39344 9343
PED mmHg 3.1980..5524 −9..2443 3.3508..3784 90..4914 2.3913..9581 −3.195.9
Exponential relaxation model Ex3 (3 parameters):
τEx3 ms 21.372916..35 1536..68 17.291126..87 3010..68 26.671735..43 3910..69
tDiaτEx3−1 [1] 2.883
.99 1.82
4.55
1.66 4.04 6.68 2.33
7.88
2.02 1.97 2.80 1.11
3.97 1.11 FRC(Ex3) % 5.60130.93.1 016.91.1 1.775.002.28 8.002.67 14.00119.90.7 190.00.7
P∞(Ex3) mmHg –3.880−.8413 2−.7715 –2.14−3.2613 4−.3921 –5.79−−218.2−−.1875 ∆Pterm(Ex3) mmHg 6.69211.22.9 162.22.9 5.81114.52.9 180.76.1 8.37417.13.1 204.13.5
Logistic relaxation model Lg4 (4 parameters):
τ0 ms 21.682915..85 1432..51 18.781025..95 2910..75 34.421744..40 5010..45
τ∞ ms 18.3725
.7 11.8
28.4
10.9 12.16
15.7 7.62
18.3
7.62 15.51
17.1 12.8
18.2 12.2
tDiaτ−1
∞ [1] 3.515
.03 2.39
5.14
1.85 5.89 8.23 3.03
10.2
3.03 3.68 5.27 2.65
6.00 2.65
tFillτ−1
∞ [1] 1.26
2.31 0.18
2.97
.066 2.72 5.94 0.88
7.50
0.70 .779 1.98
−1.0 2.61
−1.0 FRC(Lg4) % 3.4570..7280 09..0115 0.3410..6400 02..8300 3.27.7001.03 7.001.98
P∞(Lg4) mmHg –2.53−3.601.0−3.650.8 .021−5.449.8−6.634.7 –.144−1.5211 2−.4111 ∆Pterm(Lg4) mmHg 5.6428..7635 101.97.9 3.2308..5809 100.58.1 2.6805..4031 80..0512
Entries are sample medians with the limits of the central 80%–mass (C80) end central 90%–
mass (C90) of the sample.
Data from freshly isolated Guinea pig (G. Pig), Sprague–Dawley (SD) rat, and ferret hearts at standard condition: Protein–free perfusate, 2.5 mM Ca2+, 95% O2, 37◦C; mean
aortic pressure 60 mmHg (G. Pig) or 75 mmHg (rat, ferret), cardiac output 40 mL min−1 (G. Pig, rat; left ventricle mass below 1 g) or 60 mL min−1 (ferret; left ventricle mass above 2 g), spontaneous sinus rhythm.
tBI, interbeat interval; tDia, diastole (isochoric and filling) interval; PED, end–diastolic
(c) What extent of incomplete relaxation can the heart deal with in steady–state?
(d) Are there any special characteristics in the left–ventricular pressure course related
to incomplete relaxation?
2
Methods
Hearts of maleSprague–Dawleyrats and of mixed sex guinea pigs were isolated and
mounted to a temperature controlled artificial circulation apparatus in working left ventricle setup. Lusitropic parameters were estimated by non–linear regression with the well known 3–parametric exponential and with the more appropriate 4–parametric logistic model. Measurements were obtained at different temperature levels in steady– state and during adaptation after temperature jumps. Additional cooling experiments were performed with heart rate held constant by electrical right–atrial stimulation. Pacing was also used to increase the heart rate at selected levels of mild hypothermia, where either cardiac output or beat volume was held constant. We assess observed differences to normothermia as well as adaptation by non–parametric statistics.
2.1
Experimental setup and protocol
The isolated hearts hung loose in a temperature controlled atmosphere, fixed at the
aortic stump. Protein–free buffer solution (95% O2, 5% CO2, pH 7.4, 2.5 mM Ca2+,
glucose and pyruvate) was continually pumped to the left atrium, 40 mL min−1. Mean
aortic pressure of 75 mmHg (rat) or 60 mmHg (guinea pig, due to poorer durability) was maintained for the duration of the experiments. Temperature of the whole circu-lation was changed by switching water jackets to thermostatic reservoirs of the desired temperature; perfusate temperature always became constant within five minutes. If desired, the left atrium was electrically stimulated by a wire clamp. An intracaval catheter tip manometer provides high–fidelity LVP data which is digitised at 1 kHz rate and binned in 0.075 mmHg resolution. No filtering or data smoothing is applied. Further measurands and technical details were previously described [4].
All animals recieved professional humane care according to the Tierschutzgesetz
(German Animal Protection Act).
Test series are established as follows. All tests a specimen has been scheduled for are completed within 90 minutes after mounting the isolated heart.
A. Temperature changes with concomitant sinus bradycardia
A1. Temperature levels. Beginning with 37◦C, the heart becomes stepwise
cooled to 34◦C, 31◦C, and 29◦C. Additional levels, 40◦C or 25◦C, are
ICFJ — Left–Ventricular Pressure Relaxation at Hypothermia 6
A2. Adaptation. After recording LVP at normothermia, the heart is cooled in
one step down to 34◦C or to 31◦C. LVP samples are recorded every minute
within the first five minutes after switching the thermostate, followed by eight equidistant samplings in 16 min, and two samplings during the last
eight minutes. Temperature is than switched back to 37◦C, and the sampling
protocol repeated.
B. Pacing tests
B1. Cooling with spontaneous versus constant heart rate.
B1a. Steady–state Samples of hearts, working at mild hypothermia, are
drawn from our records of previous investigations, with respect to the present standard conditions; specimens with any pretreatment or de-viating setup are excluded. Hypothermia had been established either with decreasing sinus beat rate or with heart rate held constant at its
intrinsic value (at 37◦C) by electrical right–atrial pacing. After taking
the first data recording at hypothermia, the hearts were used for inves-tigations unrelated to the present study.
We compare the medians of samples with spontaneous vs. paced heart
rate at 34◦C (guinea pigs) or at 31◦C (rats), applying U–tests.
B1b. Adaptation We carry out protocol A2 in new samples (8 guinea pig, 10
rat hearts). In difference, we establish electrical right–atrial stimulation at normothermia to preserve the apparent beat interval length of the heart during the temperature change.
B2. Pacing at hypothermia. Mild hypothermia is established in 8 guinea pig
(34◦C) and 8 rat hearts (34 and 31◦C). Heart rate is then elevated from
the apparent bradycardia in steps of 15 beats per minute up to the sinus frequency seen at normothermia. LVP is recorded in steady–state after each step. In a small number of rat hearts, the pacing series was reversed to intrinsic bradycardia while the beat volume was held constant by reducing cardiac inflow.
2.2
Data analysis
Data processing software (by the Author) disassembled each 4–second LVP recording in single beats and their subintervals, as mentioned in Fig. 1. Simple pressure data is taken as the median of the respective values in the beat intervals. Non–linear regression applies to pooled (overlayed and abscissa–adjusted) LVP data taken from all but the one most outlying isochoric decay phases within the recording [5].
We use alternative regression models to determine the lusitropic parameters from the pooled data, the conventional 3–parametric exponential,
pEx3(t) =
P0(Ex3) −P∞(Ex3) exp−t
τ + P
(Ex3)
and its enhancement, the 4–parametric logistic model,
pLg4(t) =
P0(Lg4)−P∞(Lg4)
γ+ (1−γ) exp t
τ∞
+P∞(Lg4) , τ0 :=
τ∞
1−γ ;
we present the initial time constant, τ0, instead ofγ, the shape parameter [5]. Ift→ ∞,
pLg4 converges to an exponential function with time constantτ∞. τ0 is the ”local” time
constant valid at the begin (t = 0) of the isochoric decay, whereas the logistic time
constant, τ∞, becomes asymptotically as more ”valid” ast rises. Model Lg4 equals Ex3
if τ0 = τ∞, and it equals the long known 3–parametric logistic model [7] if τ0 = 2τ∞.
By that feature, Lg4 covers both models and varies continuously between them to fit the real LVP curve shape.
Samples are described by median and central 80 per cent massC80, i.e. the
narrow-est vicinity around the median that covers 80% of the sample. For drawing adaptation curves, values between adjacent recordings are linearly interpolated. Effects of
inter-ventions are assessed by Wilcoxon matched–pair tests [6] against normothermia or,
respectively, intrinsic sinus frequency. U–tests [6] are used in unpaired observations.
Steady–state vs. adaptation is assessed by Spearman’s rank correlation coefficient
(against t), testing the respective zero hypothesis [6]. We present (always double–
sided) error probabilities, p, for refusing zero hypotheses; in adaptation tests, we note
the number of significantly (p <0.05) revealed non–stationarity.
3
Results
Hemodynamics settles into durable steady–state at any temperature down to 29◦C;
rat hearts also stand 25◦C. Guinea pig hearts may work at this hypothermia level
at the risk of sudden failure. Such incident is usually induced by a sudden, severe derangement (like an ”aftercontraction”) of the isochoric pressure fall in a single beat. Due to the constant inflow, end–diastolic pressure immediately rises, and the ventricle becomes unable to contract productively. Cardiac function can be reestablished by a
transient unload, but we do not set hypothermia below 31◦C to the guinea pig protocol
to avoid such incidents.
Cooling always reduces coronary perfusion (concomitant rise in aortic flow) and oxygen extraction. End–diastolic pressure rises at spontaneous bradycardia. Systolic pressure rise velocity may be enhanced but is usually slightly depressed in mild and always diminished at deep hypothermia. Diastolic peak pressure fall velocity and the time constants of isochoric relaxation always indicate negative lusitropy. Relaxation model Lg4 reveals considerable changes in the shape of the isochoric LVP curve in
many hearts, when temperature or heart rate varies. We further observe that τ0 (Lg4)
generally resembles the changes seen in τ (Ex3).
3.1
Steady–state hypothermia
ICFJ — Left–Ventricular Pressure Relaxation at Hypothermia 8
Table 2: Lusitropic effect of temperature in steady–state, 40 mL min−1cardiac output
Guinea Pigs(N = 11) Sprague–Dawley Rats(N = 29)
Temp. [◦C]: 37 34 31 29 40 37 34 31 29 25
(n): (11) (10) (9) (9) (8) (29) (28) (28) (21) (5)
Unit abs. ∆% ∆% ∆% ∆% abs. ∆% ∆% ∆% ∆%
tBI ms 227246215 †253219 †536548 †8310374 †–12−−146 206 229 171
‡2633
16
‡5367
46
‡7887
59 126 162 120
tDia ms 9510875 ∗17426.16.0 118168106 †160204141 †–12−−416.7 10713584 ‡271041 ‡497315 ‡648232 8113269
VBeat µL 144152120 †213916 †516430 †589637 †–18−−398 133 155 106
‡2330
7
‡4864
24
‡69104
60 100 156
24
FCor minmL 12.7188..78 †–10−−206 †–13−−282 –17−−431 ∗–12−028 16.62113 1.0−823 ‡–9.3−317.1 ‡–11−024 –19−−1540
O2 Cons µminmol 7.395..80
†–26−15
−28
†–44−27
−50
†–51−34
−66 — 9.4
12 7
‡–19−11
−27
‡–2¯5−10
−30
‡–37−26
−47 –57
−54
−66
max ˙P mmHgms 2.42.8 2.1
†–16−5
−18
†–20−5
−23
†–26−10
−30
∗–11 8
−21 5.0
5.7 4.3
‡–8.1 4
−17
‡–8.3 4
−15
‡–17−9
−23 –48
−35
−55
–min ˙P mmHgms 1.921..16 †–15−13
−28
†–29−19
−61
†–44−32
−59 10
21
3 2.5
2.7 2.0
‡–22−9
−37
‡–40−30
−49
‡–47−38
−55 –5¯5
−28
−58
PED mmHg 4.¯551..89 †13−262 †47196−6 ∗98−44510 5.1−275 8.6320.2 ‡14−335 ‡14−982 ‡21−10014 18330043
Exponential relaxation model Ex3 (3 parameters):
τEx3 ms 18.42315..23 †396220 †668238 †8812232 3.2−4124 17.62912 ‡6114416 ‡122209−3 ‡16822961 9622588
tDiaτEx3−1 [1] 4.74 5.72 2.24
∗–12−1.0
−29 –16
13
−34 –11
20
−24 –13
4.5
−50 6.36
7.0 2.5
‡–260.14
−45
‡–34−2.0
−52
‡–34−6.6
−52 –20
65
−29
FRC(Ex3) % 0.881.70
.012 90 235
−39 98
387
−25 67
137
−62
∗992312
−42 .172
2.39
.072
‡3571419
−21
‡5832485
−93
‡8253446
6.4 154 643
−81
Logistic relaxation model Lg4 (4 parameters):
τ0 ms 18.82315..27 †386118 †668141 †9312351 –0.1−4730 20.22913 ‡5914441 ‡144−21520 ‡17426460 7122855
τ∞ ms 17.22112..74 ∗34−4823 ∗64−12226 ∗5517240 †–56−−4682 13.22210 ‡30−6719 ‡54−9422 ‡88159−3 158946139
tDiaτ∞−1 [1] 5.98
7.38 4.10 –10
33
−32 –9.7
26
−88 17
22
−14
†100234
32 8.08 11.7 5.36 1.78
52
−26 –4.0
58
−32 –12
36
−36 –34
−19
−106
tFillτ∞−1 [1] 3.73
5.82 2.37 –14
7.8
−49 –14
10
−89 –5.4
30
−21
†180263
26 5.08 7.6 3.1 –5.2
45
−33
∗–18 21
−44
‡–282.5
−56 –66
−28
−81
FRC(Lg4) % .3510.95
.045 100 457
−60 102
1635
−84 –37
106
−93
†–99−95
−100.052
0.4
.001 18 953
−91 153
1182
−100 339
1885
−100651
9103
−64
P∞(Lg4) mmHg –2.9
1.0
−16
∗2353
0 3.8
237
−97
∗112275
−18 24
57
−70 4.5
18
−4 8.0
77
−107
‡32114
−15
†49134
−18 130
190
−261
∆Pterm(Lg4)mmHg 6.20174.40.3 0.56 85
−40 18
122
−56 –31
65
−70 –14
51
−64 4.4
8.9
−0.3 18
85
−63 –12
73
−98 –5.7
61
−90 –73
2139
−102
N, number of specimens; (n), sample size. Guinea pigs: mean aortic pressure 60 mmHg, left ventricular mass, post–experimental wet, 912±67 mg (median ±mean absolute deviation); Rats: aortic pressure 75 mmHg, LV mass 823±43 mg. Table entries are absolute values (see
Unit) at 37◦C (normothermia), and percentages of change against normothermia in the
other columns; medians with upper and lower limit of the central 80% of the sample. Error probabilities in assuming no difference against normothermia (Wilcoxon matched–
pairs): ∗ p < 0.05; †p < 0.01; ‡ p < 0.001; at n ≤ 10, † becomes the highest possible
significance.
O2 Cons(umption) is tentative at hypothermia and absent at 40◦C, because the Clark
-300 -200 -100 0 100 0 20 40 60 80
Time [ms]
LVP [mmHg]
29 37 Co X X X X
X X X X
28 31 34 37 0
10 20 30
Temperature Flow [ml/min] X Beat Interval [ms]
X X X
28 31 34 37 200 300 400 500
Flow [ml/min] Beat Interval [ms]
aortic coronary X X X X X X X X
28 31 34 37 1000 1500 2000 2500 3000 LVdP/dt [mmHg/s] max - min o X X X X
28 31 34 37 4 5 6 7 8 9 10
O Consum. [ l/min] O Extraction [%]
X
X
X X
28 31 34 37 60 65 70 75
O Consum. [ l/min] O Extraction [%]
μ 2 2 X X X X X X X X
28 31 34 37 -4 -2 0 2 4 6 Pressure [mmHg] LVEDP
Poo X
X X X X X X X X X X X
28 31 34 37 10
20 30 40 50
Time Constants [ms]
τ τ τ oo 0 X X X X X X X X
28 31 34 37 0
1 2 3
Resid. Contract. [%]
(Ex3) (Lg4) X X X X X X X X X X X X
28 31 34 37 0 1 2 3 4 5 6
Durat. of Diastole [Number of T.C.]
Temperature [ C]o
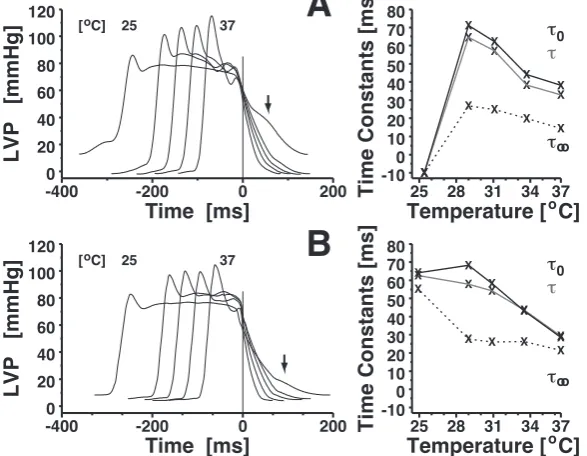
Figure 2. Isolated guinea
pig heart (male, left ventricu-lar mass 880 mg, postexperi-mental, wet) working in steady– state at different temperatures. Mean aortic pressure 60 mmHg, cardiac output 37 mL min−1.
Left–ventricular pressure (LVP) is shown from 5 s presystolic un-til re–encounter of end–diastolic pressure (LVEDP), adjusted to peak min LVdp/dt at t=0. O2
Consumption is BTPS at barom-eter 755 mmHg. P∞ by relax-ation model Lg4, τ (gray) by model Ex3. Last panel: tDiaτ−1
(gray), tDiaτ∞−1, (solid), tFillτ∞−1, (dotted).
end–diastolic pressure; however, some specimens (rat hearts, especially) stand mild hypothermia without loss of contractility. Negative lusitropic effects occur regularly in hypothermia, seen by reduced peak velocity of LVP decrease and by rising time
con-stants. However, the asymptotic logistic τ∞ may also decrease (at mild hypothermia)
in individual specimens, while the initial τ0 rises in almost all hearts. The relative
diastolic (and filling) times, expressed in units of apparent time constants, are typi-cally reduced in median at hypothermia, but abundant significance can be stated only
in tDiaτEx3−1 at rat hearts. Especially, there is no systematic quantitative change with
decreasing temperature level. Residual contraction remains typically below one per cent at normothermia. It does not necessarily increase, but may even multiply, at
hy-pothermia. Becoming aware of extended relative increases in FRC is a mere aftermath,
no incidents to note occurred during the experiments along with expressed increases of
FRC. Instead, the terminal pressure difference, ∆Pterm, seems to be noteworthy. It may
increase or decrease at different temperature levels, and may almost vanish at deepest
hypothermia (rat), but no heart was seen at steady work whilst PED < P∞.
ICFJ — Left–Ventricular Pressure Relaxation at Hypothermia 10
-400 -250 -100 50 200 0
40 80 120
Time [ms]
LVP [mmHg]
25 37 Co
X X X X X X X X X X
25 28 31 34 37 0
10 20 30
Temperature Flow [ml/min] X X Beat Interval [ms]
X X X
25 28 31 34 37 200 300 400 500
Flow [ml/min] Beat Interval [ms]
aortic coronary X X X X X X X X X X
25 28 31 34 37 1000 2000 3000 4000 5000 6000 LVdP/dt [mmHg/s] max - min X X X X X
25 28 31 34 37 4
6 8 10
O Consum. [ l/min] O Extraction [%]
X
X
X X X
25 28 31 34 37 60 70 80 90
O Consum. [ l/min] O Extraction [%]
μ 2 2 X X X X X X X X X X
25 28 31 34 37 -10 -5 0 5 10 15 Pressure [mmHg] LVEDP Poo X X X X X X X X X X X X X X X
25 28 31 34 37 10 20 30 40 50 60 70
Time Constants [ms]
τ τ τ oo 0 X X X X X
25 28 31 34 37 0
0.1
Res. Contr. (Lg4) [%] X Res. Contr. (Ex3) [%] X
X
X
X
25 28 31 34 37 0 1 2 3
Res. Contr. (Lg4) [%] Res. Contr. (Ex3) [%]
X X X X X X X X X
X X X
X X X
25 28 31 34 37 0 2 4 6 8 10 12
Diastole [T.C.]
Temperature [ C]o
Figure 3. Isolated Sprague–
Dawley rat heart (male, left ventricular mass 847 mg). Mean aortic pressure 75 mmHg, cardiac output 39 mL min−1, barometer 765 mmHg. Data shown as in Fig. 2.
isochoric relaxation changes remarkably from exponential (37◦C, τ
0 = τ∞) to logistic
curves, and the negative lusitropic effect of cooling is visible from the LVP and all
respective parameters. However, after an initial drop at 34◦C, ∆P(Lg4)
term remains stable.
Along with the mentioned shape change, models Ex3 and Lg4 purvey contrary findings about residual contraction at hypothermia, albeit both reveal ”complete” relaxation,
FRC below 3 per cent, at all temperatures. Filling time remains stable slightly above
2 × τ∞, while tDiaτ∞−1 even increases; model Ex3 likewise indicates proportionality
between tDia and τ.
The rat heart of Fig. 3 presents with end–diastolic pressure increasing as temper-ature is lowered, whereas peak LVP upstroke remains constant at mild hypothermia.
Remarkably, peak LVP decrease velocity becomes halved yet at 34◦C, but remains fairly
stable against further cooling. Concomitantly,P∞(Lg3) steps up at the first hypothermia
level without much further increase. Again, LVP relaxation becomes non–exponential below normothermia, thus models Ex3 and Lg4 estimate grossly different residual con-traction. Due to Lg4, it increases systematically with cooling, but relaxation remains
complete, FRC(Lg4) less than one per mille; Ex3 yields at least tenfold higher residual
-400 -200 0 200 0
20 40 60 80 100 120
Time [ms]
LVP [mmHg]
[ C] 25 37o
X X X X
X
X X X X
X
X X X X
X
25 28 31 34 37 -100
10 20 30 40 50 60 70 80
Temperature [ C]
Time Constants [ms] o
τ
τ
τ
oo 0
-400 -200 0 200
0 20 40 60 80 100 120
Time [ms]
LVP [mmHg]
[ C] 25 37o
X X X X X
X X X X X
X X X X X
25 28 31 34 37 -100
10 20 30 40 50 60 70 80
Temperature [ C]
Time Constants [ms] o
τ
τ
τ
oo 0
A
B
Figure 4. Emerging
distur-bance (↓) of left–ventricular re-laxation at 25◦C among two isolated Sprague–Dawley rat hearts; 75 mmHg aortic pres-sure, 40 mL min−1 cardiac
out-put. A: Pronounced elevation
of isochoric pressure decay. Vi-olation of the relaxation models compromises the regression pa-rameter estimates. B: More dis-crete disturbance. Time con-stants at 25◦C still plausible but iffy.
Hearts from Sprague–Dawley rats resist deep hypothermia easier than those
from guinea pigs. The former can present with articulated deviations from a normal isochoric left–venticular pressure fall in deep hypothermia. Such incident does not necessarily indicate imminent failure, but may be a steady–state phenomenon, seen within and beyond the LVP recordings of duration 4 s. Two examples are shown in Fig. 4. Obviously, the relaxation model assumtions (exponential or logistic shape) do not hold in such case, which is reliably detected by the goodness–of–fit index falling below 0.995.
3.2
Adaptation after jumps in temperature
Steps in temperature (protocol A2), downward as well as upward, may induce a con-tinuous transition of the LVP curve into a new shape, but may also trigger a mixed pattern of transient changes, as arrhythmia (premature and partial recontraction, es-pecially), or elevated diastolic pressure. However, such phenomena use to settle into steady–state within 4 to 8 minutes after three–degree steps. This also holds in rat hearts subjected to six–degree temperature steps, whereas about half of guinea pig specimens end up in failure (if not becoming deloaded or rewarmed) during six–degree jumps. We present results graphically with respect to this observation.
Cooling down guinea pig hearts by three degrees (Fig. 5) reduces LVP change velocities pertinently, with a (seemingly) slow but continuous partial recovery. End– diastolic pressure rises in all specimens (median +5%), with more extended partial recovery. Both initial and asymptotic time constant of the pressure fall rise in median
at cooling. However, whereas τ0, after an overshot for a few minutes, remains elevated
during the hypothermia phase, τ∞ presents with fluctuations which end up, in median,
ICFJ — Left–Ventricular Pressure Relaxation at Hypothermia 12
0 10 20 30 40 50 60 -50 -40 -30 -20 -10 0 10 20
max LVdP/dt [%]
0 10 20 30 40 50 60 -50 -40 -30 -20 -10 0 10 20
max LVdP/dt [%] 34 37 [ C]o
6 - 5 - 10
0 10 20 30 40 50 60 -50 -40 -30 -20 -10 0 10 20
min LVdP/dt [%]
0 10 20 30 40 50 60 -50 -40 -30 -20 -10 0 10 20
min LVdP/dt [%]
6 - 4 - 6
0 10 20 30 40 50 60 -40 -20 0 20 40 60 80 100 [%]
0 10 20 30 40 50 60 -40 -20 0 20 40 60 80 100 [%]
5 - 11 - 5
τ
00 10 20 30 40 50 60 -40 -20 0 20 40 60 80 100 [%]
0 10 20 30 40 50 60 -40 -20 0 20 40 60 80 100 [%]
3 - 11 - 2
τ
oo0 10 20 30 40 50 60 -40 -20 0 20 40 60 80 100 [%]
0 10 20 30 40 50 60 -40 -20 0 20 40 60 80 100 [%]
4 - 9 - 3
τ
oot /
Dia0 10 20 30 40 50 60 -100
0 100 200 300
Resid. Contract. [%]-1000 10 20 30 40 50 60
0 100 200 300
Resid. Contract. [%]
5 - 9 - 3
τ
Time [min]
Figure 5. Half–hour
adap-tation after temperature steps 37◦C→34◦C→37◦C in isolated working guinea pig hearts;N=11, left–ventricular mass 970±30 mg (median ± mean absolute de-viation), 60 mmHg aortic pres-sure, 40 mL min−1 cardiac out-put. Median per cent differ-ences to initial normothermia; time course (black) with samples’ 80% range (gray), the white lines show data corrected for individu-ally differing temperature change velocity. Statistics (gray head-lines) are numbers of significant (p <0.05) cases of non–constancy within the last 16 minutes of the respective temperature level (Spearman, first and last num-ber), and of median change after rewarming (U–test, central num-ber).
the Figure, are reversible by re–establishing normthermia. — Rapid cooling of guinea pig hearts by six degrees reduces the median LVP change peak velocities by fifty per cent or more. If not failing, the heart recovers partly within about ten minutes and presents with similarly altered lusitropic parameters as noted from the three–degree step samples.
Inter–individual variablity in the data is partially due to different temperature
change velocity. Rescaling the time abscissa of the measurements to the median
temperature–vs.–time course (white lines in the Figures) attenuates some overshooting
but does not provide new substantial insights.
We proceed to the larger rat heart sample at temperature dropping to 31◦C (Fig. 6)
and stress distinctions between the Figures. First, there are remarkable transients in
max ˙P during sudden temperature changes, but only less than ten per cent (median)
durable reduction at hypothermia in rat hearts. However, negative inotropy is seen
from rising PED in all but two specimens, by +36% in median. Second, increasing τ∞
is clearly revealed, with doubling in median. Slight but mostly significantly reduced
tDiaτ∞−1 during 31◦C, with small transient overshoots, is another revelation.
Accord-ingly, FRC is seemingly elevated at 31◦C, but starting from tiny absolute values at
Table 3: Hemodynamic effects of heart rate at mild hypothermia
G.Pig 34◦C Rat 31◦C
Heart rate: Spt Pac Spt Pac
(n): (88) (64) p < (168) (80) p <
tBI ms 339 260 0.001 353 226 0.001
VBeat µL 227 143 0.001 227 132 0.001
FCor minmL 9.0 9.8 0.666 14.3 13.5 0.019
O2 Cons µminmol 4.7 5.1 0.268 5.9 4.7 0.001
max ˙P mmHgs 1820 1873 0.225 4507 3504 0.001
–min ˙P mmHgs 1366 1447 0.071 1544 1372 0.062
PED mmHg 11.2 13.0 0.001 5.4 14.1 0.001
τEx3 ms 32.6 26.0 0.001 47.0 51.6 0.016
τ0 ms 32.5 27.6 0.001 55.0 55.1 0.761
τ∞ ms 29.3 20.5 0.001 23.1 28.2 0.001
tDiaτ∞−1 [1] 4.79 4.57 0.022 8.37 3.12 0.001
FRC(Lg4) % 0.84 1.54 0.001 .053 4.31 0.001
P∞(Lg4) mmHg 4.3 8.7 0.001 –0.5 3.5 0.002
∆Pterm(Lg4) mmHg 6.87 3.33 0.001 3.9¯5 12.1 0.001
Unpaired samples of size (n). Guinea pig hearts at 60 mmHg mean aortic pressure, and Sprague–Dawley rat hearts at 75 mmHg aortic pressure; cardiac output approx. 39 mL min−1 in all samples, steady–state. Spontaneous sinus bradycardia (Spt) vs. right–
ICFJ — Left–Ventricular Pressure Relaxation at Hypothermia 14
0 10 20 30 40 50 60 -50 -40 -30 -20 -10 0 10 20
max LVdP/dt [%]
0 10 20 30 40 50 60 -50 -40 -30 -20 -10 0 10 20
max LVdP/dt [%] 31 37 [ C]o
6 - 8 - 17
0 10 20 30 40 50 60 -50 -40 -30 -20 -10 0 10 20
min LVdP/dt [%]
0 10 20 30 40 50 60 -50 -40 -30 -20 -10 0 10 20
min LVdP/dt [%]
12 - 15 - 17
0 10 20 30 40 50 60 -100 0 100 200 300 [%]
0 10 20 30 40 50 60 -100 0 100 200 300 [%]
13 - 20 - 8
τ
00 10 20 30 40 50 60 -100 0 100 200 300 [%]
0 10 20 30 40 50 60 -100 0 100 200 300 [%]
10 - 18 - 7
τ
oo0 10 20 30 40 50 60 -40 -20 0 20 40 60 80 100 [%]
0 10 20 30 40 50 60 -40 -20 0 20 40 60 80 100 [%]
11 - 14 - 7
τ
oot /
Dia0 10 20 30 40 50 60 -100
0 100 200 300
Resid. Contract. [%]
Time [min]
Figure 6. Half–hour
adap-tation after temperature steps 37◦C→31◦C→37◦C in isolated working Sprague–Dawley rat hearts; N=21, left–ventricular mass 837±47 mg, 75 mmHg aor-tic pressure, 40 mL min−1 cardiac output. Presentment as in Fig. 5.
0 10 20 30 40 50 60 -80 -60 -40 -20 0 20
max LVdP/dt [%]
0 10 20 30 40 50 60 -80 -60 -40 -20 0 20
max LVdP/dt [%] 31 37 [ C]o
8 - 10 - 6
0 10 20 30 40 50 60 -80 -60 -40 -20 0 20
min LVdP/dt [%]
0 10 20 30 40 50 60 -80 -60 -40 -20 0 20
min LVdP/dt [%]
6 - 5 - 4
0 10 20 30 40 50 60 -100 0 100 200 300 400 500 [%]
0 10 20 30 40 50 60 -100 0 100 200 300 400 500 [%]
6 - 10 - 3
τ0
0 10 20 30 40 50 60 -100 0 100 200 300 400 500 [%]
0 10 20 30 40 50 60 -100 0 100 200 300 400 500 [%]
5 - 10 - 2
τoo
Time [min]
Figure 7. Adaptation
after temperature steps 37◦C→31◦C→37◦C at constant heart rate (right–atrial pac-ing) in Sprague–Dawley rat hearts; N=10, left–ventricular mass 840±29 mg, aortic pres-sure 75 mmHg, cardiac output 40 mL min−1. Presentment as in
3.3
Cooling with bradycardia or electrical pacing
Table 3 compares the hemodynamics at mild hypothermia with spontaneous bradycar-dia and with heart rate fixed at its normothermic value.
Pacing does not affect contractility at the 34◦C level in guinea pig hearts, nor does
it alter the median peak pressure fall velocity or tDiaτ∞−1. Anyhow, residual contraction
and pressure asymptote (Lg4) are significantly elevated in the pacing sample.
Pacing, compaired with spontaneous bradycardia, depresses the inotropy of rat
hearts at 31◦C substantially, as seen from max ˙P and P
ED. Lusitropy is also reduced;
interestingly, the exponential time constant (and τ0 of Lg4) remains unaltered, but
Lg4 reveals the effect by increasing τ∞. Consequently, tDiaτ∞−1 is halved, and a notable
amount of residual contraction (absent at bradycardia) appears with pacing.
It should be mentioned that the samples do not encompass hearts at imminent failure. The experimenter had had the option to abort the cooling/pacing process in order to preserve the specimen fit for other purposes. Over nine tenth of the hearts worked properly under the said conditions, gradualness of cooling is the most pertinent requisite.
Figure 7 presents the most pertinent changes caused by constant heart rate during temperature steps in rat hearts; compare with the variable heart rate experiments (Fig. 6, take heed of ordinate scalings). As its main effect, pacing reduces, but in
median only, the transient overshoots in max ˙P; the permanent depression of max ˙P
at 31◦C (–30%) is more substantial than seen with spontaneous bradycardia (–10%).
Course of depression in –min ˙P remains unaltered, but the broader C80 range (also
in max ˙P) suggests that pacing may put more hearts on the edge of failure. On the
other hand, pacing halves the median τ0 surplus, whithout changing the doubling of
τ∞, already seen with variable beat frequency. However, pacing impinges huge inter–
and intra–individual variability and non–stationarity on the time course of τ∞, and
renders tDiaτ∞−1 and FRC (not shown) quite meaningless. This phenomenon, as all
other changes, vanishes after rewarming. — Exactly the same pacing effects occur in
the eight guinea pig hearts (compare with Fig. 5), except max ˙P suffering no deeper
depression as found with variable heart rate. Especially, –min ˙P runs almost identical
to Fig. 5 (including the span of scattering), and median τ0 increase becomes doubled
by pacing, as in the rat sample. Opposit to the latter, pacing does not aggravate the
scattering of τ∞ in the guinea pig hearts.
3.4
Heart rate stimulation at mild hypothermia
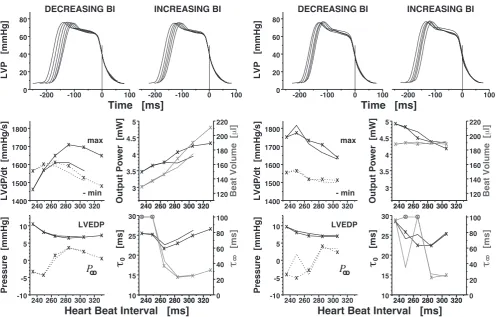
As a most unexpectant finding, the analysis of pacing series (protocol B2) frequently reveals a discontinuity of relaxation which is especially noticed in the asymptotic time constant. Overlayed LVP curves display, in about a third of the specimens, a visible ”gap” between a group of fairly continuously changing curve shapes at low heart rate and the two to four curves at the high frequency end of the series, which appear also in similar shape among themselves. Even if such gap is seemingly absent in the
ICFJ — Left–Ventricular Pressure Relaxation at Hypothermia 16
-200 -100 0 100
0 20 40 60
80 DECREASING BI
LVP [mmHg]
-200 -100 0 100
INCREASING BI X X X X X X X X X X X X
240 260 280 300 320 1400
1500 1600 1700 1800
LVdP/dt [mmHg/s]
max - min X X X X X X
240 260 280 300 320 3
3.5 4 4.5 5
Output Power [mW]
X X X X X X
240 260 280 300 320 120 140 160 180 200 220
Beat Volume [ l]
μ X X X X X X X X X X X X
240 260 280 300 320 -10
-5 0 5 10
Pressure [mmHg]
LVEDP Poo X X X X X X
240 260 280 300 320 10 15 20 25 30 [ms]
τ0 X
X X X X X
240 260 280 300 320 0 20 40 60 80 100 [ms] τ oo O O Time [ms]
Heart Beat Interval [ms]
-200 -100 0 100
0 20 40 60
80 DECREASING BI
LVP [mmHg]
-200 -100 0 100
INCREASING BI X X X X X X X X X X
240 260 280 300 320 1400
1500 1600 1700 1800
LVdP/dt [mmHg/s]
max - min X X X X X
240 260 280 300 320 3
3.5 4 4.5 5
Output Power [mW]
X X X X X
240 260 280 300 320 120 140 160 180 200 220
Beat Volume [ l]
μ X X X X X X X X X X
240 260 280 300 320 -10
-5 0 5 10
Pressure [mmHg]
LVEDP Poo X X X X X
240 260 280 300 320 10 15 20 25 30 [ms] τ0 X X X X X
240 260 280 300 320 0 20 40 60 80 100 [ms] τ oo O O Time [ms]
Heart Beat Interval [ms]
Figure 8. Right–atrial electrical stimulation of an isolated working guinea pig heart (male, left ventricular mass 950 mg) at 34◦C and aortic pressure 60 mmHg, with constant cardiac
output (39 mL min−1, left two colums) or with constant beat volume (right two columns). Beat interval (BI) length in sinus rhythm was 242 ms at 37◦C, and 331 ms at 34◦C. BI DECREASING by pacing (lines marked with X) and reverse BI INCREASING (lines without plot marks). Procedure repeated with constant beat volume by reducing cardiac inflow proportionally. Left–ventricular pressure (LVP) curves adjusted as in Fig. 2. P∞ estimated
by model Lg4. ⊗: τ∞ out of scale (between 142 to 153 ms); notice ordinate scale differing
from τ0.
pacing series ends. Such phenomenon, if present, is neither a transient one nor does it indicate imminent failure. Typically, the heart stands one or more additional steps in pacing rate until it fails. This holds in about two thirds of specimens (from both species), in the other hearts, the sudden τ∞ increase coincides with functional heart
failure. The said discontinuity is reversible by decreasing heart rate, and the reversion happens at the same or an adjacent rate step as in upward pacing. These incidents, as occurring inter–individually between different heart rate levels, render the median statistics scheme inappropriate. Hence we demonstrate the pertinent findings by the typical, non–outlying example shown in Fig. 8.
is also enhanced, seen by higher pressure fall velocity and decreasing time constants. Inotropy subsequently becomes as more depressed as heart rate approaches its
for-mer 37◦C–value. While peak pressure fall velocity decreases gradually and by limited
amounts, the relaxation time constants, τ∞ in particular, rise remarkably at a distinct
step in heart rate. The heart continues to perform steadily and even at further reduced
BI lengthes. Relaxation is fairly complete at hypothermic bradycardia, FRC(Lg4) < 1.8%
at the first three pacing levels (BI 330 down to 284 ms); this residual contraction rises to 6% at BI 265 ms and exceeds 20% and 23% at BI 249 and 234 ms, respectively. —
All parameters but max ˙P (that suffers an amount of time-dependent degradation) pass
through their former values if the heart rate change is reversed. LVP shape changes continuously with BI length, no ”gap” becomes visible in this example.
Such ”gap”, however, is about to appear in the constant VBeat pacing series,
per-formed in the same specimen (Fig. 8, right columns; notice higher spontaneous heart rate as an aftermath of the preceding pacing test). More durable positive inotropic effect of pacing is observed if the heart works with constant beat volume, increasing
its output and pumping power. Even so, the same leap in τ∞ and P∞ occurs at the
same (”critical”) BI length. Residual contraction is below 1.4% before the critical BI, 15% at BI 266 ms, and over 22% at shorter BI. Again, all parameter changes reverse
quantitatively if pacing frequency is lowered (except one outlying τ∞ at BI 249 ms).
4
Discussion
Incomplete ventricular relaxation as a possible mechanism of diastolic heart failure has long been discussed in concept, but still longs for a sound quantification. We hence tackle the important issues of extrapolating and of interpreting the obtained lusitropy indices first. Present findings will than find a straightforward assessment.
4.1
How to quantify completeness of ventricular relaxation
Consider thetransmural left–ventricular pressure (LVP),viz. intracaval minus the
pres-sure directly surrounding the ventricle. The latter is the intrapericardial prespres-sure in
situ, and is the ambient barometer pressure to the isolated heart, as in the present
ICFJ — Left–Ventricular Pressure Relaxation at Hypothermia 18
fitting a non–linear regression model to the isochoric (neither ejecting nor filling) phase of the LVP decay and extrapolating the model’s LVP forecast at the end of the actual diastole.
Such extrapolation is always a scabrous issue and depends on following assumptions: (1.) The regression model covers the process in question empirically correct (absence of systematic regression error); (2.) The factors that determine the model parameters remain unaltered and effective beyond the end of the regression interval, and new regardable factors do not supervene. A recent study [3], most related to the present one, utilises two three–parametric models, exponential Ex3 and logistic Lg3. However, by reasons given before [9], four model parameters are necessary, and Lg4 covers the isochoric pressure fall properly. Present results confirm that even the individual heart changes its isochoric LVP shape during temperature or heart rate alteration. This study
presents the exponential τEx3 for conventional reasons, but τEx3 carries no standalone
information, because the empirical data (and some mathematical reasoning) reveals
τEx3 ≈ τ0. Much more important, τ0 (and hence τEx3) describes the initial isochoric
pressure fall, whereas the late diastolic relaxation is under investigation. Consequently,
the asymptoticτ∞ is the pertinent time constant. Unacceptable in any analysis of late–
diastolic relaxation, Ex3 copes with the model violations by estimating much too small (too negative) pressure asymptotes [10], as also seen in Fig. 1. The same objection holds for Lg3 (3 parameters) if the actual LVP decays exponentially [9].
Concealing the problem of inferring pressure values from inappropriate models,
complete relaxation was originally declared if the time (tDia) from peak LVP fall to the
onset of the next systole is not less than 3.5 times the (exponential) time constant;
however, the authors also stated that shorter tDiaτ−1 ”does not necessarily imply the
presence of incomplete relaxation” [11]. This criterion is a mere recourse to a well known technical convention: As any exponential (with zero asymptote) falls from any value to about 3 per cent of this value within 3.5 times its time constant, the exponential process is practically ”finished” within this time. Evidence for a physiological meaning of that 3.5–criterion in diastolic function has not been provided. Furthermore, the criterion was as well used with a logistic time constant [3], in spite of the fact that the enigmatic multiple is 4.2 in that model to approach asymptote by 3 per cent of the
LVP at t = 0. Obviously, the straightforward index FRC yields the desired information
about completeness of diastolic relaxation, and this index can be calculated from any
LVP decay model that has an asymptota. Hence, we will not consider any tDia–based
surrogate further.
Another pertinent index in late diastole studies is ∆Pterm = LVP(tDia) − P∞.
LVP during refill was understood as the sum of active (myocardial) pressure decay and passive pressure rise due to the filling [12]; however, two issues must be made: Albeit the passive pressure–volume relation of the ventricle is linear in the range of interest [8, 12], the passive LVP rise is not, because inflow is not constant. This is well known as ”fast early filling” and clearly visible in Fig. 1. Furthermore, the asymptote of the active relaxation is often erroneously assumed as zero. The first issue
is accounted for by defining ∆P only at the end–point of diastole. Due to the Path–
sequence: 1., active LVP falls to its equilibrium pressure, P∞, without any filling; 2.,
imagine now mitral valve opens in absence of external filling pressure, i.e. left–atrial
transmural pressure zero; 3., finally, consider the really apparent PEDand complete left
ventricular filling at end–diastole (equilibrium volume). This analysis shows (Fig. 1,
notice the definition of zero pressure!): ∆Pterm represents the filling work (neglecting
dynamic energy dissipation). P∞ is the vis a fronte, the ventricle ”sucks in” volume if
P∞ < 0. PED is the vis a tergo, moving additional volume into the ventricle. Hence
−P∞(∆Pterm)−1 and PED(∆Pterm)−1 are the fractions of ”diastolic suction” and extra–
ventricular filling work, respectively. No knowledge of volumes is needed, but zero pressure must be adjusted to the ambient pressure (atmospheric, in isolated hearts). Reading the barometer, checking zero calibration after the experiment has finished, and accounting for temperature changing by the protocol, have demonstrated a drift of pressure zero calibration by some mmHg. Hence we do not interprete the absolute
readings. Fortunately, ∆Pterm does not depend on the absolute pressures.
Findings from B2 (Fig. 8) require to clear away an abundant misunderstanding. It
is important to understand, that large time constants in linearly scaled exponentials
do not indicate ”slow decay” but just indicate ”poor exponentiality” of the decay curve [5]. If the asymptote is a regression parameter (”variable asymptote”, now standard
in cardiac relaxation studies), any straight line (at any slope) is perfectly fitted by an
exponential with time constant ±∞. The same holds in logistic models. Hence, if the
late isochoric LVP curve straightens up, the regression fit will estimate unusual high time constants together with an unreally low (negative) pressure asymptote. Such observations should be recognised as a LVP course deviating from both exponential
and logistic shape at the late isochoric phase. Asymptotic parameters (τ∞, P∞) do not
describe the future physical situation at end–diastole if such model deviation occurs. Aforesaid model violations are exceptional. Load–clamp experiments in muscles (including cardiac) illustrated that under most different loading conditions (and
tem-peratures) the time course of muscle relaxation eventually converges into exponential
shape [13, 14]. This property is exactly what the logistic model describes by converging
into an exponential with time constant τ∞ as time elapses.
4.2
Interpretation of the results
Hypothermia reduces cardiac oxygen demand and became a valuable therapeutic option in heart and extra–cardial diseases, fostered by good contractility of the hypothermic ventricle. Inotropy is preserved by intramyocardial regulation [1] and is also effective in the hypothermic working ventricle [2]. Present observations, especially the up/down– regulation of contractility after abrupt temperature steps (A2), accord with these find-ings. Their remains a limited negative inotropic net effect of cooling in steady–state;
however, long–term degradation of the isolated heart [15] plays a rˆole (seemax LVdP/dt
curves in Figs. 5 and 6). Preserved inotropy is further seen from obviously still effective
heterometric autoregulation (Frank–Starling) in the present data, especially in the
constant output vs. constant beat volume series (B2). Temperature–dependent
ICFJ — Left–Ventricular Pressure Relaxation at Hypothermia 20
peak LVP upstroke velocity. Severe negative inotropy occurs only below 30◦C.
Positive inotropy at mild hypothermia has focussed attention on concomitant di-astolic dysfunction [16]. Long since known, the time constant of isochoric LVP fall increases with cooling [3, 4, 17, 18], as in present material. Its relation to diastole duration, howbeit early mentioned as an index of incomplete relaxation [11], is usu-ally not presented in the literature, probably due to some polypragmaty of methods
to calculate time constants. The 3–parametric logistic model (Lg3, i.e. Lg4 but with
τ0 = 2τ∞) was suggested to fit isochoric LVP properly, regardless of temperature in
canine ventricles [18]. Present observation in small animal hearts reveal considerable LVP shape changes during cooling, properly covered only by the 4–parametric Lg4.
A recent study [3] provides pertinent data from hypothermic pig hearts in situ,
using models Ex3 and Lg3. Mild hypothermia (33◦C) halves the ratio t
Diaτ−1 (τ taken
from Ex3 as well as Lg3), but tDiaτ−1 > 3.5 still holds at spontaneous bradycardia.
This was originally (canine hearts, normothermia) told to exclude incompleteness of
relaxation [11]. Study [3] found tDiaτ−1 < 3.5 only if mild hypothermia was combined
with pacing. Their authors ”aimed to clarify whether this reflects increased myocar-dial passive stiffness or whether this is a consequence of incomplete relaxation.” [3].
They assume evidence of incomplete relaxation if the end–diastolic pressure vs.
vol-ume curve (obtained by pacing) shifts leftward, and conclude that mild hypothermia
is an example of incomplete left–ventricular relaxation [3]. Pressure asymptota (P∞)
estimates are not presented, and the said ”leftward shift” not quantified to justify the term ”incomplete” relaxation physiologically.
The issue is obvious: Just by definition, any asymptotic process remains incomplete
at any time. We can not avoid to search for an empirically allowable or ”safe”FRC–limit
with respect to imminent diastolic heart failure.
Shortening of tDiaτEx3−1 and of tDiaτ∞−1 is also seen in the present isolated hearts at
hypothermia (Tab. 2). However, relaxation remains obviously complete at mild
hy-pothermia, as evidenced straightforward by FRC. The percentage of residual
contrac-tion at end–diastole is so tiny at normothermia that even the most extreme multiples, seen in A1 (Tab. 2), do not reach 3 per cent. This observation is in no conflict with the findings of the mentioned study [3]. The opposite conclusions are likely based on different definitions of a complete relaxation.
Usually, P∞ becomes elevated at hypothermia, just indicating that the potential
extent (as seen in the isochoric phase), but not necessarily the completeness (seen at
end–diastole), of relaxation is lower in hypo– than in normothermia. The (assumed non–filling) ventricle can never encounter pressures below its equilibrium pressure
(es-timated by P∞), hence incompleteness is an ambiguous term referring to elevated
pressure asymptotas. With respect to cardiac tonus [19] one may ask for the smallest
P∞ ever possible at given residual volume in absence of any myocardial tonus.
Car-diac tonus is not the–less–the–better but contributes to adjusting presystolic myofiber lengthes (heterometric autoregulation) [20]. Increased stiffness at hypothermia [3] re-quires higher end–diastolic LVP (as in Tab. 2 and Fig. 3) to stretch the pre–systolic
ventricle properly. Higher P∞ (also seen in the data) may be adequate in such
limit, it renders relaxation impossible, not incomplete. One may reasonably construe such situation also as a kind of diastolic failure, but should keep in mind that diastolic filling time is unrelated to this condition.
Incomplete relaxation can be induced by pacing at normothermia [11] and at hy-pothermia [3]. This is never due to the mere shortage of diastolic filling time in these steady–state observations. The time constant(s) of isochoric LVP decay increase
co-evally,τ∞ of model Lg4 is the most sensitive one. Presently calculated residual
contrac-tion emerges and rises over ten per cent. Incomplete or impaired relaxacontrac-tion also occurs at deep hypothermia (Tab. 2, Fig. 4). All aforesaid holds in median; the eighty per cent ranges of all lusitropic parameters (Tab. 2) reveal that many specimens (as those in Fig. 2) settle to steady–state with enhanced lusitropy even at deep hypothermia. These hearts may be safe from diastolic failure, but the study’s protocol keeps no track on such individual information.
We suspect re–excitation of cardiac myofibrils due to a transient intracellular Ca2+–
overload as the cause of incomplete relaxation. This conjecture is motivated by discrete exalterations in the isochoric LVP fall (Fig. 4) and sudden drops in the goodness–of–fit
of the relaxation model Lg4, together with unusually high τ∞ and low P∞ estimates.
Cytosolic Ca2+ encumbrance evokes aftercontraction of relaxing cardiac myofibers [21],
hypothermia increases the Ca2+ sensibility [1], pacing increases myocytal Ca2+ load
and turnover, and the present specimens work with double free Ca2+ concentration (no
Ca2+ binding protein in the perfusate). Consequently, the Ca2+ transient occurring
intracytal by unbinding Ca2+ from troponine may cause aftercontraction, especially if
sodium or ATP dependent Ca2+ transporter are depressed by hypothermia.
On the other hand, preserved complete relaxation at hypothermia, as seen in many specimens, may be explained in terms of myocardial autoregulation in isolated hearts. Hypothermic bradycardia at constant cardiac flow activates positive inotropic hetero-metric autoregulation by larger filling volumes. Long–standing experience speaks for inotropy and lusitropy being positively correlated in the presence of regulatory path-ways, as in isolated hearts. Protocol A2 confirmes such autoregulation after tempera-ture changes.
4.3
Limitations
Pertinent lusitropic parameters are estimated by the relaxation model Lg4 which is known to leave a small systematic error, resembling an oscillation [5]. LVP always falls a little bit faster at its peak decay velocity and a little bit slower at the terminal isochoric phase (hardly seen in Fig. 1), as predicted by Lg4. We refrain from a correc-tion, because (a.) we draw no conclusions that may depend on highly valide values; (b.) we assume that this is a mechanical vibration of the hanging heart, induced by blood momentum, that is unrelated to ventricular relaxation and does not bias the fit-ted regression parameters. The study is based on data from two small animal species and reveals some differences between them; other species may show deviant behavior.
Impaired isochoric LVP decay is stated from inspection and obtrusive τ∞ and P∞