ISSN: 2347-7474
International Journal Advances in Social Science and Humanities
Available online at: www.ijassh.com
RESEARCH ARTICLE
Portfolio Investment versus Foreign Direct Investment: A China-US
Comparative Study
Tam Bang Vu*, Eric Iksoonim
Department of Economics, College of Business and Economics, University of Hawaii-Hilo, 200 W. Kawili Street, Hilo, Hawaii, 96720, USA.
*Corresponding Author: E-mail:[email protected]
Abstract
This paper investigates the costs and benefits of portfolio investment versus foreign direct investment (FDI) in a comparative study between China and the US. Recently, China‟s authorities have announced a plan to make the Reminbi fully convertible in the near future. This relaxation of the capital controls surely will benefit foreign firms, who are doing business with China and who want to transfer money easily from Chinese bank to a foreign bank. However, this raises the questions of whether or not the full convertibility benefits China. This paper shows empirical evidence that the US benefits much more from portfolio investment, which often rises sharply with full convertibility, than China does. In contrast China benefits much more from FDI, which can flourish without full convertibility, than the US does. The paper concludes that China might want to phase out its full capital convertibility slowly over time instead of implementing the process abruptly in the near future.
Keywords: Capital controls, Capital liberalization, Currency convertibility, Investment. JEL Classification: F21, F36
Introduction
Full capital convertibility and capital controls once more stir heated debate among economist worldwide thanks to the recent financial crisis of 2007-2008. It brings back the memory of the 1997-98 Asian financial crises that occurred in countries with full capital convertibility. Controversial statements on whether or not capital liberalization boosts economic growth or exposes a nation to speculative attacks was fiercely exchanged for several years after this painful event. Ten years later, the issue of capital
convertibility has come back, especially
concerning transition economies like China and Vietnam. China‟s accession to the World Trade Organization (WTO) in 2001 had resulted in their current-account convertibility as required by the WTO. Recently, China‟s authorities have also emphasized that they would make the Renminbi fully convertible in four or five years. But is this good for China?
Recalling the crisis of 1997-98, China emerged as one of a few countries that was not affected much by it. Since research has pointed out that corrupted government and financial weakness caused financial crisis, do these imply that the
China‟s governments is clean and its financial system is strong? To see this, one can look at the “Table of Corruption” on page 122 by Tanzi [1] where China is almost as corrupted as Indonesia, a little more corrupted than Thailand, and nearly twice as corrupted as Malaysia and South Korea. Krugman [2] also points out that China has a higher proportion of bad banks than any of these four crisis nations. If these were the only two causes of the crisis, China would be swept into them. Then why did China escape the sorrowful experience of their neighbors?
Regarding the subject of capital liberalization, most of the existing literature blurs the distinction between the flows of long-term capital represented by foreign direct investments (FDI) and short-term flows such as portfolio investments and foreign loans supported by the full convertibility of capital accounts. This lack of clarity makes it difficult to draw solid lessons for China that has attracted a large amount of FDI with tight control on the convertibility. Hence, a simple theoretical framework that incorporates these two concepts is introduced for analyzing this type of economy.
Section Two of this paper surveys theoretical and empirical literature on capital liberalization. Section Three discusses methodology and data issues. Section Four analyzes the results, and Section Five concludes.
Literature Review
Theoretical Literature
There are many authors who support capital liberalization. Theoretically, opening up capital account was considered a good sign toward a free market economy that guaranteed sustained growth thanks to capital inflows, which provided funds for domestic investment. Henry [3] uses a capital asset price model (CAPM). He assumes that the host country is poor and small, so its risk-free rate would fall to the world rate level when its capital market is liberalized, and the covariance of the local market with the world market is less than the local market variance. Hence, both components of capital cost-the risk-free rate and the equity premium-would fall at the opening of the capital market. This results in higher investment. However, his model shows that the increase is only temporary at the opening, which is static instead of a dynamic analysis on growth effects. Additionally, capital liberalization is narrowly defined as the opening of stock market, which accounts for a small percentage of the capital inflows and which is not an important source of external financing in most countries.
Theoretical papers that fight against capital liberalization have two arguments. First, capital liberalization exposes a country to financial volatility and speculative attacks. Second, it fosters moral hazard due to easy credit expansions together with deposit or loan guarantees. Chang and Velasco [4] build a model on speculative attacks and banks‟ illiquidity. They assume a small open economy with constant return technology that is illiquid. There is only one good, which is freely traded in world market.
The banks honor the customers with “first come, first serve” principle and maximize their customers‟ expected utilities. Under capital liberalization, the domestic banks are obligated to carry out capital convertibility. Hence, a bank would become insolvent if its short-run obligation exceeds its long run assets in a speculative attack, as all investors wish to withdraw their deposits immediately. In this case, a bank run occurs that leads to a financial crisis.
Corsettti et al. [5] formulate a model on moral hazard. Similar to Chang and Velasco [4], they assume a mall open economy in which residents can borrow freely abroad thanks to capital liberalization. In contrast to Chang and Velasco, they assume a stochastic technology, and add a labor market. These two features make the model more realistic than the other one. An elite group, who runs the intermediary banks and expects the government‟s bailout, represents the corruption of the government and the weakness of the financial system.
The bailout expectation induces too much investment by the elite. The financial and currency crises happen when the government reserves falls below a threshold level. This twin crisis fits the empirical evidence of the Asian crisis better than the above model, but both models have more broad definitions of capital liberalization than the one by Henry [3] and so are quite convincing in showing the costs of capital liberalization to small open economies.
Concerning China, Lardy and Douglas [6] argue that China has not achieved three preconditions for full capital convertibility. First, China‟s domestic banking system is still very week; second, China‟s domestic financial markets are relatively new and fragile; finally Cina has not reached an equilibrium exchange rate. Hence, they strongly advise against full capital convertibility for China in the near future.
since people have tendency to invest in foreign countries so that they can evade taxes, convertibility contributes to inefficient allocation of capital. Finally, herd behavior and asymmetric information can easily cause panics, bank runs, and crises in financial markets.
Similar to Cooper [7], Ingves [8] has a neutral voice regarding capital liberalization in normal situation. In contrast to Cooper, Ingves believes
benefits of capital liberalization include
expanding opportunities for greater investment, smoothing consumption overtime, and sharing risk. The two authors‟ disparity comes from different definitions of capital liberalization: Ingves defines it as free flows in FDI, equity, and foreign loans in addition to capital account convertibility, whereas Cooper refers to capital account convertibility only. Even so, Ingves agrees with Cooper that capital flows can disrupt both financial sector and macroeconomic stability. He also adds the possibility of financial abuse by unsound banks due to high flows of capital: disguising weak balance sheets, taking excessive risks, and involving in fraud, embezzlement, and international money laundering.
Empirical Literature
Edison et al. [9] survey literature on macroeconomic effects of capital liberalization. They review twelve papers on the subject. Only two papers show that financial liberalization definitely has positive effects on growth in both developed and developing countries. The remaining papers reviewed by Edison et al. [9] do not find any evidence that capital liberalization speeds up growth.
Inspired by this mixed result, Edison et al. [9]
modify the above models: They add government reputation as a proxy for institutional strength. The result shows that when this variable is added to each of the above models, the benefits of capital account openness disappear. However, when they add an interaction term between GDP and capital liberalization, the impacts of liberalization is slightly positive for rich and middle-income countries but insignificant for poor countries. Klein [10], who estimates a panel data of 71 countries, finds similar results: Only one-quarter of the countries, those with high-quality institutions, receive positive impact of capital liberalization on growth. Hsieh at al. [11] also confirm the theoretical model on herding behaviour with empirical evidence that show how dangerous this behaviour could be to the Asian and Latin American countries.
While the benefits of capital liberalization in general is not clear, many countries hope that capital inflows de factor such as FDI and foreign loans help domestic firms acquire new technology and foreign capital for investment. Park and Song [12] provide a table reporting actual capital inflows, which they believe as the results of capital liberalization, to the four crisis countries on page 67 of their paper although they do not give a definition of capital liberalization. Using the IMF‟s International Financial Series CD-ROM ,we calculate and compare growth rates of these capital inflows to the crisis countries with those to China. The results show that average growth
rate of these capital movements de factoto China
was greater than either of the four crisis countries during 1990-1997. This implies that a country
might not need capital liberalization de jure to
increase capital inflowsde facto.
As to strengthen our intuition, Aizenman and Noy [13] find that capital liberalization de jure does not affect capital movements de facto much. Their paper is the first to provide a clear distinction between these two terms, which we
utilize as our definitions of de jure and de facto
liberalization in this paper. Furthermore, real GDP in China has also grown at an annual rate of nine percent during the last eighteen years. Thus, China might not need capital liberalization de jure to support their growth. Vu at al. [14] confirm that Vietnam and China did benefit from this type of capital liberalization. Vu and Noy [15] also find that developed countries benefit from FDI as well.
So what kind of theoretical framework can analyze this phenomenon? The following section attempts to answer this question.
Methodology and Data
We carry out data analyses on the effect of
long-term FDI versus short-terms portfolio
investments, which often accompany full convertibility, on economic development in China using a system of equations to account for the possible feedback effects between foreign capital and economic development:
k t i k t i k t j n j j f k t i
it k a u v
y
, , 1 , 10
k t i k t i k t p q p p k t i fit y c r t
k
, , 1 , 10
(1)
where y is either real GDP per worker (henceforth
foreign capital per worker, which includes foreign direct investment (FDI) and portfolio investment (PI), all are in logarithmic forms. Subscripts i and t are for region and time with their respective disturbances. The vectors „a‟ and „c‟ consist of auxiliary and control variables for the two equations in system, respectively.
The feedback effects call for simultaneous-equation estimations that are only consistent in large samples. To enlarge the dataset, data are collected for the US and three Northeast Asia Countries of China, Korea, and Japan. Data for FDI, gross fixed investment, and portfolio investments for the years 1979-2011 are from indexmundi.com website. Two dummies are generated for China and the US, leaving Japan and Korea lumped together as the reference group, so that the specific effects on the US and Chinese economy are compared and contrasted against the other two countries. Other data for China are from China‟s Statistical Yearbook at National Bureau of Statistics of China website.
They comprise real GDP, employment,
population, and a vector of control variables such as accumulated investment as a proxy for
domestic capital, exports by foreign-own
enterprises, infrastructures, school graduates ratio to population as a proxy for human capital, etc. Data on regional effects are for China and only available for eight regions-Liaoning, Shanghai, Zhejiang, Hebei, Shandong, Hubei, Guang Dong, and Chongqing- that attract substantial amounts of both FDI and portfolio investment (PI) during 1997-2003.
Governance data are from WGI website and
consist of political stability, government
effectiveness, regulatory quality, rule of law, control of corruption. Data on real interest rate and real exchange rate for all three countries, as well as data on the other variables for the US, Korea and Japan, are from United State Department of Agriculture and World Bank‟s World Development Indicators (WDI). Interaction terms of FDI and PI with two dummies for China and the US are generated.
A testing-down approach is used to avoid omitted variables, starting with all variables that might affect growth in Romer [16]. Then Variance Inflation Factor tests (VIF) are employed to eliminate variables with high multicolinearity. After several rounds of VIF tests and a Granger-Causality test, the first equation has six remaining variables: domestic capital, human capital, infrastructure, FDI, PI, and government effectiveness. The second equation has five
remaining variables for the second equation: productivity or per capita income, infrastructure, exports, rule of law, and control of corruption.
In cross sectional estimations, finding an instrumental variable (IV) is very difficult. Panel-data estimations enable the use of lagged dependent variables as IVs for the reduced forms, which are estimated using the SGMM procedure. The predicted values of education and economic growth are then used as IVs in the 3SLS estimations for System (1). Akaike Information Criteria procedures are performed to pinpoint the number of lagged values in the models. The results show that each equation needs two lagged values. Hence the third lagged values of the dependent variables are used as the IVs for the first stage of the estimations. Autocorrelation and heterosckedasticity are controlled for all
estimations. Since R2only gives meaningful
interpretation in OLS, we report root mean square percentage error (RMSPE), an alternative measure of fitness for 3SLS estimations; 0 < RMSPE < 1; smaller RMSPE means better fit.
Results
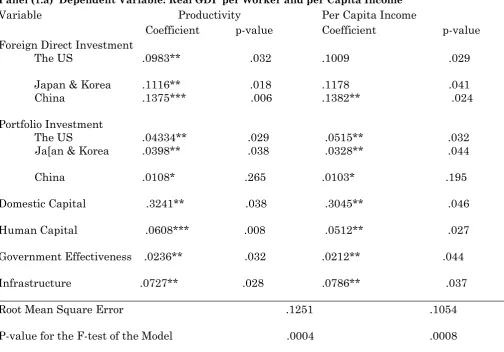
Table 1 reports the aggregate effects of long-term investment/FDI versus short term-investment/PI on productivity and per capita income. Coefficient of the first lagged value is added to the coefficient of the second lagged value for each variable and an F-test for the significance of the sum is performed. Coefficients for China and the US are then obtained by adding coefficient of each interaction term to coefficient of the reference group (Korea and Japan combined). An F test for the significant of each sum is then performed. The results show that the effects of FDI on productivity are positive and at least twice as much as those of portfolio investment (PI) with the highest effect going to China, the reference group the second, and the US the least. Furthermore, the coefficients of FDI are highly significant for all three groups whereas those of PI are highly significant for the US and the reference group while it is only weekly significant for China. The results are similar for the effects on per capita income.
Table 1. Aggregate Effects of Foreign Investment on Economic Development Panel (1.a) Dependent Variable: Real GDP per Worker and per Capita Income
Variable Productivity Per Capita Income
Coefficient p-value Coefficient p-value
Foreign Direct Investment
The US .0983** .032 .1009 .029
Japan & Korea .1116** .018 .1178 .041
China .1375*** .006 .1382** .024
Portfolio Investment
The US .04334** .029 .0515** .032
Ja[an & Korea .0398** .038 .0328** .044
China .0108* .265 .0103* .195
Domestic Capital .3241** .038 .3045** .046
Human Capital .0608*** .008 .0512** .027
Government Effectiveness .0236** .032 .0212** .044
Infrastructure .0727** .028 .0786** .037
_____________________________________________________________________________________________
Root Mean Square Error .1251 .1054
P-value for the F-test of the Model .0004 .0008
_____________________________________________________________________________________________ Panel (1.b) Dependent Variable: Foreign Direct Investment or Portfolio Investment
FDI Portfolio Investment
Coefficient p-value Coefficient p-value
Productivity
The US .0896** .045 .1243*** .005
Japan & Korea .0786** .037 .1409** .018
China .1035*** .006 .1145** .041
Per Capita Income
The US .1078*** .009 .1402** .046
Japan & Korea .0912** .034 .1575*** .008
China .1124** .024 .1287** .026
Rule of Law .0416** .038 .0286** .046
Control of Corruption .01279*** .008 .0176** .048
Infrastructure .1732** .034 .0895* .083
Exports .1709** .019 .0874 .562
_____________________________________________________________________________________________
Numbers of Observations 120 120
Root Mean Square Error .1352 .1184
The *, **, and *** denote 10%, 5%, and 1% significance levels, respectively.
and then China. The signs of the auxiliary and
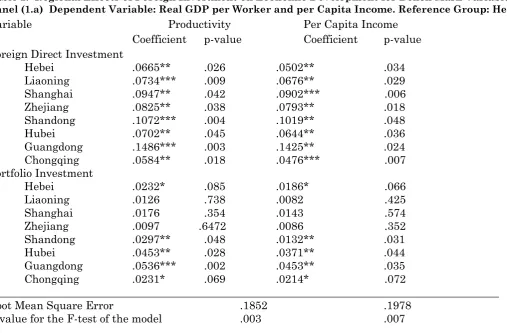
Table 2. Regional Effects of Foreign Investment on Economic Development for Bench Mark Variables Panel (1.a) Dependent Variable: Real GDP per Worker and per Capita Income. Reference Group: Hebei
Variable Productivity Per Capita Income
Coefficient p-value Coefficient p-value
Foreign Direct Investment
Hebei .0665** .026 .0502** .034
Liaoning .0734*** .009 .0676** .029 Shanghai .0947** .042 .0902*** .006
Zhejiang .0825** .038 .0793** .018 Shandong .1072*** .004 .1019** .048 Hubei .0702** .045 .0644** .036 Guangdong .1486*** .003 .1425** .024 Chongqing .0584** .018 .0476*** .007
Portfolio Investment Hebei .0232* .085 .0186* .066
Liaoning .0126 .738 .0082 .425
Shanghai .0176 .354 .0143 .574
Zhejiang .0097 .6472 .0086 .352
Shandong .0297** .048 .0132** .031 Hubei .0453** .028 .0371** .044 Guangdong .0536*** .002 .0453** .035 Chongqing .0231* .069 .0214* .072
_____________________________________________________________________________________________ Root Mean Square Error .1852 .1978
P-value for the F-test of the model .003 .007
_____________________________________________________________________________________________ Panel (1.b) Dependent Variable: Foreign Direct Investment or Portfolio Investment Foreign Direct Investment Portfolio Investment Productivity Hebei .0785** .042 .1032** .036 Liaoning .0587* .095 .0117 .486
Shanghai .1007** .028 .0397 .545
Zhejiang .0454* .068 .0075 .637
Shandong .1106** .036 .1298*** .001 Hubei .0978** .027 .0758** .046
Guangdong .1298*** .008 .1436** .029
Chongqing .0376* .075 .0895** .043
Per Capita Income Hebei .0678*** .003 .0968** .035
Liaoning .0469* .095 .0293 .254
Shanghai .0913** .028 .0259 .576
Zhejiang .0332* .068 .0464 .254
Shandong .1019** .036 .1379** .038
Hubei .0835** .027 .0937** .041
Guangdong .1078*** .008 .1818** .035
Chongqing .0254* .075 .0934** .027
_____________________________________________________________________________________________ Numbers of Observations 55 55
Root Mean Square Error .1154 .0189 The *, **, and *** denote 10%, 5%, and 1% significance levels, respectively.
and Zhejiang are generated. Hebei is used as the reference group. Coefficients for other regions are obtained by adding coefficient for each interaction term to coefficient for Hebei. An F test for the significant of each sum is then performed. The results for the bench mark variables are reported
Shanghai, Zhejiang, Liaoning, Hubei, Hebei, and Chongqing. For the effect of PI, the ranking is Guangdong, Hubei, Shandong, Chongqing, Hebei, Shanghai, Liaoning, and Zhejiang. Additionally, the coefficients of PI for Chongqing and Hebei are only weakly significant and those for the last three regions are not significantly different from zeros.
The reversed causality for each region is also investigated. The ranking for the effect of productivity or per capita on FDI is Guangdong, Shandong, Shanghai, Hubei, Hebei, Liaoning, Zhejiang, and Chongqing, but those for the last three regions are only weakly significant. The ranking for those effects on PI is Guangdong, Shandong, Hebei, Chongqing, Hubei, Shanghai, Liaoning, and Zhejiang. Moreover, the coefficients for the last three regions are not significantly different from zeros. The signs of the auxiliary and control variables are again as expected (the results for these additional variables are available upon requests). In brief, the results from both tables support our theoretical framework and the existing literature in Section two.
While the doubtful effect of full convertibility is evidence in all developing countries as shown in the literature section, this is especially so in China, which is one of the transition economies. Culturally, the transition from a planned economy to a market one is not painless. It has been widely discussed that Eastern European countries have gone through shocks that cause social unrest. Many people in Eastern Europe and the Commonwealth of Independent States (CIS) of the former Soviet Union miss the good old days when life was peaceful. The middle-age residents of these states also miss the less-selfish society, in which collective interests were valued higher than private ones. This could have become a poignant experience for former socialist states in Asia like China, where community spirits are very strong. Hence, utility gains from higher levels of production and consumption might be offset by losses of traditional values, even if these gain are materialized.
Politically, China is different from the Eastern European countries in its market socialist regime, which was invented by China in 1978. This polity is characterized by temporary market economy to boost management skills, increase level of technology, and accumulate capital. However, China maintains the government control with one-party rule and independent security policy apart from the Washington‟s influence. It appears that the market socialism might soon be followed
by North Korea and Cuba, who seem not willing to relinquish the communist leadership as well.
Economically, the market-socialist states retain a parallel existence of state and private suppliers, which produce to satisfy market-oriented demand, and a limited openness to the capitalist countries. Since capitalism is seen as less desirable system than its own system, maintaining capital controls allows the Chinese government to keep an eye on the capitalistic scenario of the large hedge funds deliberately create speculative attacks to gain profits for themselves at the expense of smaller investors and the poor host countries. Additionally, China has pursued favorable policies to attract large amount of FDI. Since FDI
is a form of capital inflows de facto, China already
has FDI for their growth and might not need
capital liberalization de jure in the near future
[17-21].
Conclusion
The benefit of capital liberalization has been a controversial topic since the Asian crisis of 1997-1998. Theoretically and empirically, the impact of capital liberalization on economic growth is not clear. An agreement among the papers is that a country needs strong banking and financial
institutions in addition to high-quality
governance to benefit from full capital convertibility. Since most papers do not distinguish between long-term flows, which do not
require full convertibility, and short-term flows,
which are supported by full convertibility or the
so-called capital liberalization de jure.
In sum, from the literature review and our analysis, a country needs high-quality governance and strong financial institutions to benefit from capital account convertibility. Since China has
low-quality governance and weak financial system, we conclude China migh want to phase out its full convertibility slowly, probably in ten or fifteen years, instead in the near future of four or five years.
References
1. Tanzi V (2000) Policies, Institutions and the Dark Side of Economics, Edward Elgar (Boston, MA). 2. Krugman P (1999) The Return of Depression
Economics. Norton & Company, New York, NY. 3. Henry PB (2003) Capital-Account Liberalization,
the Cost of Capital, and Economic Growth. American Economic Review, 93(2):91-96.
4. Chang R, Velasco A (2001) A Model of Financial Crisis in Emerging Market. The Quarterly Journal of Economics, 489-517.
5. Corsetti G, Pesenti P, Roubini N (1999) Paper Tigers? A Model of the Asian Crisis. European Economic Review, 43:1211-1236.
6. Lardy N, Douglas P (2011) Capital Account Liberalization and the Role of the Renminbi, Peterson Institute for International Economics, Working Paper Series, WP11-6.
7. Cooper RN (1998) Should Capital-Account Convertibility Be a World Objective? in Should the IMF Pursue Capital-Account Convertibility? Princeton University (Princeton, NJ)11-19.
8. Ingves S (2003) Sequencing capital account liberalization and financial sector stability. in Bakker A and B Chapple (edited), Capital Liberalization in Transition Countries, Edward Elgar (Boston, MA), 43-58.
9. Edison H, Klein M, Ricci L, Torsten S (2004) Capital Account Liberalization and Economic Performance: Survey and Synthesis. IMF Staff Papers,51(2):220-256.
10. Klein M (2005) Capital Account Liberalization, Institutional Quality, and Economic Growth: Theory and Evidence. Fletcher School, Tufts University, and NBER, 1-35.
11. Hsieh MF, Yaung YT, Vu TB (2008) Do Herding Behavior Influence Capital Inflows? Evidence from Asia and Latin America. International Journal of Business and Finance Research, 2(2):19-34.
12. Park YC, Song CY (2008) Managing capital account liberalization: Indonesia, Malaysia, Korea, and Thailand, in Bakker, A. (ed.) Capital Liberalization in Transition Countries, Edward Elgar (Boston, MA):59-84.
13. Aizenman J, Noy I (2006) Endogenous Financial and Trade Openness, Ilan Noy Web Site, 1-25. 14. Vu TB, Gangnes B, Noy I (2008) Is FDI Good for
growth? Analysis using sectoral data in China and Vietna‟, Journal of Asian Pacific Economies, 13(4):542-562.
15. Vu TB, Noy I (2009) Sectoral Analysis of Foreign Direct Investment and Growth in Developed Countries, International Financial Markets, Institutions & Money,19:402-413.
16. Romer D, (2006) Advanced Macroeconomics, Mac Graw-Hill,Boston, 100-103.
17. Index Mondi (2014) Complete Country Profiles http://www.indexmundi.com.
18. National Bureau of Statistics of China website (2014).http://www.stats.gov.cn/english/statisticaldat a/yearlydata/
19. United State Department of Agriculture (2014) International Macroeconomic Data Set, http://www.ers.usda.gov/Data/Macroeconomics/ 20. WGI website (2014) The Worldwide Governance
Indicators, 2013 Update, www.govindicators.org 21. World Bank website (2014) World Development