Infant BMI or Weight-for-Length and
Obesity Risk in Early Childhood
Sani M. Roy, MD, a Jordan G. Spivack, MD, PhD, b Myles S. Faith, PhD, c Alessandra Chesi, PhD, d Jonathan A. Mitchell, PhD, e Andrea Kelly, MD, a, b Struan F. A. Grant, PhD, a, b, d Shana E. McCormack, MD, a, b Babette S. Zemel, PhDe
abstract
BACKGROUND: Weight-for-length (WFL) is currently used to assess adiposity under 2 years. Weassessed WFL- versus BMI-based estimates of adiposity in healthy infants in determining risk for early obesity.
METHODS: Anthropometrics were extracted from electronic medical records for well-child visits for 73 949 full-term infants from a large pediatric network. World Health Organization WFL and BMI z scores (WFL-z and BMI-z, respectively) were calculated up to age 24 months. Correlation analyses assessed the agreement between WFL-z and BMI-z and within-subject tracking over time. Logistic regression determined odds of obesity at 2 years on the basis of adiposity classification at 2 months.
RESULTS: Agreement between WFL-z and BMI-z increased from birth to 6 months and remained high thereafter. BMI-z at 2 months was more consistent with measurements at older ages than WFL-z at 2 months. Infants with high BMI (≥85th percentile) and reference WFL (5th–85th percentiles) at 2 months had greater odds of obesity at 2 years than those with high WFL (≥85th percentile) and reference BMI (5th–85th percentiles; odds ratio, 5.49 vs 1.40; P < .001). At 2 months, BMI had a higher positive predictive value than WFL for obesity at 2 years using cut-points of either the 85th percentile (31% vs 23%) or 97.7th percentile (47% vs 29%).
CONCLUSIONS: High BMI in early infancy is more strongly associated with early childhood obesity than high WFL. Forty-seven percent of infants with BMI ≥97.7th percentile at 2 months (versus 29% of infants with WFL ≥97.7th percentile at 2 months) were obese at 2 years. Epidemiologic studies focused on assessing childhood obesity risk should consider using BMI in early infancy.
Divisions of aEndocrinology and Diabetes, dHuman Genetics, and eGastroenterology, Hepatology, and Nutrition,
The Children’s Hospital of Philadelphia, Philadelphia, Pennsylvania; bDepartment of Pediatrics, Perelman School
of Medicine, University of Pennsylvania, Philadelphia, Pennsylvania; and cGillings School of Global Public Health,
University of North Carolina, Chapel Hill, North Carolina
Drs Roy, McCormack, and Zemel conceptualized and designed the study, performed the analyses, and drafted the initial manuscript; Drs Spivack, Faith, Chesi, Mitchell, Kelly, and Grant critically reviewed and revised the analysis plan and manuscript; and all authors approved the fi nal manuscript as submitted.
DOI: 10.1542/peds.2015-3492 Accepted for publication Feb 1, 2016
Address correspondence to Babette S. Zemel, PhD, Division of Gastroenterology, Hepatology, and Nutrition, The Children’s Hospital of Philadelphia, 3535 Market St, Room 1560, Philadelphia, PA 19104. E-mail: [email protected]
PEDIATRICS (ISSN Numbers: Print, 0031-4005; Online, 1098-4275). Copyright © 2016 by the American Academy of Pediatrics
NIH
To cite: Roy SM, Spivack JG, Faith MS, et al. Infant BMI
or Weight-for-Length and Obesity Risk in Early Childhood. Pediatrics. 2016;137(5):e20153492
WHAT’S KNOWN ON THIS SUBJECT: The American Academy of Pediatrics recommends that weight-for-length (WFL) be used for children under age 2 years to identify those at risk for obesity. Studies have suggested that BMI may be an accurate index of adiposity in infancy and may better predict obesity risk.
Over one-third of US adults are obese.1 Prevention of adult obesity requires identifying at-risk individuals at a time in life when interventions may be most effective, even as early as infancy.2–5
A major challenge in identifying infants at highest risk for obesity is that there is currently no accepted definition for excess adiposity in infants under age 2 years.6 BMI is used to assess obesity in children and adults, 6 and the World Health Organization (WHO) has published BMI standards for infants.7 However, weight-for-length (WFL), rather than BMI, is the current anthropometric standard used to assess nutritional status in the first 2 years of life in the United States, as recommended by the American Academy of Pediatrics (AAP).8 WFL is also the predominant standard used worldwide.9 The relationship between weight and length varies as a function of age during infancy, and the WFL percentile curves do not reflect this age-dependent variation in infant growth.10 Recent studies have suggested that BMI may be a useful index of adiposity in infancy that also provides information about future obesity risk.11–17 To our knowledge, no studies have evaluated the relative performance of BMI versus WFL with respect to estimating future obesity risk in full-term infants. It is unknown whether these metrics agree with each other in identifying risk for excess adiposity in infancy. Thus, the aims of the current study were the following: (1) to determine the consistency between BMI- versus WFL-based estimates of adiposity in healthy infants and (2) to assess how BMI and WFL, measured during infancy, relate to early childhood obesity.
METHODS
Study Sample
The sample included healthy, full-term infants with at least 1
simultaneous length and weight measurement between ages 0 and 26 months enrolled in the Pediatric Care Network Study while receiving clinical care at The Children’s Hospital of Philadelphia (CHOP). The Pediatric Care Network Study investigated the prevalence of obesity and included children who had at least 1 well-child check between January 1, 2006, and December 31, 2011. Data were excluded from any clinic sites at which the recumbent length board was not used for measuring infant lengths. The institutional review board at CHOP reviewed the protocol and determined it was exempt given that only completely deidentified records were used.
Electronic Medical Record Measurements and Clinical Characteristics
Simultaneous height and weight measurements were extracted from visits corresponding to ages at which prescribed well-child checks occur: 0, 1, 2, 4, 6, 9, 12, 15, 18, and 24 months; and both cross-sectional and longitudinal data were investigated. The closest measurements were included ±2 weeks for ages 0 to 2 months, ±4 weeks for ages 4 to 15 months, ±6 weeks for age 18 months, and ±8 weeks for age 24 months. All height and weight z scores were within WHO parameters for plausible data (within 6 SDs for height z, and both greater than −6 SDs and less than +5 SDs for weight z).18 WHO WFL and BMI z scores (WFL-z and BMI-z, respectively) were calculated at each age according to published standards.19
Additionally, all available
sociodemographic characteristics were extracted from the electronic medical record for each child: gender, race, ethnicity, and Medicaid status at each visit (receiving or not receiving assistance for payment of medical bills in individuals below a certain income threshold). As
non-Hispanic black (NH black) persons have the highest age-adjusted rate of adult obesity, 20 and given our large proportion of NH black participants, we classified ancestry as NH black versus nonblack (all others). Birth weight information was not consistently available for all participants, so WHO weight z score closest to 14 ± 7 days of life was used as a proxy for birth weight, because infants usually regain their birth weight by ~2 weeks of age.21
Statistical Analyses
Prevalence and Persistence of Agreement and Discordance Between BMI-z and WFL-z
Prevalence of discordance between WFL-z and BMI-z measurements at each age was investigated. All measurements classified as underweight by any metric (<5th percentile for either BMI-z or WFL-z) were excluded from subsequent analyses, because the primary purpose of this study was to investigate discordance in metrics related to future obesity risk. Measurements were classified into 1 of 4 adiposity classification groups on the basis of measurements at age 2 months for further analyses: group 1 (reference range for both WFL and BMI, [WFLref_BMIref], both WFL and BMI 5th–85th percentiles); group 2 (high WFL and reference range BMI, [WFLhigh_BMIref], WFL
curves and as WHO BMI-for-age charts display the 85th percentile.7
Pearson correlation analyses were used to assess agreement between WFL-z and BMI-z at different ages. A measure that yields consistent results over time is more clinically useful; thus, the within-subject Pearson correlations of both WFL-z and BMI-z were investigated at various time intervals (2 and 6 months, 2 and 12 months, 2 and 18 months, and 2 and 24 months). Fisher r to z transformation was used to compare BMI-z tracking correlations with WFL-z tracking correlations at the corresponding time interval.23 Age 2 months was chosen as the reference age range for this analysis along with subsequent analyses because of the relatively higher proportion of discordance between WFL and BMI at this age and to avoid the highly variable weight measurements during the neonatal period.
Factors Associated With Discordance in Adiposity Classifi cation on the Basis of Adiposity Classifi cation at Age 2 Months
Bivariate analyses (χ2 analyses and 2-sided t tests) assessed differences in gender, ancestry, Medicaid status, and weight z at 14 ± 7 days (birth weight proxy) between discordant groups (group 2 [WFLhigh_BMIref] vs group 3 [WFLref_BMIhigh]) and between each discordant group compared with the group with measurements in the reference range of WFL and BMI (group 2 [WFLhigh_BMIref] vs group 1 [WFLref_ BMIref] and group 3 [WFLref_BMIhigh] vs group 1 [WFLref_BMIref]). Then logistic regression analysis assessed the odds of group 2 discordance (vs group 1), group 3 discordance (vs group 1), and group 3 discordance (vs group 2 discordance),
first assessing the effects of sociodemographic factors followed
by the additional effect of weight z at 14 days (birth weight proxy).
Growth Pattern in the First 2 Years on the Basis of Adiposity Classifi cation at Age 2 Months
Growth patterns through the first 2 years of life were plotted by using mean raw values of BMI along with the components used in the calculation of BMI: weight and length. This was done to more clearly appreciate the impact of both weight and length on the net BMI trajectory, according to adiposity classification. Generalized estimating equation regression analyses assessed differences in BMI, length, and weight at all visit ages by infant adiposity classification group; age-by-adiposity classification group interactions assessed how measurements between adiposity groups differed at each age. Posthoc linear combinations of estimators were calculated to better understand the effect of adiposity classification group on these metrics. Analyses were performed separately by gender given the distinct growth trajectories of male and female infants.11
Adiposity Classifi cation at Age 2 Months and Risk of Obesity at Age 2 Years
Logistic regression was used to investigate how adiposity classification at 2 months impacted odds of obesity at age 2 years, first accounting for sociodemographic characteristics and then assessing the effect of adiposity classification group before and after the addition of weight z score at 14 ± 7 days (birth weight proxy). Postestimation likelihood ratios were performed to test differences between adiposity classification groups. Finally, the positive and negative predictive values of WFL or BMI cutoffs of the 85th percentile and 97.7th percentile at age 2 months on obesity status at age 2 years were calculated. The 85th percentile was chosen as an extrapolation of overweight status from the CDC curves22 because there
is no clearly established percentile classification of overweight status using the WHO curves and as WHO BMI-for-age charts display the 85th percentile.7 The 97.7th percentile was chosen because it is considered the upper bound (+2 SDs) of the normal range for the WHO growth charts.18
RESULTS
Sample Characteristics
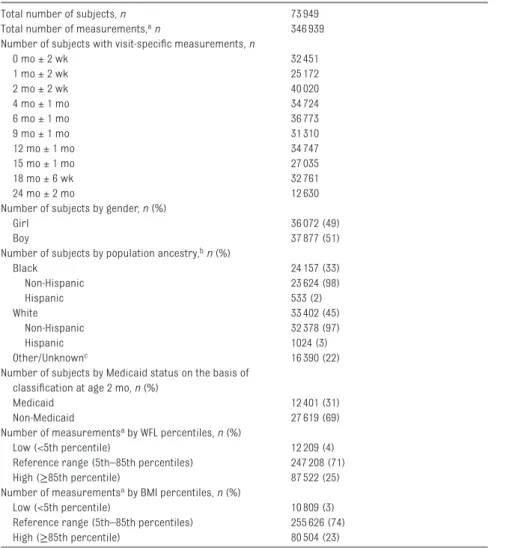
The sample consisted of 73 949 participants with a total of 346 939 simultaneous weight and length measurements between the ages of 0 to 2 years (Table 1). The sample was 49% girls, with 33% black and 45% white participants; 5% of all ancestries were of Hispanic ethnicity, and 32% of the sample was NH black. Thirty-one percent were receiving Medicaid at age 2 months. 12 630 participants (17%) had anthropometric data available at 2 years of age. Analysis of participants with and without anthropometric data at age 2 years revealed no differences in gender (P = .509), but there were more NH black participants and more participants receiving Medicaid on the basis of their classification at age 2 months (P < .001) than expected in the group with 2-year data available. Two-year analyses were restricted to those with complete data.
More measurements were ≥85th percentile by WFL than by BMI (25% vs 23%, P < .001). As shown in Fig 1, percentage of discordance ranged from 14% to 18% between ages 0 and 2 months to 3% to 6% at visits from ages 4 to 24 months. The number of measurements by category at each visit age is shown in Supplemental Table 7.
Correlation Between WFL and BMI z Scores in Infancy
up to a correlation of r = 0.998 (P < .001) at age 6 months, after which correlations remained high at r = 0.98–0.99 from ages 6 to 24 months (P < .001).
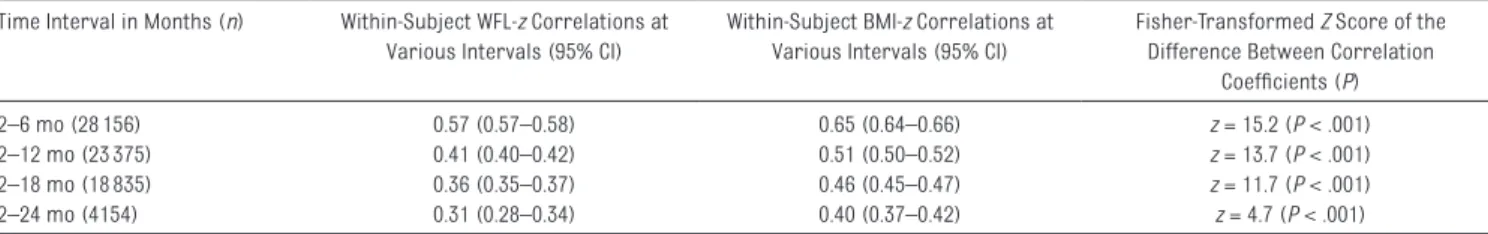
Within-subject correlations (Table 3) evaluated the consistency of each child’s WFL and BMI z scores as she or he got older at various intervals starting from age 2 months. Within-subject correlations were significantly greater for BMI than for WFL at every interval between 2 and 24 months of age, with the greatest difference noted between ages 2 and 6 months (z = 15.2, P < .001, n = 28 156).
TABLE 1 General Sample Characteristics
Total number of subjects, n 73 949
Total number of measurements, a n 346 939
Number of subjects with visit-specifi c measurements, n
0 mo ± 2 wk 32 451
1 mo ± 2 wk 25 172
2 mo ± 2 wk 40 020
4 mo ± 1 mo 34 724
6 mo ± 1 mo 36 773
9 mo ± 1 mo 31 310
12 mo ± 1 mo 34 747
15 mo ± 1 mo 27 035
18 mo ± 6 wk 32 761
24 mo ± 2 mo 12 630
Number of subjects by gender, n (%)
Girl 36 072 (49)
Boy 37 877 (51)
Number of subjects by population ancestry, b n (%)
Black 24 157 (33)
Non-Hispanic 23 624 (98)
Hispanic 533 (2)
White 33 402 (45)
Non-Hispanic 32 378 (97)
Hispanic 1024 (3)
Other/Unknownc 16 390 (22)
Number of subjects by Medicaid status on the basis of classifi cation at age 2 mo, n (%)
Medicaid 12 401 (31)
Non-Medicaid 27 619 (69)
Number of measurementsa by WFL percentiles, n (%)
Low (<5th percentile) 12 209 (4)
Reference range (5th–85th percentiles) 247 208 (71)
High (≥85th percentile) 87 522 (25)
Number of measurementsa by BMI percentiles, n (%)
Low (<5th percentile) 10 809 (3)
Reference range (5th–85th percentiles) 255 626 (74)
High (≥85th percentile) 80 504 (23)
General sample characteristics are shown.
a Multiple observations may be present per subject. See Supplemental Table 7 for number of measurements by WFL and
BMI percentiles at individual visit ages.
b Five percent of all ancestries were Hispanic.
c Nineteen percent had unknown population ancestry, and the remainder were Pacifi c Islander, Asian, or American Indian.
FIGURE 1
Bar graph indicates the proportion of discordant measurements between WFL and BMI at each visit age, with 95% CI indicated by
error bars. TABLE 2
Correlations Between WFL-z and BMI-z by Age
0 mo
1 mo
2 mo
4 mo
6 mo
9 mo
12 mo
15 mo
18 mo
24 mo
Correlation (
n
)
0.88 (32
451)
0.86 (25
172)
0.92 (40
020)
0.99 (34
724)
1.00 (36
773)
0.99 (31
310)
0.98 (34
747)
0.98 (27
035)
0.99 (32
761)
0.99 (12
630)
Correlations between weight-for
-length
z
score and BMI
z
score by age are listed as Pearson correlation coeffi
cient (
n
). All correlations presented are statistically signifi
cant with
P
Bivariate Analyses of Factors Associated With Discordance Between WFL and BMI in Infancy on the Basis of Adiposity Classifi cation at Age 2 Months
Group 2 discordance (WFLhigh_BMIref) versus group 1 (WFLref_BMIref) was seen more frequently in boys, NH black participants, those on Medicaid, and individuals with lower weight z at 14 days (P < .001). Group 3 discordance (WFLref_BMIhigh) versus group 1 (WFLref_BMIref) was marginally more frequent in nonblack participants (P = .072) and significantly more frequent in those with higher weight z at 14 days (P < .001), but there was no difference on the basis of gender or Medicaid status. Those with group 3 (WFLref_BMIhigh) versus group 2 (WFLhigh_BMIref) classification had higher weight z at 14 days (P < .001) and were more likely girls (P = .021), nonblack (P < .001), and not on Medicaid (P < .001).
Multivariable Analyses of Factors Associated With Discordance Between WFL and BMI in Infancy on the Basis of Adiposity Classifi cation at Age 2 Months
Consistent with bivariate results, by logistic regression, female gender, nonblack ancestry, and non-Medicaid status were each significantly and independently associated with higher odds of being classified as group 3 (WFLref_BMIhigh) compared with group 2 discordance (WFLhigh_BMIref; P < .05 for all; Table 4, Model 1). The odds of group 3 adiposity (WFLref_ BMIhigh) was increased by 16.5 (95% confidence interval [CI]: 11.4–23.7, P < .001; Table 4, Model 2) for every
SD increase in the proxy birth weight measurement (weight z score at 14 ± 7 days). Logistic regression analysis of the odds of being classified as a discordant group (group 2 or group 3) versus the reference group (group 1) also revealed directionally consistent results to those found by bivariate analysis (Supplemental Tables 8 and 9). Sensitivity analyses restricting data only to subjects with complete data are shown in Supplemental Tables 10, 11, and 12 and showed consistent directionality.
Growth Patterns of BMI, Length, and Weight on the Basis of WFL and BMI in Early Infancy
BMI and WFL classification were most discordant at age 2 months. To examine the long-term implications of discordance at age 2 months, we examined growth patterns of BMI for each of the groups (Fig 2A). Both male and female infants in group 3 (WFLref_BMIhigh) at age 2 months had a persistently higher BMI from 0 to 24 months of age compared with those in the reference ranges for both WFL and BMI (WFLref_BMIref; P < .001). There was no significant
difference in BMI between group 3 (WFLref_BMIhigh) and group 4 (WFLhigh_BMIhigh) for the majority of visits (except age 2 months in girls and ages 2 to 6 months in boys, P < .01 for all).
Mean weight and length were also plotted for each group on the basis of their classification at age 2 months. As shown in Fig 2 B and C, for both male and female infants, group 3 (WFLref_BMIhigh) had the highest weight and length throughout (P < .001 for all visit ages), whereas those in group 2 (WFLhigh_BMIref) had a lower weight (P < .05 for all visit ages) and shorter length throughout (P < .001 for all visit ages).
The odds of obesity at age 2 years on the basis of sociodemographic characteristics and adiposity classification at age 2 months was then assessed (Table 5). Medicaid status at age 2 months was found to be significantly associated with obesity at age 2 years (Table 5, Model 1). Infants in group 3 (WFLref_BMIhigh) at age 2 months had a higher likelihood for obesity at age 2 years than infants TABLE 3 Within-subject WFL-z or BMI-z Correlations at Various Intervals from Age 2 Months
Time Interval in Months (n) Within-Subject WFL-z Correlations at Various Intervals (95% CI)
Within-Subject BMI-z Correlations at Various Intervals (95% CI)
Fisher-Transformed Z Score of the Difference Between Correlation
Coeffi cients (P)
2–6 mo (28 156) 0.57 (0.57–0.58) 0.65 (0.64–0.66) z = 15.2 (P < .001)
2–12 mo (23 375) 0.41 (0.40–0.42) 0.51 (0.50–0.52) z = 13.7 (P < .001)
2–18 mo (18 835) 0.36 (0.35–0.37) 0.46 (0.45–0.47) z = 11.7 (P < .001)
2–24 mo (4154) 0.31 (0.28–0.34) 0.40 (0.37–0.42) z = 4.7 (P < .001)
The within-subject stability of WFL and BMI z scores at various intervals from 2 mo to 2 y is shown in each box as Pearson correlation coeffi cient (95% CI). For example, the within-subject correlation between WFL-z at 2 and 6 mo is 0.57. Signifi cance of P < .001 is present for all coeffi cients.
TABLE 4 Odds of Group 3 (WFLref_BMIhigh) versus Group 2 (WFLhigh_BMIref) Discordance at Age 2 Months
Model 1, n = 4435 Model 2, n = 1709
Gender: Boy (vs girl) 0.79* (0.65–0.95) 0.84 (0.55–1.29)
Ancestry: NH Black (vs nonblack) 0.60*** (0.47–0.77) 0.65 (0.39–1.09) Medicaid at 2 mo: (vs non-Medicaid at 2 mo) 0.64*** (0.51–0.81) 0.94 (0.57–1.53) Weight z score at 14 ± 7 d as birth weight proxy
(continuous)
— 16.5*** (11.4–23.7)
Odds of group 3 (WFLref_BMIhigh) versus group 2 discordance (WFLhigh_BMIref) at age 2 mo on the basis of sociodemographic
factors and weight z score at 14 ± 7 d was assessed by using logistic regression and is shown as OR (95% CI). Covariates were sequentially added to models in order to assess their relative contributions; a blank dash is inserted where covariates are not included in the model.
in group 2 (WFLhigh_BMIref; odds ratio [OR] 5.49 vs OR 1.40, P < .001) but similar odds for obesity at age 2 years compared with infants in group 4 (WFLhigh_BMIhigh; OR 5.49 vs OR 4.07, P = .34; Table 5, Model 2). With
addition of weight z score at 14 days into the model, this pattern on the basis of adiposity classification at age 2 months persisted although the differences in OR between group 2 vs group 3 and between group 3 vs.
group 4 were both attenuated (P = not significant for both; Table 5, Model 3). Sensitivity analyses restricting data only to subjects with complete data revealed overall consistent results (Supplemental Table 13).
FIGURE 2
Positive and Negative Predictive Values of WFL and BMI at 2 Months With Obesity at 2 Years
The positive predictive values (PPVs) and negative predictive values (NPVs) of WFL and BMI cutoffs of 85th percentile at age 2 months with obesity at age 2 years were calculated (Table 6, Columns 1–2) and revealed that BMI
≥85th percentile at age 2 months had a higher PPV (31%; 95% CI: 27%–34%) than WFL ≥85th percentile at age 2 months (23%; 95% CI: 21%–26%) for obesity at age 2 years. However, the NPV for both WFL and BMI at the 85th percentile cutoff at age 2 months were the same at 90%.
The PPV and NPV of both WFL and BMI cutoffs of 97.7th percentile at age 2 months with obesity at age 2 years were also calculated (Table 6, Columns 3–4); BMI ≥97.7th percentile at age 2 months had a higher PPV (47%; 95% CI: 37%– 57%) than WFL ≥97.7th percentile at age 2 months (29%; 95% CI: 23%–36%) for obesity at age 2 years. Again, the NPV for both BMI and WFL at cutoffs of 97.7th percentile were the same at age 2 months (88%).
DISCUSSION
The recent recommendation of the AAP’s Committee on Nutrition is to use WHO WFL charts for children less than 24 months of age to identify those at risk for developing obesity.8 To our knowledge, ours is the first report to compare WHO WFL and BMI in a large, diverse, urban, longitudinal cohort of full-term infants at high risk for childhood obesity to determine whether they differ in identifying children at risk for early childhood obesity.24 We illustrate that in early
infancy, BMI has a significantly higher PPV for later obesity risk than does WFL. The relatively high proportion of discordance between WFL and BMI in the first few months of life and the disparate risks of later obesity on the basis of adiposity classification group at age 2 months indicates that (1) future obesity risk may manifest as early as 2 months of age and that (2) BMI may be a better indicator of future obesity risk than WFL in early infancy, particularly when discordance exists between the 2 metrics. After age 6 months, however, concordance between WFL and BMI is consistently high, indicating that either may be a reasonable anthropometric measure in later infancy with regard to assessing early childhood obesity risk. Notably, consistency between within-subject BMI measurements over time is significantly higher than that of within-subject WFL measurements over time, providing further support for the stability of BMI with time compared with WFL.
Examination of length and weight trajectories provides insight into the superior performance of BMI at age 2 months as an indicator of later obesity. We show that young infants with high WFL (≥85th percentile) and BMI in the reference range (5th–85th percentile) tend to be short for their age. Because WFL charts do not take age into account, an infant with shorter length-for-age will be compared with children of younger ages who are likely to have lower weights, and thus classified as having a relatively high WFL. Adiposity increases rapidly in infancy reaching a peak around age 6 months.25 Thus, evaluation of WFL relationships optimally accounts for age-specific patterns of gain in both weight and length. The advantage of BMI-based standards is that they account for the distributions of weight and length at a given age.
The methods by which the WHO growth standards were constructed may provide further insight into the observed differences between BMI TABLE 5 Odds of Obesity at Age 2y
Model 1, n = 4154 Model 2, n = 3867 Model 3, n = 1654 Gender: Boy (vs girl) 1.17 (0.97–1.40) 1.10 (0.91–1.33) 0.93 (0.69–1.25) Ancestry: NH black (vs nonblack) 0.89 (0.72–1.12) 0.87 (0.69–1.09) 0.94 (0.66–1.35) Medicaid at 2 mo (vs non-Medicaid at 2
mo)
1.43* (1.15–1.77) 1.38* (1.10–1.74) 1.59* (1.12–2.26) Adiposity group at 2 mo (vs group 1:
WFLref_BMIref)
Group 2: WFLhigh_BMIref — 1.40* (1.01–1.93) 1.18 (0.69–2.00) Group 3: WFLref_BMIhigh — 5.49** (3.03–9.93) 3.16***(1.06–9.43) Group 4: WFLhigh_BMIhigh — 4.07** (3.27–5.07) 3.39** (2.41–4.76) Weight z score at 14 ± 7 d as birth weight
proxy (continuous)
— — 1.27*** (1.06–1.52)
Odds of obesity (CDC BMI-z≥1.64) at age 2 y on the basis of sociodemographic factors, adiposity classifi cation group, and weight z score at 14 ± 7 d (birth weight proxy) was assessed by using logistic regression and is shown as OR (95% CI). Covariates were sequentially added to models in order to assess their relative contributions; a blank dash is inserted where covariates are not included in the model.
*P < .05. **P < .01. ***P < .001.
TABLE 6 PPV and NPV of WFL and BMI at Age 2m with Obesity at Age 2y PPV of WFL/BMI at 85th
Percentile (95% CI)
NPV of WFL/BMI at 85th Percentile (95% CI)
PPV of WFL/BMI at 97.7th Percentile (95% CI)
NPV of WFL/BMI at 97.7th Percentile (95% CI)
WFL at 2 mo 23.1% (20.5%–25.9%) 90.2% (89.1%–91.2%) 29.1% (23.3%–35.5%) 88.0% (86.9%–89.0%)
BMI at 2 mo 30.6% (27.0%–34.3%) 90.2% (89.2%–91.1%) 46.7% (36.9%–56.7%) 87.9% (86.9%–88.9%)
and WFL; outliers (> or <2–3 SDs) for WFL measurements, but not BMI measurements, were removed from this international reference sample, 18 thus, introducing a potential
ascertainment bias into the growth standards.
Notably, our study was consistent with other studies that demonstrate the effects of birth weight and socioeconomic status on later obesity risk, 26, 27 because we also found that a higher weight z score at 14 ± 7 days (proxy birth weight measurement) along with Medicaid status at age 2 months were each associated with a higher odds of obesity at age 2 years.
A great strength of our study was the inclusion of over 70 000 children and a large number of measurements from which to estimate rates of WFL and BMI. However, our study had a few inherent limitations. There were more non-Hispanic black participants than expected in the group with 2-year anthropometric data available. This may relate to the timing of implementation of electronic medical health records at various CHOP locations with different sociodemographic profiles. Consistent follow-up information on participants in this data set was only available through the first 2 years of life; thus, assessment of long-term obesity risk was limited. However, many recent studies have provided evidence that anthropometric parameters as early as 6 to 9 months of age
are associated with childhood and even late adolescent obesity risk.12, 15, 28, 29 Future prospective studies
should investigate how infancy BMI performs in estimating obesity risk later in life when combined with other factors, in particular parental characteristics, feeding patterns, or body composition data, which were not available in the current study.
Both WFL and BMI have high NPVs in early infancy, suggesting a low risk for early childhood obesity if infancy WFL or BMI is <85th percentile. It is remarkable that 31% of individuals with BMI ≥ the 85th percentile (vs 23% by WFL) and 47% with BMI
≥ the 97.7th percentile (vs 29% by WFL) at age 2 months will be obese at age 2 years. Indeed, it has been suggested that BMI in early infancy represents a potentially helpful metric for epidemiologic research.30 As BMI is the anthropometric measure routinely assessed from age 2 years into adulthood, 8 we recommend that clinicians consider introducing parents to the WHO BMI growth chart, in addition to the currently recommended WFL growth chart, even in early infancy. A high BMI, even with WFL in the reference range, may indicate a higher risk for later obesity, providing an opportunity for preventative counseling in early infancy. Our findings in a large cohort of healthy, full-term children provide further support for the utility of infancy BMI in longitudinal studies of childhood obesity.
ACKNOWLEDGMENTS
We thank Drs Marianne Chilutti and Huaxing Zhao for their assistance with data extraction.
REFERENCES
1. Flegal KM, Carroll MD, Kit BK, Ogden CL. Prevalence of obesity and trends in the distribution of body mass index among US adults, 1999-2010. JAMA. 2012;307(5):491–497
2. Ekelund U, Ong KK, Linné Y, et al. Association of weight gain in infancy and early childhood with metabolic risk in young adults. J Clin Endocrinol
Metab. 2007;92(1):98–103
3. Stettler N, Kumanyika SK, Katz SH, Zemel BS, Stallings VA. Rapid weight gain during infancy and obesity in young adulthood in a cohort of African Americans. ABBREVIATIONS
AAP: American Academy of Pediatrics
BMI-z: BMI z score
CDC: Centers for Disease Control and Prevention
CHOP: Children’s Hospital of Philadelphia
CI: confidence interval NH black: non-Hispanic black NPV: negative predictive value OR: odds ratio
PPV: positive predictive value WFL: weight-for-length
WFL-z: weight-for-length z score WFLref_BMIref: group 1 adiposity
classification (reference range WFL and BMI) WFLhigh_BMIref: group 2 adiposity
classification (high WFL and reference range BMI)
WFLref_BMIhigh: group 3 adiposity classification (reference range WFL and high BMI)
WFLhigh_BMIhigh: group 4 adiposity classification (high WFL and BMI)
WHO: World Health Organization
FINANCIAL DISCLOSURES: The authors have indicated they have no fi nancial relationships relevant to this article to disclose.
FUNDING: This work was supported by: NIDDK 2T32DK063688-11A1 (SMR); the Endocrine Society's Endocrine Scholars Award in Growth Hormone Research (SMR);
the Children's Hospital of Philadelphia Research Institute (JGS); NICHD R01 HD056465 (AC, SFAG); NHLBI K01HL123612 (JAM); NIDDK 5K12DK094723-02 (SEM); and 1K23DK102659-01 (SEM). Funded by the National Institutes of Health (NIH).
Am J Clin Nutr. 2003;77(6): 1374–1378
4. McCormack S, Xia Q, Grant SF. Developmental origins of genotype-phenotype correlations in chronic diseases of old age. Aging Dis. 2012;3(5):385–403
5. McCormick DP, Sarpong K, Jordan L, Ray LA, Jain S. Infant obesity: are we ready to make this diagnosis? J
Pediatr. 2010;157(1):15–19
6. Ogden CL, Carroll MD, Kit BK, Flegal KM. Prevalence of childhood and adult obesity in the United States, 2011-2012. JAMA. 2014;311(8):806–814
7. World Health Organization. Child Growth Standards. Available at: www. who. int/ childgrowth/ software/ en/ . Accessed September 28, 2014
8. Daniels SR, Hassink SG; Committee on Nutrition. The role of the pediatrician in primary prevention of obesity. Pediatrics. 2015;136(1). Available at: www. pediatrics. org/ cgi/ content/ full/ 136/ 1/ e275
9. de Onis M, Onyango A, Borghi E, Siyam A, Blössner M, Lutter C; WHO Multicentre Growth Reference Study Group. Worldwide implementation of the WHO Child Growth Standards. Public Health Nutr. 2012;15(9):1603–1610
10. Taveras EM, Rifas-Shiman SL, Sherry B, et al. Crossing growth percentiles in infancy and risk of obesity in childhood. Arch Pediatr Adolesc Med. 2011;165(11):993–998
11. Roy SM, Chesi A, Mentch F, et al. Body mass index (BMI) trajectories in infancy differ by population ancestry and may presage disparities in early childhood obesity. J Clin Endocrinol
Metab. 2015;100(4):1551–1560
12. Wen X, Kleinman K, Gillman MW, Rifas-Shiman SL, Taveras EM. Childhood body mass index trajectories: modeling, characterizing, pairwise correlations and socio-demographic predictors of
trajectory characteristics. BMC Med
Res Methodol. 2012;12:38
13. Sovio U, Kaakinen M, Tzoulaki I, Das S, Ruokonen A, Pouta A, et al How do changes in body mass index in infancy and childhood associate with cardiometabolic profi le in adulthood? Findings from the Northern Finland Birth Cohort 1966 Study. Int J Obes
(Lond). 2014;38(1):53–59
14. Johnson W, Choh AC, Lee M, Towne B, Czerwinski SA, Demerath EW. Characterization of the infant BMI peak: sex differences, birth year cohort effects, association
with concurrent adiposity, and heritability. Am J Hum Biol. 2013;25(3):378–388
15. Slining MM, Herring AH, Popkin BM, Mayer-Davis EJ, Adair LS. Infant BMI trajectories are associated with young adult body composition.
J Dev Orig Health Dis. 2013;4(1):
56–68
16. Silverwood RJ, De Stavola BL, Cole TJ, Leon DA. BMI peak in infancy as a predictor for later BMI in the Uppsala Family Study. Int J Obes (Lond). 2009;33(8):929–937
17. Olsen IE, Lawson ML, Ferguson AN, et al. BMI curves for preterm infants.
Pediatrics. 2015;135(3). Available at:
www. pediatrics. org/ cgi/ content/ full/ 135/ 3/ e572
18. WHO Multicentre Growth Reference Study Group. WHO Child Growth Standards based on length/height, weight and age. Acta Paediatr Suppl. 2006;450:76–85
19. World Health Organization. WHO Global Database on Child Growth and Malnutrition. Available at: http:// whqlibdoc. who. int/ hq/ 1997/ WHO_ NUT_ 97. 4. pdf. Accessed October 28, 2014
20. Flegal KM, Carroll MD, Ogden CL, Curtin LR. Prevalence and trends in obesity among US adults, 1999-2008. JAMA. 2010;303(3):235–241
21. Crossland DS, Richmond S, Hudson M, Smith K, Abu-Harb M. Weight change in the term baby in the fi rst 2 weeks of life. Acta Paediatr. 2008;97(4):425–429
22. Kuczmarski RJ, Ogden CL, Guo SS, et al. 2000 CDC Growth Charts for the United States: methods and development.
Vital Health Stat 11. 2002; (246):1–190
23. Soper D. Statistics calculators. Available at: http:// danielsoper. com/ statcalc3/ calc. aspx? id= 104. Accessed December 10, 2015
24. Robbins JM, Mallya G, Polansky M, Schwarz DF. Prevalence, disparities, and trends in obesity and severe obesity among students in the Philadelphia, Pennsylvania, school district, 2006-2010.
Prev Chronic Dis. 2012;9:E145
25. Butte NF, Hopkinson JM, Wong WW, Smith EO, Ellis KJ. Body composition during the fi rst 2 years of life: an updated reference. Pediatr Res. 2000;47(5):578–585
26. Yu ZB, Han SP, Zhu GZ, et al Birth weight and subsequent risk of obesity: a systematic review and meta-analysis.
Obes Rev. 2011;12(7):525–542
27. Gibbs BG, Forste R. Socioeconomic status, infant feeding practices and early childhood obesity. Pediatr Obes. 2014;9(2):135–146
28. Taveras EM, Rifas-Shiman SL, Belfort MB, Kleinman KP, Oken E, Gillman MW. Weight status in the fi rst 6 months of life and obesity at 3 years of age.
Pediatrics. 2009;123(4):1177–1183
29. Moss BG, Yeaton WH. Young children’s weight trajectories and associated risk factors: results from the Early Childhood Longitudinal Study-Birth Cohort. Am J Health Promot. 2011;25(3):190–198