Expansion of Inefficient HIV-Specific CD8 T Cells during Acute
Infection
Michael A. Eller,a,bNilu Goonetilleke,cBoonrat Tassaneetrithep,dLeigh Anne Eller,a,bMargaret C. Costanzo,a,bSusan Johnson,a,b Michael R. Betts,eShelly J. Krebs,a,bBonnie M. Slike,a,bSorachai Nitayaphan,fKathleen Rono,gSodsai Tovanabutra,a,b
Lucas Maganga,hHannah Kibuuka,iLinda Jagodzinski,aSheila Peel,aMorgane Rolland,a,bMary A. Marovich,a*Jerome H. Kim,a,k Nelson L. Michael,aMerlin L. Robb,a,bHendrik Streecka,b,j
U.S. Military HIV Research Program, Walter Reed Army Institute of Research, Silver Spring, Maryland, USAa; Henry M. Jackson Foundation for the Advancement of Military Medicine, Bethesda, Maryland, USAb; Department of Immunology & Microbiology, University of North Carolina, Chapel Hill, North Carolina, USAc; Office for Research and Development, Faculty of Medicine Siriraj Hospital, Mahidol University, Bangkok, Thailandd; Department of Microbiology, Perelman School of Medicine, University of Pennsylvania, Philadelphia, Pennsylvania, USAe; Department of Retrovirology, United States Army Medical Component, Armed Forces Research Institute of Medical Sciences (USAMC-AFRIMS), Bangkok, Thailandf; Walter Reed Project-Kenya, Kericho, Kenyag; Walter Reed Program-Tanzania, Mbeya, Tanzaniah; Makerere University Walter Reed Project, Kampala, Ugandai; Institute for HIV Research, University Hospital in Essen, University of Duisburg-Essen, Essen, Germanyj; International Vaccine Institute, Seoul, South Koreak
ABSTRACT
Attrition within the CD4
ⴙT cell compartment, high viremia, and a cytokine storm characterize the early days after HIV
infec-tion. When the first emerging HIV-specific CD8
ⴙT cell responses gain control over viral replication it is incomplete, and
clear-ance of HIV infection is not achieved even in the rare cases of individuals who spontaneously control viral replication to nearly
immeasurably low levels. Thus, despite their partial ability to control viremia, HIV-specific CD8
ⴙT cell responses are
insuffi-cient to clear HIV infection. Studying individuals in the first few days of acute HIV infection, we detected the emergence of a
unique population of CD38
ⴙCD27
ⴚCD8
ⴙT cells characterized by the low expression of the CD8 receptor (CD8
dim).
Interest-ingly, while high frequencies of HIV-specific CD8
ⴙT cell responses occur within the CD38
ⴙCD27
ⴚCD8
dimT cell population,
the minority populations of CD8
brightT cells are significantly more effective in inhibiting HIV replication. Furthermore, the
fre-quency of CD8
dimT cells directly correlates with viral load and clinical predictors of more rapid disease progression. We found
that a canonical burst of proliferative cytokines coincides with the emergence of CD8
dimT cells, and the size of this population
inversely correlates with the acute loss of CD4
ⴙT cells. These data indicate, for the first time, that early CD4
ⴙT cell loss
coin-cides with the expansion of a functionally impaired HIV-specific CD8
dimT cell population less efficient in controlling HIV
viremia.
IMPORTANCE
A distinct population of activated CD8
ⴙT cells appears during acute HIV infection with diminished capacity to inhibit HIV
rep-lication and is predictive of viral set point, offering the first immunologic evidence of CD8
ⴙT cell dysfunction during acute
in-fection.
I
mmense levels of human immunodeficiency virus (HIV)
repli-cation during the first days of infection are accompanied by
dramatic changes in the immune system that may determine the
quality of the subsequent immune response and ability to control
HIV replication (
1
). The acute destruction of over half of the
body’s memory CD4
⫹T cells (
2
) is accompanied by changes in the
immune system, including a drop in the B cell compartment and a
major innate cytokine storm (
3
). Subsequent development of the
adaptive HIV-specific CD8
⫹T cell response exerts selection
pres-sure on the virus, forcing it to evolve to evade immune recognition
and resulting in a lower level and semistable viral set point (
4
,
5
).
The level of the early viral set point is highly predictive for
long-term disease outcome (
6
,
7
), supporting the notion that the
earli-est events shaping the T cell responses are setting the stage for
disease progression. Indeed, some individual HIV-specific CD8
⫹T cell responses during acute HIV infection have been identified
to dictate long-term disease outcome (
8
,
9
).
However, while the first emerging HIV-specific CD8
⫹T cell
responses are able to gain initial control over viral replication,
CD8
⫹T cell-mediated control is incomplete, immunological
clearance of HIV infection is never observed, and viral replication
persists (
10
). This is partially due to HIV’s ability to escape from
CD8
⫹T cell targeted epitopes (
11
,
12
), resulting in either the lack
of recognition or generation of
de novo
CD8
⫹T cell responses
against the variant epitope (
13
).
In the best (but rare) cases, HIV-specific CD8
⫹T cell responses
are able to effectively control viral replication to nearly
immeasur-Received30 October 2015Accepted28 January 2016 Accepted manuscript posted online3 February 2016
CitationEller MA, Goonetilleke N, Tassaneetrithep B, Eller LA, Costanzo MC, Johnson S, Betts MR, Krebs SJ, Slike BM, Nitayaphan S, Rono K, Tovanabutra S, Maganga L, Kibuuka H, Jagodzinski L, Peel S, Rolland M, Marovich MA, Kim JH, Michael NL, Robb ML, Streeck H. 2016. Expansion of inefficient HIV-specific CD8 T cells during acute infection. J Virol 90:4005– 4016.doi:10.1128/JVI.02785-15. Editor:G. Silvestri
Address correspondence to Hendrik Streeck, [email protected].
M.L.R. and H.S. contributed equally.
*Present address: Mary A. Marovich, National Institute of Allergy and Infectious Diseases, Bethesda, Maryland, USA.
ably low levels. However, even then HIV cannot be cleared, and
the ongoing fight between virus and T cells leads to a deterioration
and exhaustion of the CD8
⫹T cell responses (
14–16
). This
ex-haustion is characterized by a hierarchical loss of functions and
significant changes in the surface receptors, including the
upregu-lation of inhibitory receptors such as programmed death 1 (PD1).
Thus, besides the generation of the large breadth and magnitude
of CD8
⫹T cell responses, the adaptive immune response appears
to suffer from insufficient effector function after acute HIV
infec-tion that can be explained neither by exhausinfec-tion nor CD8
⫹T cell
escape. Here, we assessed HIV-infected individuals at the earliest
phase of acute infection to determine whether the failure to mount
effective HIV-specific CD8
⫹T cell responses can be traced to early
immunological changes and describe a population of CD8
⫹T
cells that is associated with a lack of subsequent control.
MATERIALS AND METHODS
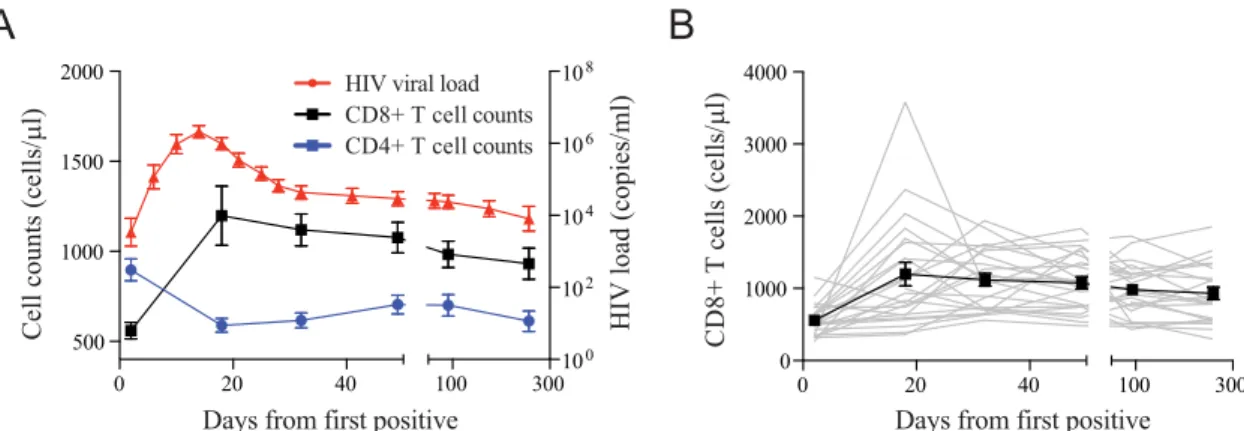
Study participants.Twenty-four HIV-1 acutely infected participants identified from the RV217 early-capture HIV cohort were selected based on preinfection sample availability and at least two time points sampled after infection and prior to peak viremia. RV217 is a multicenter, nonran-domized clinical observational study designed to describe the biological characteristics of acute HIV-1 infection in high-risk volunteers from Af-rica and Southeast Asia. Acute HIV-1 infection was determined from twice-weekly blood draws of at-risk populations using a nucleic acid test, the Aptima HIV-1 RNA qualitative assay (Hologic Gen-Probe Inc., San Diego, CA, USA), and confirmed by enzyme linked immunoassays and Western blotting after the advent of detectable antibodies. HIV-1 viral load was determined at every study visit with longitudinal samples using
the Abbott real-time HIV-1 assay with a detection limit of 40 HIV RNA copies/ml (Abbott Laboratories, Abbott Park, IL, USA). The HIV-1 viral set point was defined as the average of all viral load measurements be-tween day 80 and day 365 in the absence of treatment, and it required at least two measurements. Two study participants were considered to have a missing set point viral load due to one individual initiating antiretroviral therapy (ART) at day 35 and the other having only one measurement available after day 80 prior to ART initiation; therefore, they were ex-cluded from analysis with disease progression. Lymphocyte immunophe-notyping was performed on fresh whole blood using the single-platform BD Multiset TruCount method to determine absolute counts and
per-centages (BD Biosciences, San Jose, CA, USA).Table 1summarizes
pa-tient demographics. CD8⫹T cell evaluation was completed through a
median of 54 days for all participants with an average of 7 time points analyzed for the 13 East Africans and 11 Southeast Asians. One individual initiated antiretroviral therapy prior to the establishment of set point HIV-1 viral load.
Ethics statement.All individuals participating in this study provided written informed consent. Ethical approval was obtained from institu-tional review boards in each country as well as the Human Subjects Pro-tection Branch at the Walter Reed Army Institute of Research, which approved the overall protocol.
Phenotypic analysis.One hundred sixty-seven cryopreserved periph-eral blood mononuclear cell (PBMC) samples of 24 individuals were thawed and used for this study. Cells were washed in serum-free medium and stained with Live/Dead fixable aqua (Life Technologies, Grand Island, NY, USA) to exclude nonviable cells. PBMC then were washed with stain-ing buffer containstain-ing 0.5% bovine serum albumin (BSA)– 0.01% azide and stained with 2 panels of monoclonal antibodies for polychromatic flow-cytometric analysis. Antibodies used included CD4 Qdot605 (clone
TABLE 1RV217 patient demographics
Patient ID Gender Age (yr) Country
CD4 T cell nadir (cells/l)
Time to peak
VLa(days)
Peak VL (log10
copies/ml)
Set point VLb
(log10copies/ml)
10220 F 33 Uganda 796 18 5.49 3.69
10428 F 27 Uganda 421 10 6.92 4.08
10435 F 18 Uganda 392 14 6.74 3.52
20225 F 24 Kenya 819 9 7.99 4.28
20263 F 20 Kenya 462 11 8.20 2.52
20337 F 24 Kenya 142 14 7.64 5.35
20355 F 24 Kenya 430 11 6.02 3.01
20368 F 18 Kenya 676 13 6.12 *
20509 F 24 Kenya 673 14 6.93 3.04
20511 F 24 Kenya 285 14 6.73 4.54
30112 F 25 Tanzania 884 18 7.50 4.38
30124 F 24 Tanzania 464 14 6.76 4.83
30190 F 25 Tanzania 511 11 7.34 5.96
40007 M 25 Thailand 406 15 7.31 5.35
40061 F 48 Thailand 312 14 5.79 *
40094 M 19 Thailand 866 16 6.40 4.64
40100 M 18 Thailand 467 10 8.46 5.22
40123 M 23 Thailand 616 14 6.24 4.47
40168 MtFc 25 Thailand 444 11 6.66 5.28
40250 M 35 Thailand 522 19 6.67 4.83
40257 MtF 18 Thailand 370 10 7.35 5.39
40265 M 23 Thailand 476 12 6.49 4.83
40353 M 21 Thailand 516 17 5.81 3.60
40363 MtF 29 Thailand 576 14 6.86 4.77
Average 25 522 13 6.85 4.44
aPeak indicates the true peak; VL indicates HIV-1 load (copies/ml).
b
Set point VL is the average of all measured viral loads between day 80 and day 365 in the absence of treatment (requiring at least two measurements). An asterisk indicates that a set point cannot be defined because of treatment.
c
S3.5), CD8a phycoerythrin (PE)-TR (clone 3B5), CD14 Tri-Color (clone Tük4), and CD19 Tri-Color (clone SJ25-C1), all from Life Technologies. CD3 allophycocyanin (APC)-eF780 (clone UCHT1), CD45R0 eFluor 650NC (clone UCHL1), and HLA-DR eFluor 450 (clone L243) were from eBioscience, Inc., San Diego, CA, USA. CD27 peridinin chlorophyll pro-tein (PerCP)-Cy5.5 and Alexa Fluor 700 (clone O323), CD28 biotinylated (clone CD28.2), CD45RA PerCP-Cy5.5 (clone HI100), CD57 fluorescein isothiocyanate (FITC) (clone HCD57), CD62L Alexa Fluor 700 (clone DREG-56), CD95 Alexa Fluor 647 (clone DX2), and CD127 BV421 (clone A019D5) were all from BioLegend (San Diego, CA, USA). CD38 APC (clone HB7), CD56 PE-Cy5 (clone B159), CD95 PE-Cy7 (clone DX2), CCR5 (CD195) FITC (clone 2D7/CCR5), CCR7 (CD197) PE-Cy7 (clone 3D12), CXCR3 (CD183) PE (clone 1C6/CXCR3), and PD-1 (CD279) PE
(clone EH12.1) all were procured from BD Biosciences.␣47 (ACT-1
clone) (NIH AIDS Research and Reference Reagent Program) was conju-gated in-house with an eFluor 650 nanocrystal conjugation kit–amine-reactive kit (eBioscience). After incubation, cells were washed with stain-ing buffer and secondary Qdot 800 Streptavidin conjugate (Life Technologies) was applied for CD28. Cells were washed, fixed with 2% formaldehyde for 20 min, washed again, and resuspended in staining buf-fer. Samples then were acquired on an LSRII with a 4-laser configuration (BD Biosciences) and analyzed using Flow Jo, version 9.7.5 (TreeStar, Inc., Ashland, OR, USA).
Assessment of autologous HIV-specific CD8ⴙ T cell responses.
Founder viruses of three study participants were deduced from plasma from the first time point preceding peak viremia with greater than 10,000 copies/ml following full-length single-genome amplification sequencing
using Sanger technology as described elsewhere (17). Autologous
overlap-ping peptides (18mer overlapoverlap-ping by 10 amino acids) were synthesized on the basis of the viral sequence for each individual. Five peptide pools then were generated for Gag, Env, Nef, Pol, and accessory proteins. PBMC were thawed, counted, and plated as described above. Cells were stimulated in
the presence of 3g/ml HIV peptide pools, costimulatory antibodies
CD28/CD49d and CD107a⫺FITC (clone H4A3) (BD Biosciences), and
incubated at 5% CO2at 37°C for 6 h. Brefeldin A and monensin were
added 2 h after stimulation. Cells were processed as described above. Antibodies include CD14 Tri-Color (clone Tük4) and CD19 Tri-Color (clone SJ25-C1), both from Life Technologies, CD38 APC (clone HB7), CD56 PE-Cy5 (clone B159), CD197 PE-Cy7 (clone 3D12), and HLA-DR APC-H7 (clone L243), all from BD Biosciences, CD45RO eFluor 650NC (clone UCHL1) from eBioscience, and CD27 AL700 (clone O323) from BioLegend. Cells then were washed, fixed in 2% formaldehyde, and per-meabilized using Perm/Wash buffer (BD Biosciences). Cells then were stained intracellularly with CD3 PE-TR (clone S4.1) and CD4 Qdot605 (clone S3.5) from Life Technologies, CD8 PerCP-Cy5.5 (clone SK1) and interleukin-2 (IL-2) FITC (clone 5344.111) from BD Bioscience, and
gamma interferon (IFN-␥) eFluor 450NC (clone 4S.B3) from
eBiosci-ence. Cells were washed, resuspended in staining buffer, and acquired on an LSRII flow cytometer (BD Biosciences).
Viral inhibition assay.PBMC from six patients identified in early acute infection were sorted using a FACSAria SORP (BD Biosciences) into
CD4, CD8bright, and CD8dimT cells. Sorted cells were rested overnight at
37°C in RPMI containing 20% fetal bovine serum (FBS), IL-2 (50 IU/ml), and IL-7 (5 ng/ml) in preparation for a modified viral inhibition assay as
previously described (18). The target cells (autologous CD4⫹T cells) were
infected with a nevirapine-resistant virus at a multiplicity of infection (MOI) of 0.01 for 2 h. Excess virus was washed off and 100,000 cells were added to a 96-well plate in RPMI–10% fetal calf serum (FCS). Effector
cells (CD8brightand CD8dimT cells) were added to the targets at a ratio of
1:1. Nevirapine (NIH AIDS Reagent Program) was added to cultures on
day 0 at a concentration of 10g/ml from a stock solution of 0.1 mg/ml.
Supernatant was removed 3, 5, and 7 days postinfection and frozen at⫺80
before quantitative PCR (qPCR).
Soluble factor analysis.The cytokine levels of IL-2, IL-15, and IL-21 were assessed using a standard Luminex multiplexed bead system
(Mil-liplex) according to the manufacturer’s instructions and as previously
described (19). Results obtained from the Bio-Plex system were analyzed
automatically by the Bio-Plex Manager software program (Bio-Rad Lab-oratories Inc., Hercules, CA, USA) using a (5PL-fit) standard curve de-rived from recombinant cytokine and chemokine standards. IL-7 was quantified from longitudinal citrate plasma samples by electrochemilumi-nescent detection enzyme-linked immunosorbent assay (ELISA) according to the manufacturer’s protocol (Meso Scale Discovery, Rockville, MD). Briefly, samples were diluted 1:2 in assay buffer and loaded onto the MSD plate in duplicate along with an 8-point, 4-fold standard curve, also in dupli-cate. After 2 h, plates were washed, and detection antibody bound to an elec-trochemiluminescent label was added for 2 h. Plates were washed again and read buffer added before the image was captured using a Meso QuickPlex SQ120 imager and analyzed with Discovery Workbench 4.0 software.
Statistical analysis.Statistical analysis was performed using Graph Pad Prism software version 6.0a for Mac OS X (GraphPad Software, La Jolla, CA, USA), JMP version 10.0.0, and SAS v9.3 (SAS, Cary, NC, USA). The standard score (Z score) for each analyte at each time point was calculated as sample measurement minus mean at baseline divided by standard deviations at baseline. Analysis of immunologic variables before and after infection was completed using the Friedman test for matched nonparametric data. Comparisons between groups were performed using the nonparametric Mann-Whitney U test or Wilcoxon method for con-tinuous data. Correlations between concon-tinuous outcomes were deter-mined by Spearman’s rank correlation. For predictive associations of set point HIV viral load, linear regression models were generated. Assessing
model fit for maximum CD8dimCD38⫹CD27⫺T cell frequency revealed
two observations with a high Cook’s distance, and models were fit with and without these observations. Statistical significance was assessed at the 0.05 level.
RESULTS
Acute emergence of HIV-specific CD8
ⴙT cells with a unique
phenotype.
To investigate the limited ability of HIV-specific
CD8
⫹T cells to completely control viremia during acute HIV
infection, we studied a prospective cohort of high-risk
HIV-unin-fected individuals from East Africa and Thailand (RV 217/ECHO)
undergoing twice-weekly nucleic acid testing (Aptima HIV-1
RNA qualitative assay) to identify individuals in the earliest period
after HIV infection (
20
). Twenty-four participants with extensive
peripheral blood sampling before infection and also prior to peak
HIV viral load were included in this study. Patient characteristics
and demographics are shown in
Table 1
. Viral load peaked on
average 13 days after the first reactive HIV RNA test and ranged
from 5.49 log
10to 8.46 log
10HIV RNA copies/ml, with a median of
6.7 log
10HIV RNA copies/ml. Viral set point occurred an average
of 41 days after peak and ranged from 2.52 log
10to 5.96 log
10HIV
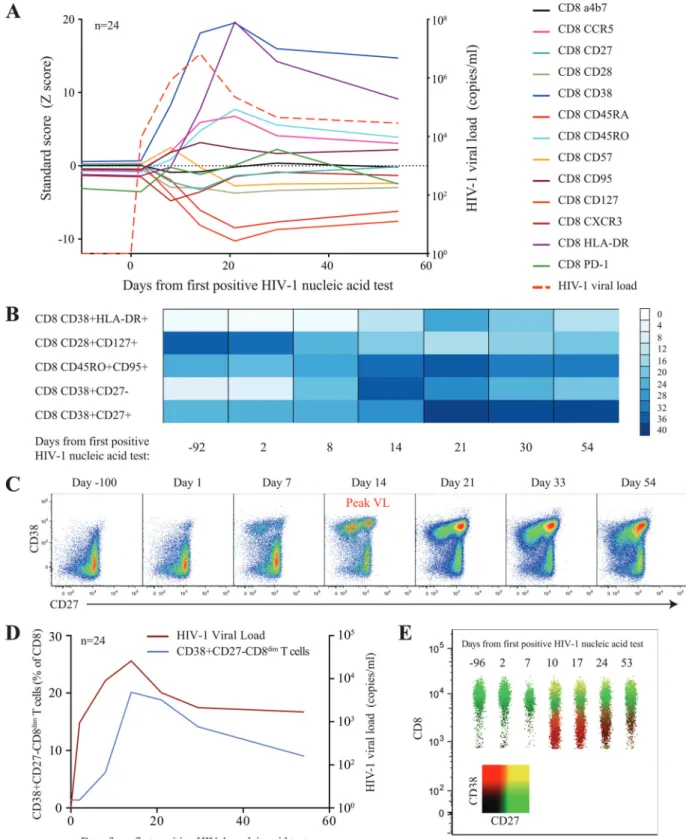
cells with the CD38
⫹HLADR
⫹phenotype. The most dramatic
changes were observed with the emergence of a CD8
⫹T cell
pop-ulation characterized by the CD38
⫹CD27
⫺phenotype (
Fig. 3B
and
C
), which appeared a median of 8 days after the detection of
HIV-1 RNA in the periphery, closely followed viral load trajectory,
but it continued to be significantly elevated for the remainder of
the study (
P
⬍
0.001) (
Fig. 3D
). This population, clearly
distin-guishable by the lower expression of the CD8 receptor (CD8
dim)
(
Fig. 3E
), was absent prior to HIV infection. Taken together, we
found dramatic harmonized changes within the CD8
⫹T cell
com-partment characterized by the emergence of a unique CD38
⫹CD27
⫺CD8
dimT cell subset.
Early changes in the CD8
ⴙT cell compartment is associated
with loss of CD4
ⴙT helper cells.
Given the dramatic loss of
pe-ripheral CD4
⫹T cells during acute HIV infection, we wondered
whether the emergence of this aberrant CD8
⫹T cell population is
associated with the early changes in the CD4
⫹T cell
compart-ment. While CD4
⫹and CD8
⫹T cell homeostasis are believed to
be rather independent (
21
), we found that the CD4 nadir, defined
as the minimum CD4
⫹T cell absolute count in acute HIV
infec-tion prior to day 80, was inversely correlated with HIV viral load
(rho
⫽ ⫺
0.478,
P
⫽
0.024) (
Fig. 4A
) and HIV levels of CD38
⫹CD27
⫺CD8
dimT cells (rho
⫽ ⫺
0.495,
P
⫽
0.014) (
Fig. 4B
) at a
time when viral decline is most profound, suggesting that at least
in part the damage to the CD4
⫹T cell compartment is associated
with the emergence of this unique CD8
⫹T cell phenotype. Indeed,
we observed inverse trajectories of CD4 absolute counts and
CD38
⫹CD27
⫺CD8
dimT cell frequency longitudinally during
acute HIV-1 infection (
Fig. 4C
). To further understand the link
between CD4 loss and CD8
⫹T cell proliferation, we next
deter-mined plasma levels of proliferative cytokines, including IL-2,
IL-7, IL-15, and IL-21 (
22
). While we found no direct link between
a single cytokine and the emergence of CD8
dimT cells, we
never-theless observed that a canonical burst of the cytokines preceded
the expansion of the CD38
⫹CD27
⫺CD8
dimT cell subset (
Fig.
4D
). Thus, our data suggest that the extent of damage to the CD4
⫹T cell compartment during acute HIV infection may in part
con-tribute to the development of unique phenotypes of activated
CD8
⫹T cells.
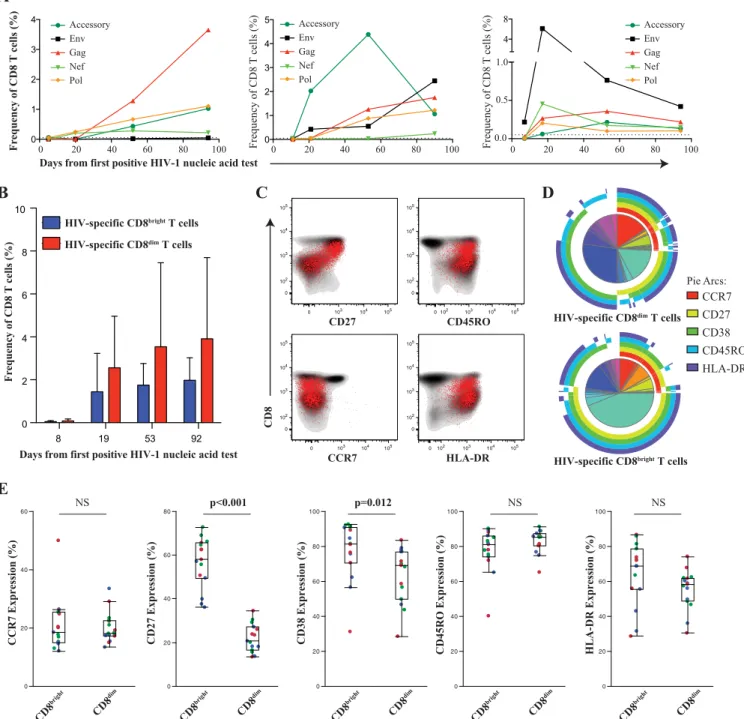
High frequency of HIV-specific CD8
ⴙT cells are CD38
ⴙCD27
ⴚCD8
dimT cells.
We next investigated whether the
expan-sion of the CD8
dimpopulation is virus specific or a nonspecific
alteration within the CD8
⫹T cell compartment. Given the vast
amount of HIV sequence diversity and recombinant forms in
par-ticular in the East-African population, we sequenced the founder
virus from three study participants and generated autologous
pep-tide sets spanning the entire HIV proteome to accurately
deter-mine the contribution of virus-specific CD8
⫹T cells to the
in-crease of CD38
⫹CD27
⫺CD8
dimT cells (
23
,
24
). In all three
longitudinally studied individuals, we observed the emergence of
HIV-specific CD8
⫹T cells, determined by either degranulation
(CD107a) or cytokine production (IFN-
␥
or IL-2), early in acute
HIV infection with various kinetics and specificities (
Fig. 5A
).
While the majority of the responses increased over time, there
were some individual responses targeting more variable segments
of the viral proteome that showed an early expansion but then
declined over the initial period of infection, as previously
de-scribed (
23
,
24
). Interestingly, both CD8
brightand CD8
dimT cells
contained specific responses, yet a higher frequency of
HIV-specific CD8
⫹T cell responses are within the CD8
dimpopulation
(
Fig. 5B
). It is important to note that no specific trends or patterns
emerged with regard to the epitope targeting between the
CD8
brightand CD8
dimT cells. We further characterized the
HIV-specific CD8
⫹T cell population and found that they
demon-strated lower expression of CD27, with an effector memory
phe-notype (CCR7
⫺CD45RO
⫹), and were consistently HLADR
⫹(
Fig. 5C
). Coordinated expression patterns of CCR7, CD27,
CD38, CD45RO, and HLA-DR were significantly different
be-tween HIV-specific CD8
brightand CD8
dimT cells (
P
⬍
0.001) (
Fig.
5D
). Interestingly, the only distinct subset we observed within this
homogenous virus-specific CD8
⫹T cell population was the
CD38
⫹CD27
⫺CD8
dimT cell population (
Fig. 5E
).
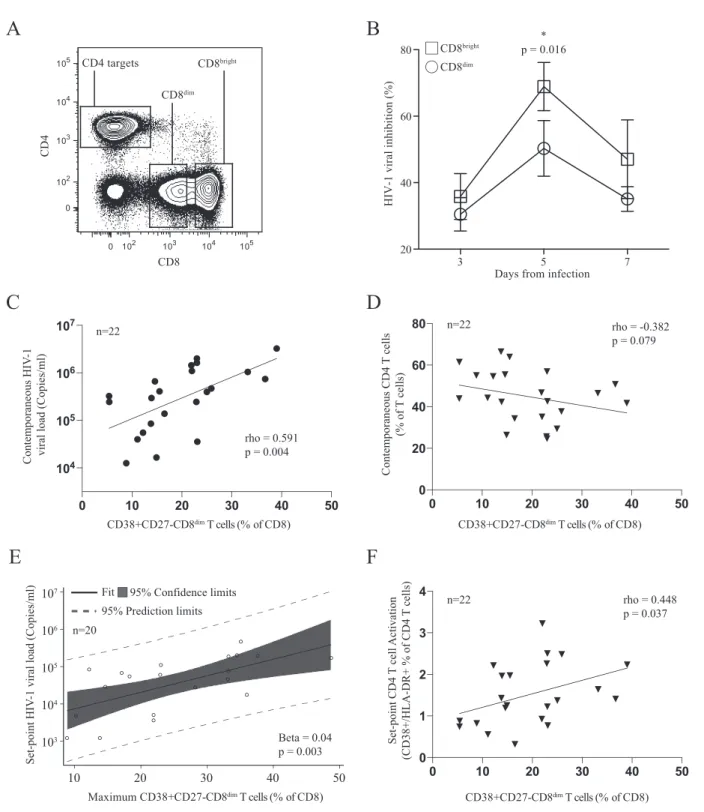
CD38
ⴙCD27
ⴚCD8
dimT cells are inefficient in control of
viral replication.
We next asked whether the two phenotypically
distinct CD8
⫹T cell populations with HIV-specific functional
activity were equally capable of controlling HIV viremia.
There-fore, we purified CD8
brightand CD8
dimT cells from 6 patients
immediately following peak viremia (average of 4 days after peak
viremia [14 to 21 days following the first positive HIV
determina-tion]), where the most precipitous viral load decline occurs. We
simultaneously activated and infected autologous CD4
⫹T cells as
target cells with nevirapine-resistant virus in culture (
Fig. 6A
).
Cell counts (cells
/
µ
l)
HIV
load (copies/ml)
CD8+ T
cells
(cells/
µ
l)
CD4+ T cell counts CD8+ T cell counts HIV viral load
Days from first positiv
B
A
D
e ays from first positive
0 20 40 100 300
500 1000 1500 2000
100 102 104 106 108
0 20 40 100 300
0 1000 2000 3000 4000
A
D
C
B
J
I
H
G
F
E
L
K
M
CD8
T
cell CD45RO (%)
Time from Infection (days)
-20 0 20 40 60 0
20 40 60 80 100
CD8
T
cell CD45RA
(%)
Time from Infection (days)
-20 0 20 40 60 0
20 40 60 80 100
CD8 T
cell
CD38
(%)
Time from Infection (days)
-20 0 20 40 60 0
20 40 60 80 100
CD8
T
cell HLA-DR (%)
Time from Infection (days)
-20 0 20 40 60 0
10 20 30 40 50
CD8
T
cell PD-1 (%)
Time from Infection (days)
-20 0 20 40 60 0
20 40 60 80
CD8
T
cell CD27 (%)
Time from Infection (days)
-20 0 20 40 60 0
20 40 60 80 100
CD8 T
cell
CD28
(%)
Time from Infection (days)
-20 0 20 40 60 0
20 40 60 80 100
CD8
T
cell CD57 (%)
Time from Infection (days)
-20 0 20 40 60 0
20 40 60 80
CD8
T
cell a4b7 (%)
Time from Infection (days)
-20 0 20 40 60 0
10 20 30 40 50
CD8
T
cell CCR5 (%)
Time from Infection (days)
-20 0 20 40 60 0
20 40 60 80
CD8
T
cell CXCR3 (%)
Time from Infection (days)
-20 0 20 40 60 0
10 20 30 40
CD8
T
cell CD95 (%)
Time from Infection (days)
-20 0 20 40 60 0
20 40 60 80 100
CD8
T
cell CD127 (%)
Time from Infection (days)
-20 0 20 40 60 0
20 40 60 80 100
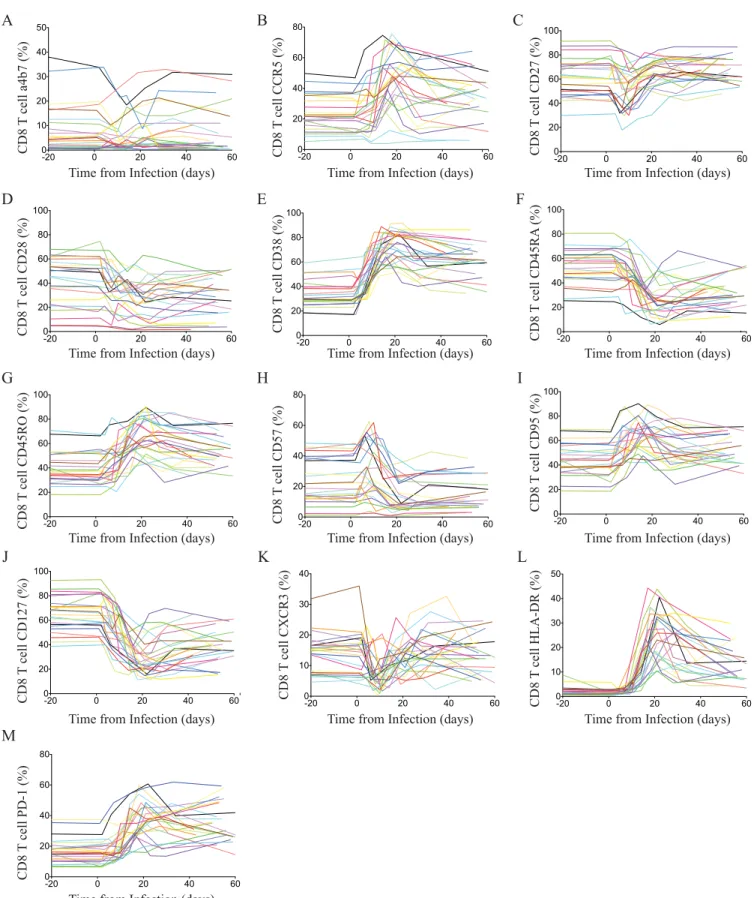
FIG 2Bulk CD8 T cell receptor changes through acute HIV-1 infection. Changes of individual markers on CD8 T cells for all patients during acute HIV infection.
The relative frequency of CD8 T cells expressing␣47 (A), CCR5 (B), CD27 (C), CD28 (D), CD38 (E), CD45RA (F), CD45RO (G), CD57 (H), CD95 (I), CD127
FIG 3Longitudinal changes of surface maker expression on CD8⫹T cells during acute HIV infection. (A) Relative changes (Z-score) of surface markers on
CD8⫹T cells during acute HIV infection. Average viral loads are depicted as red-segmented lines from the first RNA-positive HIV nucleic acid test. (B) Color
intensity map of the most dramatic shifts within the CD8⫹T cell populations during acute HIV infection. Populations are shown as a median frequency of CD8⫹
T cells based on specific combinations of receptors from green (no expression) to red (⬃40% expression). (C) Successive pseudocolor plots from CD8⫹T cells,
demonstrating CD38 against CD27 longitudinally, through acute HIV-1 infection and the emergence of a CD38⫹CD27⫺population in a representative donor.
(D) Expansion of cells in association with viral loads. (E) Concatenated polychromatic plot of CD8 over time depicts the emergence of the CD38⫹CD27⫺
Proportional scaled baseline fold change
in group mean plasma analyte level (% of maximum)
Smooth curve of
C
D
3
8
+
C
D
2
7
-C
D
8
di
m T cell
fr
eq
u
en
cy
(% of CD8)
A
D
P
o
st
p
eak
CD38+
CD27-C
D
8
di
m
T cells (
%
o
f C
D
8
)
Nadir CD4 count (cells/ml)
B
rho = -0.468 p = 0.028
0 200 400 600 800 1000 104
105 106 107
Nadir CD4 count (cells/ml)
HIV
-1 Load post peak (copies/ml)
rho = -0.478 p = 0.024
0 200 400 600 800 1000 0
10 20 30 40 50
0 20 40
5 10 15
650 700 750
CD38+CD27-CD8dim T cells
CD4 T cells
C
Smooth curve of CD4 T cell absolute counts
(cells/ml)
Days from first positive HIV-1 nucleic acid test
Baseline fold change in group mean CD38+
CD27
-C
D
8
dim
T cell l
ev
el
0 5 10 15
0 50 100 150
0 5 10 15 20
IL-21
CD38+CD27-CD8dim T cells
IL-7
IL-15 IL-2
Days from first positive HIV-1 nucleic acid test n=22
n=22
n=22 n=22
FIG 4Temporal dynamics of CD4⫹T cell count, HIV-1 viral load, CD38⫹CD27⫺CD8dimT cell population, and plasma cytokine levels during acute HIV
infection (n⫽22). Two study participants were considered to have missing set point viral loads and were excluded. (A and B) Correlation of acute CD4 count
nadir and HIV-1 viral load (A) and frequency of CD38⫹CD27⫺CD8dimT cells an average 7 days after peak viral load (B). (C) Smoothed curve of means showing
trends in 22 HIV-1-infected individuals of CD4 absolute counts (green) and CD38⫹CD27⫺CD8dimT cell frequency (blue). (D) Scaled proportional group
means of IL-2 (red), IL-7 (green), IL-15 (gray), and IL-21 (orange) relative to plasma baseline levels for each analyte. Mean fold difference from the background
Immunofluorescently stained and sorted CD8
brightand CD8
dimT
cells were added as effector cells at a ratio of 1:1. Strikingly, after 5
days of infection, we found that the CD8
brightT cell population
was significantly more efficient at viral inhibition than the CD8
dimT cell population (65% versus 45%, respectively;
P
⫽
0.016)
de-spite the higher frequency of HIV-specific CD8
⫹T cells observed
in the CD8
dimT cell population (
Fig. 6B
). We next assessed
whether this population shows any association with levels of HIV
viral load. Indeed, we found that 7 days after peak viremia the
frequency of CD38
⫹CD27
⫺CD8
dimT cells was positively
associ-ated with viral load (rho
⫽
0.591,
P
⫽
0.004) (
Fig. 6C
). Examining
absolute CD4
⫹T cell counts at contemporaneous time points
A
B
E
0 20 40 60 0 20 40 60 80 0 20 40 60 80 100 0 20 40 60 80 100 0 20 40 60 80 100CD45RO Expression (%)
CD38 Expression (%)
CD27 Expression (%)
CCR7 Expression (%)
HLA-DR Expression (%)
NS p<0.001 p=0.012 NS NS
CD
8bright CD8
dim CD 8brigh t CD8 dim CD8 bright CD 8di m CD
8bright CD8
dim CD8 bright CD 8dim 0 1 2 3 4 0 1 2 3 4 5 4 8
Days from first positive HIV-1 nucleic acid test Days from first positive HIV-1 nucleic acid test
Fr
equency of CD8
T
cells (%)
C
Frequency of CD8
T
cells (%)
Frequency of CD8
T cells (%) Accessory Env Gag Nef Pol Accessory Env Gag Nef Pol Accessory Env Gag Nef Pol 100 0.0 0.5 1.0 80 60 40 20 0 100 80 60 40 20 0 100 80 60 40 20 0
0 103 104 105 0
102 103 104 105
0 102 103 104 105 0
102 103 104 105
0 103 104 105 0
102 103 104 105
0 102 103 104 105 0 102 103 104 105 CD27 CD45RO CCR7 HLA-DR CD8
HIV-specific CD8dim T cells
HIV-specific CD8bright T cells
CCR7 CD27 CD38 CD45RO HLA-DR Pie Arcs:
HIV-specific CD8dim T cells
D
HIV-specific CD8bright T cells
Fr
equency of CD8
T
cells (%)
8 19 53 92
0 2 4 6 8 10
FIG 5HIV-1-specific CD8⫹T cells within the CD8brightand CD8dimpopulation. PBMC from three donors were chosen an average 8, 19, 53, and 93 days after
the 1st RNA-positive HIV nucleic acid test. (A) Shown are the kinetics of total HIV-specific CD8⫹T cell responses (CD107a, IFN-␥, and/or IL-2) in each
individual measured by flow cytometry. (B) The majority of HIV-specific CD8⫹T cell responses emerge from the CD8dim(red) T population. (C) Representative
donor demonstrating the effector phenotype of the HIV-specific CD8⫹T cell responses (in red) overlaying the total CD8 compartment (contour plot, in gray).
(D) Pie charts showing average frequency of HIV-specific CD8brightand CD8dimT cells with combinatorial expression of 5 phenotypic markers assessed. Arcs
show individual expression levels of each phenotypic marker. (E) Box-and-whisker plots show the relative expression of phenotypic markers between
HIV-specific CD8brightand CD8dimT cells 39 days after peak viremia. Different donor responses are indicated by different colors for various peptide pools.
revealed a trend toward an inverse relationship with the frequency
of CD38
⫹CD27
⫺CD8
dimT cells (rho
⫽ ⫺
0.382,
P
⫽
0.079) (
Fig.
6D
). The maximum frequency of CD38
⫹CD27
⫺CD8
dimT cells,
which occurred an average of 18 days after the first positive HIV-1
nucleic acid test, was significantly correlated with set point viral
load (Spearman rho
⫽
0.498,
P
⫽
0.018). Fitting a linear
regres-sion model with the maximum frequency of CD38
⫹CD27
⫺CD8
dimT cells as a predictor yielded a positive relationship with a
Contemporaneous HI
V
-1
viral load (Copies/ml)
C
rho = -0.382 p = 0.079
rho = 0.591 p = 0.004
A B
Days from infection
HIV-1 viral inhibition (%)
CD8dim
CD8bright
0 102 103 104 105 0
102 103 104 105
CD
4
CD8 CD8dim
CD8bright
CD4 targets
* p = 0.016
Contemporaneous CD4
T
cells
(% of
T
cells
)
D
E F
Set-point CD4
T
cell
Activatio
n
(CD38+/HLA-DR+ % of CD4
T
cells
)
rho = 0.448 p = 0.037
3 5 7
20 40 60 80
Beta = 0.04 p = 0.003
CD38+CD27-CD8dim T cells (% of CD8)
CD38+CD27-CD8dim T cells (% of CD8)
CD38+CD27-CD8dim T cells (% of CD8)
95% Prediction limits Fit 95% Confidence limits
Maximum CD38+CD27-CD8dim T cells (% of CD8)
Set-point HIV
-1 viral load (Copies/ml)
104 105 106 107
103
10 20 30 40 50 0 10 20 30 4 0
0 1 2 3 4 n=22
n=20
0 10 20 30 4
0 5
0 50
0 20 40 60 80 n=22
0 10 20 30 40 50
104
105
106
107
n=22
FIG 6CD8dimCD38⫹CD27⫺T cell population demonstrates a less efficient ability to inhibit viral replicationin vitroand is associated with higher viral loads
in vivo. (A) Sorting strategy for CD8brightand CD8dimcells. (B) Differences in viral inhibition between CD8brightand CD8dimT cells. (C) CD8dimCD38⫹CD27⫺
T cell frequency correlates positively with contemporaneous viral loads an average of 7 days after peak viral load and (D) negatively correlates with
contempo-raneous CD4⫹T cell count. (E) Maximum CD8dimCD38⫹CD27⫺T cell frequency was predictive of HIV set point using linear regression after the removal of
two potential outliers. (F) CD8dimCD38⫹CD27⫺T cell frequency an average of 7 days after peak viral load correlates directly with set point activation of CD4⫹
marginally significant
P
value for set point viral load (beta
⫽
0.03,
P
⫽
0.066). Further examination of model fit revealed two data
points with a large Cook’s distance. Removing these potential
out-liers and refitting the model yielded a similar result with a
signif-icant
P
value (beta
⫽
0.04,
P
⫽
0.003) (
Fig. 6E
). In addition, the
frequency of less functional CD38
⫹CD27
⫺CD8
dimT cells was
positively associated with higher set-point CD4
⫹T cell activation
(rho
⫽
0.448,
P
⫽
0.037) (
Fig. 6F
), another marker of rapid HIV
disease progression. Taken together, these data suggest that the
loss of CD4
⫹T cells in acute HIV infection drives the emergence
of a suboptimal CD8
⫹T cell population that is less capable of
controlling viral replication and may reflect faster disease
progres-sion.
DISCUSSION
The efficacy of CD8
⫹T cell-mediated control of HIV replication is
one of the leading underlying mechanisms that determine the
long-term control and disease progression in the absence of
anti-retroviral therapy. However, in most cases of HIV-infected
indi-viduals, CD8
⫹T cells are incapable of achieving durable control of
HIV replication, and there is no documented case of natural
clear-ance or cure from HIV infection. Here, we found that the
ineffi-ciency of CD8
⫹T cells to control viral replication is associated
with the emergence of a unique CD8
⫹T cell phenotype. These
CD8
⫹T cells are characterized by the expression of CD38
⫹CD27
⫺and low expression of the CD8
⫹T cell receptor. While
these cells harbor a high frequency of HIV-specific CD8
⫹T cell
responses, they are less efficient at suppressing viral replication.
Moreover, we found that the frequency of this particular
pheno-type was associated with viral loads and markers for disease
pro-gression, suggesting that the generation of CD8
⫹T cells with the
aberrant phenotype greatly influences long-term disease
out-come.
CD8
⫹T cells with low expression of the CD8
⫹receptor have
been observed previously in persistent viral infections and
de-scribed to have inefficient cytotoxic activity (
25–27
). Indeed, the
presence of a CD8
dimpopulation also has been described in
chronic HIV infection and associated with poor disease outcome
(
28
). The physiologic role for CD8
dimT cells currently is
un-known. It has been speculated that either antigen persistence
drives the development of an inefficient cellular T cell population
or that these cells emerge as a regulatory population that controls
the intensity of ongoing cytolytic and tissue-damaging activity
(
29
). While both scenarios have been described in chronic
infec-tion and later stages of viral infecinfec-tions, the emergence of these cells
during the acute phase of HIV infection is surprising and has been
described previously only in simian immunodeficiency virus
(SIV) infection (
26
). In particular, as a large fraction of
HIV-specific CD8
⫹T cell responses are contained in the CD8
dimpop-ulation, their overall contribution to the control of viral
replica-tion appears to be relatively minor. Indeed, the frequency of these
CD8
⫹T cells positively correlates with HIV viral load and portend
a worse prognosis for disease progression. A potential explanation
for the emergence of a dysfunctional CD8
⫹T cell population is the
lack of CD4 help during the acute phase of HIV infection due to
the massive destruction in the CD4
⫹T cell compartment. While
studies have demonstrated that efficient CD8
⫹T cell responses
can be primed in the absence of CD4 help (reviewed in reference
30
), CD4-mediated helper signals nevertheless often are required
for the generation of long-lived, functional memory CD8
⫹T cell
responses. Indeed, it has been described that the lack of CD4
⫹T
cell help in the acute phase of infections can influence the
fre-quency, phenotype, and function of CD8
⫹T cell responses (
31
,
32
). Here, we found that the size of the CD8
dimT cell population
was associated with the early CD4
⫹T cell nadir, suggesting that
the loss of early CD4
⫹T cells and their helper function is involved
in the emergence of the unique CD8
⫹T cell populations. Previous
studies have already suggested that a low acute CD4 nadir is
asso-ciated with a poor long-term disease outcome (
33
), but a link to
the CD8
⫹T cell population has not been established. A further
indicator that insufficient CD4 help is driving the CD8
dimpheno-type is the activated CD8
⫹T cell phenotype (CD38) but lack of
CD27 expression. Previous studies suggested that CD8
⫹T cells
primed in the absence of CD4 help lack the expression of CD27,
which renders them inefficient to expand in the recall phase of the
response (
34
,
35
).
Thus, our data suggest an explanation for differences in
prog-nosis as estimated here by viral load set point and CD4 activation
in which CD4 count loss and canonical bursts of proliferative
cytokines drive the expansion of a less functional CD8
⫹T cell
population that is not able to fully suppress viremia. Furthermore,
our data support the notion that ART treatment during early
acute HIV infection leads to an overall improvement of CD8
⫹T
cell function by preventing or limiting the emergence of the
CD8
dimpopulation and ultimately permit durable control of HIV
with future treatment interruptions due to a more dominant and
functional CD8
brightHIV-specific immune response (
36–39
).
ACKNOWLEDGMENTS
We thank the women and men who participated in the RV217 study. We also thank the RV217 study team: Jeffrey R. Currier, Peter Dawson, Fatim Jallow, Silvia Ratto-Kim, Eugene Kroon, Cornelia Lueer, Jennifer Malia, Mark Manak, Mark Milazzo, Robert O’Connell, Joseph Oundo, Donald Stablein, Erica Sanga, Somchai Sriplichien, and Rapee Trichavaroj.
Financial support for this study was provided by the U.S. Army under cooperative agreement W81XWH-11-2-0174 and the National Institute of Allergy and Infectious Diseases, U.S. National Institutes of Health. The following reagents were obtained through the NIH AIDS Reagent
Pro-gram, Division of AIDS, NIAID, NIH:␣4-7 monoclonal antibody
(cat-alog no. 11718) from A. A. Ansari and nevirapine.
The views expressed are those of the authors and should not be con-strued to represent the positions of the U.S. Army or the Department of Defense.
FUNDING INFORMATION
This work was supported by a cooperative agreement (W81XWH-11-2-0174) between the Henry M. Jackson Foundation for the Advancement of Military Medicine, Inc., and the U.S. Department of Defense (DoD).
REFERENCES
1.McMichael AJ, Borrow P, Tomaras GD, Goonetilleke N, Haynes BF.
2010. The immune response during acute HIV-1 infection: clues for
vac-cine development. Nat Rev Immunol10:11–23.http://dx.doi.org/10.1038
/nri2674.
2.Mattapallil JJ, Douek DC, Hill B, Nishimura Y, Martin M, Roederer M.
2005. Massive infection and loss of memory CD4⫹T cells in multiple
tissues during acute SIV infection. Nature434:1093–1097.http://dx.doi
.org/10.1038/nature03501.
3.Stacey AR, Norris PJ, Qin L, Haygreen EA, Taylor E, Heitman J, Lebedeva M, DeCamp A, Li D, Grove D, Self SG, Borrow P. 2009. Induction of a striking systemic cytokine cascade prior to peak viremia in acute human immunodeficiency virus type 1 infection, in contrast to more modest and delayed responses in acute hepatitis B and C virus
4.Borrow P, Lewicki H, Hahn BH, Shaw GM, Oldstone MB. 1994.
Virus-specific CD8⫹cytotoxic T-lymphocyte activity associated with
con-trol of viremia in primary human immunodeficiency virus type 1
infec-tion. J Virol68:6103– 6110.
5.Koup RA, Safrit JT, Cao Y, Andrews CA, McLeod G, Borkowsky W, Farthing C, Ho DD.1994. Temporal association of cellular immune responses with the initial control of viremia in primary human
immuno-deficiency virus type 1 syndrome. J Virol68:4650 – 4655.
6.Lyles RH, Munoz A, Yamashita TE, Bazmi H, Detels R, Rinaldo CR, Margolick JB, Phair JP, Mellors JW.2000. Natural history of human immunodeficiency virus type 1 viremia after seroconversion and proximal to AIDS in a large cohort of homosexual men. Multicenter AIDS cohort
study. J Infect Dis181:872– 880.
7.Mellors JW, Rinaldo CR, Jr, Gupta P, White RM, Todd JA, Kingsley LA.
1996. Prognosis in HIV-1 infection predicted by the quantity of virus in
plasma. Science 272:1167–1170. http://dx.doi.org/10.1126/science.272
.5265.1167.
8.Goulder PJ, Phillips RE, Colbert RA, McAdam S, Ogg G, Nowak MA, Giangrande P, Luzzi G, Morgan B, Edwards A, McMichael AJ, Row-land-Jones S.1997. Late escape from an immunodominant cytotoxic T-lymphocyte response associated with progression to AIDS. Nat Med
3:212–217.http://dx.doi.org/10.1038/nm0297-212.
9.Streeck H, Lu R, Beckwith N, Milazzo M, Liu M, Routy JP, Little S, Jessen H, Kelleher AD, Hecht F, Sekaly RP, Alter G, Heckerman D, Carrington M, Rosenberg ES, Altfeld M.2014. Emergence of individual HIV-specific CD8 T cell responses during primary HIV-1 infection can
determine long-term disease outcome. J Virol88:12793–12801.http://dx
.doi.org/10.1128/JVI.02016-14.
10. Hatano H, Delwart EL, Norris PJ, Lee TH, Dunn-Williams J, Hunt PW, Hoh R, Stramer SL, Linnen JM, McCune JM, Martin JN, Busch MP, Deeks SG. 2009. Evidence for persistent low-level viremia in individuals who control human immunodeficiency virus in the
ab-sence of antiretroviral therapy. J Virol83:329 –335.http://dx.doi.org
/10.1128/JVI.01763-08.
11. O’Connor DH, Mothe BR, Weinfurter JT, Fuenger S, Rehrauer WM, Jing P, Rudersdorf RR, Liebl ME, Krebs K, Vasquez J, Dodds E, Loffredo J, Martin S, McDermott AB, Allen TM, Wang C, Doxiadis GG, Montefiori DC, Hughes A, Burton DR, Allison DB, Wolinsky SM, Bontrop R, Picker LJ, Watkins DI.2003. Major histocompatibility com-plex class I alleles associated with slow simian immunodeficiency virus disease progression bind epitopes recognized by dominant acute-phase
cytotoxic-T-lymphocyte responses. J Virol77:9029 –9040.http://dx.doi
.org/10.1128/JVI.77.16.9029-9040.2003.
12. Allen TM, O’Connor DH, Jing P, Dzuris JL, Mothe BR, Vogel TU, Dunphy E, Liebl ME, Emerson C, Wilson N, Kunstman KJ, Wang X, Allison DB, Hughes AL, Desrosiers RC, Altman JD, Wolinsky SM, Sette A, Watkins DI.2000. Tat-specific cytotoxic T lymphocytes select for SIV
escape variants during resolution of primary viraemia. Nature407:386 –
390.http://dx.doi.org/10.1038/35030124.
13. Allen TM, Yu XG, Kalife ET, Reyor LL, Lichterfeld M, John M, Cheng M, Allgaier RL, Mui S, Frahm N, Alter G, Brown NV, Johnston MN, Rosenberg ES, Mallal SA, Brander C, Walker BD, Altfeld M.2005. De
novo generation of escape variant-specific CD8⫹T-cell responses
follow-ing cytotoxic T-lymphocyte escape in chronic human immunodeficiency
virus type 1 infection. J Virol79:12952–12960.http://dx.doi.org/10.1128
/JVI.79.20.12952-12960.2005.
14. Barber DL, Wherry EJ, Masopust D, Zhu B, Allison JP, Sharpe AH, Freeman GJ, Ahmed R.2006. Restoring function in exhausted CD8 T
cells during chronic viral infection. Nature439:682– 687.http://dx.doi
.org/10.1038/nature04444.
15. Blackburn SD, Shin H, Haining WN, Zou T, Workman CJ, Polley A, Betts MR, Freeman GJ, Vignali DA, Wherry EJ.2009. Coregulation
of CD8⫹ T cell exhaustion by multiple inhibitory receptors during
chronic viral infection. Nat Immunol10:29 –37.http://dx.doi.org/10
.1038/ni.1679.
16. Day CL, Kaufmann DE, Kiepiela P, Brown JA, Moodley ES, Reddy S, Mackey EW, Miller JD, Leslie AJ, DePierres C, Mncube Z, Du-raiswamy J, Zhu B, Eichbaum Q, Altfeld M, Wherry EJ, Coovadia HM, Goulder PJ, Klenerman P, Ahmed R, Freeman GJ, Walker BD.
2006. PD-1 expression on HIV-specific T cells is associated with T-cell
exhaustion and disease progression. Nature443:350 –354.http://dx
.doi.org/10.1038/nature05115.
17. Rolland M, Edlefsen PT, Larsen BB, Tovanabutra S, Sanders-Buell E,
Hertz T, deCamp AC, Carrico C, Menis S, Magaret CA, Ahmed H, Juraska M, Chen L, Konopa P, Nariya S, Stoddard JN, Wong K, Zhao H, Deng W, Maust BS, Bose M, Howell S, Bates A, Lazzaro M, O’Sullivan A, Lei E, Bradfield A, Ibitamuno G, Assawadarachai V, O’Connell RJ, deSouza MS, Nitayaphan S, Rerks-Ngarm S, Robb ML, McLellan JS, Georgiev I, Kwong PD, Carlson JM, Michael NL, Schief WR, Gilbert PB, Mullins JI, Kim JH.2012. Increased HIV-1 vaccine
efficacy against viruses with genetic signatures in Env V2. Nature490:417–
420.http://dx.doi.org/10.1038/nature11519.
18. Saez-Cirion A, Shin SY, Versmisse P, Barre-Sinoussi F, Pancino G.
2010. Ex vivo T cell-based HIV suppression assay to evaluate HIV-specific
CD8⫹T-cell responses. Nat Protoc 5:1033–1041.http://dx.doi.org/10
.1038/nprot.2010.73.
19. Streeck H, Kwon DS, Pyo A, Flanders M, Chevalier MF, Law K, Julg B, Trocha K, Jolin JS, Anahtar MN, Lian J, Toth I, Brumme Z, Chang JJ, Caron T, Rodig SJ, Milner DA, Jr, Piechoka-Trocha A, Kaufmann DE, Walker BD, Altfeld M.2011. Epithelial adhesion molecules can inhibit
HIV-1-specific CD8(⫹) T-cell functions. Blood117:5112–5122.http://dx
.doi.org/10.1182/blood-2010-12-321588.
20. Robb ML.2012. Viral dynamics and immune response in acute infec-tion and their impact on viral set-point. Abstr AIDS Vaccine 2012.
http://aidsvac.capitalreach.com/portal.
21. Douek DC, Picker LJ, Koup RA.2003. T cell dynamics in HIV-1
infec-tion. Annu Rev Immunol21:265–304.http://dx.doi.org/10.1146/annurev
.immunol.21.120601.141053.
22. Picker LJ, Reed-Inderbitzin EF, Hagen SI, Edgar JB, Hansen SG, Le-gasse A, Planer S, Piatak M, Jr, Lifson JD, Maino VC, Axthelm MK, Villinger F.2006. IL-15 induces CD4 effector memory T cell production
and tissue emigration in nonhuman primates. J Clin Investig116:1514 –
1524.http://dx.doi.org/10.1172/JCI27564.
23. Ferrari G, Korber B, Goonetilleke N, Liu MK, Turnbull EL, Salazar-Gonzalez JF, Hawkins N, Self S, Watson S, Betts MR, Gay C, McGhee K, Pellegrino P, Williams I, Tomaras GD, Haynes BF, Gray CM, Borrow P, Roederer M, McMichael AJ, Weinhold KJ.2011. Relationship between functional profile of HIV-1 specific CD8 T cells and epitope vari-ability with the selection of escape mutants in acute HIV-1 infection. PLoS
Pathog7:e1001273.http://dx.doi.org/10.1371/journal.ppat.1001273.
24. Goonetilleke N, Liu MK, Salazar-Gonzalez JF, Ferrari G, Giorgi E, Ganusov VV, Keele BF, Learn GH, Turnbull EL, Salazar MG, Weinhold KJ, Moore S, Letvin N, Haynes BF, Cohen MS, Hraber P, Bhattacharya T, Borrow P, Perelson AS, Hahn BH, Shaw GM, Korber BT, McMichael
AJ.2009. The first T cell response to transmitted/founder virus
contrib-utes to the control of acute viremia in HIV-1 infection. J Exp Med206:
1253–1272.http://dx.doi.org/10.1084/jem.20090365.
25. Trautmann A, Ruckert B, Schmid-Grendelmeier P, Niederer E, Brocker EB, Blaser K, Akdis CA.2003. Human CD8 T cells of the peripheral blood contain a low CD8 expressing cytotoxic/effector
sub-population. Immunology108:305–312.http://dx.doi.org/10.1046/j.13
65-2567.2003.01590.x.
26. Xu H, Wang X, Lackner AA, Veazey RS.2013. CD8 down-regulation and functional impairment of SIV-specific cytotoxic T lymphocytes in
lymphoid and mucosal tissues during SIV infection. J Leukoc Biol93:943–
950.http://dx.doi.org/10.1189/jlb.1112580.
27. Ouyang L, Li X, Liang Z, Yang D, Gong F, Shen G, Weng X, Wu X.
2013. CD8low T-cell subpopulation is increased in patients with chronic
hepatitis B virus infection. Mol Immunol56:698 –704.http://dx.doi.org
/10.1016/j.molimm.2013.07.003.
28. Favre D, Stoddart CA, Emu B, Hoh R, Martin JN, Hecht FM, Deeks SG, McCune JM.2011. HIV disease progression correlates with the generation
of dysfunctional naive CD8(low) T cells. Blood117:2189 –2199.http://dx
.doi.org/10.1182/blood-2010-06-288035.
29. Maggi E, Giudizi MG, Biagiotti R, Annunziato F, Manetti R, Piccinni MP, Parronchi P, Sampognaro S, Giannarini L, Zuccati G, Romagnani
S.1994. Th2-like CD8⫹T cells showing B cell helper function and reduced
cytolytic activity in human immunodeficiency virus type 1 infection. J Exp
Med180:489 – 495.http://dx.doi.org/10.1084/jem.180.2.489.
30. Wiesel M, Oxenius A. 2012. From crucial to negligible: functional
CD8(⫹) T-cell responses and their dependence on CD4(⫹) T-cell help.
Eur J Immunol42:1080 –1088.http://dx.doi.org/10.1002/eji.201142205.
31. Sun JC, Bevan MJ.2003. Defective CD8 T cell memory following acute
infection without CD4 T cell help. Science300:339 –342.http://dx.doi.org
/10.1126/science.1083317.
BD, Griffith TS, Green DR, Schoenberger SP.2005. CD4⫹T-cell help
controls CD8⫹T-cell memory via TRAIL-mediated activation-induced
cell death. Nature434:88 –93.http://dx.doi.org/10.1038/nature03337.
33. Olson AD, Guiguet M, Zangerle R, Gill J, Perez-Hoyos S, Lodi S, Ghosn J, Dorrucci M, Johnson A, Sannes M, Moreno S, Porter K.
2014. Evaluation of rapid progressors in HIV infection as an extreme
phenotype. J Acquir Immune Defic Syndrhttp://dx.doi.org/10.1097
/QAI.0000000000000240.
34. Ochsenbein AF, Riddell SR, Brown M, Corey L, Baerlocher GM, Lans-dorp PM, Greenberg PD.2004. CD27 expression promotes long-term
survival of functional effector-memory CD8⫹cytotoxic T lymphocytes in
HIV-infected patients. J Exp Med200:1407–1417.http://dx.doi.org/10
.1084/jem.20040717.
35. Matter MS, Claus C, Ochsenbein AF.2008. CD4⫹T cell help improves
CD8⫹T cell memory by retained CD27 expression. Eur J Immunol38:
1847–1856.http://dx.doi.org/10.1002/eji.200737824.
36. Saez-Cirion A, Bacchus C, Hocqueloux L, Avettand-Fenoel V, Gi-rault I, Lecuroux C, Potard V, Versmisse P, Melard A, Prazuck T, Descours B, Guergnon J, Viard JP, Boufassa F, Lambotte O, Goujard C, Meyer L, Costagliola D, Venet A, Pancino G, Autran B, Rouzioux
C.2013. Post-treatment HIV-1 controllers with a long-term
virologi-cal remission after the interruption of early initiated antiretroviral
therapy ANRS VISCONTI study. PLoS Pathog9:e1003211.http://dx
.doi.org/10.1371/journal.ppat.1003211.
37. Lecuroux C, Girault I, Cheret A, Versmisse P, Nembot G, Meyer L, Rouzioux C, Pancino G, Venet A, Saez-Cirion A.2013. CD8 T-cells from most HIV-infected patients lack ex vivo HIV-suppressive capacity during
acute and early infection. PLoS One8:e59767.http://dx.doi.org/10.1371
/journal.pone.0059767.
38. Jain V, Hartogensis W, Bacchetti P, Hunt PW, Hatano H, Sinclair E, Epling L, Lee TH, Busch MP, McCune JM, Pilcher CD, Hecht FM, Deeks SG.2013. Antiretroviral therapy initiated within 6 months of HIV infection is associated with lower T-cell activation and smaller
HIV reservoir size. J Infect Dis208:1202–1211.http://dx.doi.org/10
.1093/infdis/jit311.
39. Oxenius A, Price DA, Easterbrook PJ, O’Callaghan CA, Kelleher AD, Whelan JA, Sontag G, Sewell AK, Phillips RE.2000. Early highly active antiretroviral therapy for acute HIV-1 infection preserves immune
func-tion of CD8⫹and CD4⫹T lymphocytes. Proc Natl Acad Sci U S A97: