BIOPHYSICS
AND
COMPUTATIONAL
BIOLOGY
Single-stranded nucleic acid elasticity arises from
internal electrostatic tension
David R. Jacobsona, Dustin B. McIntosha, Mark J. Stevensb, Michael Rubinsteinc, and Omar A. Salehd,1
aDepartment of Physics, University of California, Santa Barbara, CA 93106;bCenter for Integrated Nanotechnologies, Sandia National Laboratories,
Albuquerque, NM 87185;cDepartment of Chemistry, University of North Carolina, Chapel Hill, NC 27599; anddMaterials Department and Biomolecular
Science and Engineering Program, University of California, Santa Barbara, CA 93016
Edited by David A. Weitz, Harvard University, Cambridge, MA, and approved April 10, 2017 (received for review January 20, 2017)
Understanding of the conformational ensemble of flexible poly-electrolytes, such as single-stranded nucleic acids (ssNAs), is complicated by the interplay of chain backbone entropy and salt-dependent electrostatic repulsions. Molecular elasticity measure-ments are sensitive probes of the statistical conformation of poly-mers and have elucidated ssNA conformation at low force, where electrostatic repulsion leads to a strong excluded volume effect, and at high force, where details of the backbone structure become important. Here, we report measurements of ssDNA and ssRNA elasticity in the intermediate-force regime, corresponding to 5- to 100-pN forces and 50–85% extension. These data are explained by a modified wormlike chain model incorporating an internal electrostatic tension. Fits to the elastic data show that the inter-nal tension decreases with salt, from>5 pN under 5 mM ionic strength to near zero at 1 M. This decrease is quantitatively described by an analytical model of electrostatic screening that ascribes to the polymer an effective charge density that is inde-pendent of force and salt. Our results thus connect microscopic chain physics to elasticity and structure at intermediate scales and provide a framework for understanding flexible polyelectrolyte elasticity across a broad range of relative extensions.
single-stranded nucleic acids|flexible polyelectrolytes| force spectroscopy|electrostatics
S
ingle-stranded nucleic acids (ssNAs) occur in many biologi-cal processes, such as RNA folding (1, 2) and DNA replica-tion (3–5), generally in disordered conformareplica-tions that fluctuate between various structures. These fluctuations create a signifi-cant entropic elasticity; thus, direct measurements of molecular elasticity (extension,X, as a function of applied force,fapp) con-stitute a powerful tool for studying the ssNA structural ensemble (6). In particular, measurements at a particularfapp are sensi-tive to the conformation within the corresponding tensile length,kBT/fapp(to within a scaling factor), wherekBTis the thermal energy (7).
ssNA structure—and that of flexible polyelectrolytes more generally—is complicated by the strong negative charge of the molecule. Multiple electrostatic and structural length scales share a similar magnitude (roughly 1 nm), disallowing models that consider only electrostatics or only backbone structure. In an uncharged flexible chain, the key structural scale is the per-sistence length,lp, defining the distance beyond which thermal fluctuations strongly bend the polymer. Electrostatic interac-tions introduce several competing length scales: the distance,b, between charged phosphates along the ssNA backbone; the dis-tance over which electrostatic fields are screened in salty solution (the Debye length,κ−1); and the distance at which interactions between elementary charges in water have energykBT(the Bjer-rum length,lB).
Prior studies have elucidated ssNA elastic behavior in the low-and high-force limits. At low forces, corresponding to tensile lengths larger than κ−1 (i.e.,fapp.kBT/κ−1), ssNAs exhibit an elastic response with self-avoiding (Pincus) scaling,X∼f2/3
(7–10). Pincus elasticity is also shown by neutral polymers; for
ssNAs it depends on electrostatically determined excluded vol-ume parameters. At high force, corresponding to tensile lengths smaller than the chemical bond length, electrostatic effects become negligible and again similar behavior is seen as in un-charged polymers (11–16).
There are no similar results, grounded in the microscopic physics of the system and verified by experiments, for the intermediate-force regime in which the local chain behavior transitions from being dominated by electrostatics to backbone structure. Because of this transition, it is only at intermedi-ate forces that charged-chain elasticity will always deviintermedi-ate from neutral-chain elasticity; thus, quantification of the intermedi-ate regime is of particular importance to understanding poly-electrolyte behavior. Intermediate elasticity has been previously explained with models incorporating an electrostatics-dependent persistence length (17–19). Some experimental agreement has been seen with these models (20, 21), but only for studies at a single salt concentration and only when invoking a strongly salt-dependent charge density (22).
In this article, we use magnetic tweezers single-molecule force spectroscopy (23) to comprehensively measure the elasticity of ssDNA and ssRNA over the domains of 5–100 pN applied force (corresponding to 50–85% relative extension) and 1–1,000 mM ionic strength. We then introduce a model that uses an internal electrostatic tension to capture the observed behavior. Finally, we combine this result with the existing knowledge at lower and higher forces to furnish a comprehensive picture of ssNA elasticity—and therefore statistical conformation—over all acces-sible forces.
Significance
Charged, flexible polymers, such as single-stranded nucleic acids (ssNAs), are ubiquitous in biology and technology. Quantitative description of their solution conformation has remained elusive due to the competing effects of polymer configurational freedom and salt-screened electrostatic repul-sion between monomers. We investigate this by measuring the elastic response of single ssNA molecules over a range of salt concentrations. The data are well described by a model, inspired by a mean-field approach, in which intrapolymer elec-trostatic repulsion creates a salt-dependent internal tension whose interplay with the external force determines the elas-ticity. The internal tension can be related to the polymer’s charge spacing; thus, our results show how mesoscopic poly-mer conformation epoly-merges from microscopic structure.
Author contributions: D.R.J., D.B.M., M.J.S., M.R., and O.A.S. designed research; D.R.J. and D.B.M. performed research; D.R.J., D.B.M., and O.A.S. analyzed data; and D.R.J., M.J.S., M.R., and O.A.S. wrote the paper.
The authors declare no conflict of interest. This article is a PNAS Direct Submission.
1To whom correspondence should be addressed. Email: [email protected].
Results
Elasticity Measurements.The elasticity of 1–6 µm intrinsically single-stranded NAs was measured using magnetic tweezers (23, 24), in which the molecule is attached, at one end, to the sub-strate and, at the other end, to a paramagnetic bead. A magnetic-field gradient exerts a force on the bead, and the resulting molec-ular extension is measured.
The chemical means used to synthesize the ssNAs (
Materi-als and Methods) yield polydisperse samples, meaning that the
chain contour length,Lc, varies from chain to chain. This typi-cally requires leavingLc as a free parameter in subsequent fit-ting; the added fitting parameter weakens the statistical signif-icance of the results. Here, we avoid this problem by collecting data on the same molecule across a broad range of ionic strength,
I; thus, theLcparameter can be constrained and fitted globally across all of the curves.
Force-Extension Model. We model the ionic strength-dependent
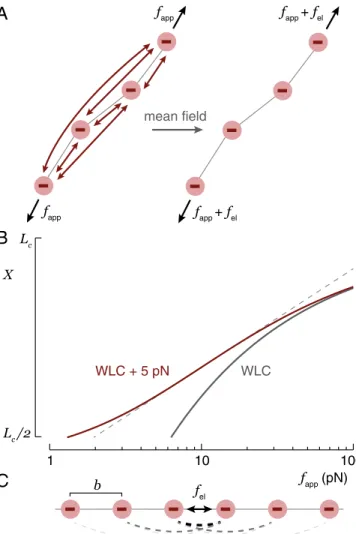
force-extension data by representing the pairwise repulsive inter-actions between charged monomers along the thermally fluctuat-ing chain as a sfluctuat-ingle internal electrostatic tension,fel(Fig. 1A), an approach inspired by the Weiss molecular field theory of ferro-magnetism (25). This internalfelcorresponds to an electrostatic blob sizekBT/fel(26). For forces higher than the upper bound-ary of the excluded volume regime (fapp&kBT/κ−1) (27), the electrostatic blobs become aligned andfelacts along the length of the chain. At yet higher forces (fapp&fel), the tensile length of the applied force becomes smaller than the electrostatic blob size and electrostatic effects become less significant. We model the elastic behavior in the electrostatics-dominated intermediate-force regime by making the substitutionf→fapp+felin the high-force (i.e.,X>Lc/2) expression for wormlike chain (WLC) elas-ticity (28) to obtain
X =Lc 1−
s
kBT
4lp(fapp+fel)
!
, [1]
wherelpis the bare (i.e., nonelectrostatic) persistence length. In other words, we subsume all electrostatics intofel and assume thatlprepresents only nonelectrostatic sources of stiffness, effec-tively balancing electrostatic and applied tension against neutral-chain entropic elasticity. This assumption is checked below.
An example of the effect of addingfel= 5pN to WLC elasticity is shown in Fig. 1B, in which the force-extension curve shifts to higher extension and a domain ofX∼log(f)scaling is observed. Note that this plot is limited toX>Lc/2, the high-force domain of the WLC elasticity. Notwithstanding this limit, we expect the behavior modeled by Eq.1 to extend from, at low force, the crossover to the excluded volume regime (fapp∼kBT/κ−1) (27) to, at high force, the transition from WLC to freely jointed chain (FJC) behavior (fapp∼kBTlp/a2, whereais the chemical bond
length) (14).
Internal electrostatic tension has been invoked in prior stud-ies to explain aspects of charged polymer behavior. This includes theoretical work on polyelectrolyte brush behavior (27), as well as work on electrostatic modulation of DNA structural transi-tions: the double-stranded DNA overstretching transition (29) and the base unstacking transition of poly(dA) ssDNA (30). Here, we extend the approach by carefully analyzing the balance of electrostatic tension against entropic elasticity, a universal fea-ture of polymer behavior. A further advantage of the present approach is that it permits direct, high-resolution experimental quantification of the salt-dependent tension.
We use a continuous-WLC model to treat a system that is, physically, composed of discrete chemical bond units. The parameterlp is thus an effective persistence length. The formal
fel
1 10 100
Lc
Lc /2
WLC WLC + 5 pN
X
fapp (pN)
fapp
fapp
fapp + fel
fapp + fel
mean field
b
A
B
C
Fig. 1. (A) If a polyelectrolyte is stretched, the applied force,fapp, acts uni-formly along the contour of the chain. In an approximation inspired by mean-field theories, the Coulomb repulsion between charges can be simi-larly treated as a uniform tension,fel. (B) Introduction of 5 pN electrostatic tension to Eq.1shifts the high-force WLC curve (lp=0.6 nm) to larger
exten-sion. A domain ofX∼log(f) scaling (dashed line) emerges. (C) The electro-static tension can be explicitly estimated by summing all screened Coulomb forces across a particular bond in the straight-chain configuration.
definition oflprequires an exponential decay in the correlation between chain tangent vectors with separation; in contrast, sim-ulations indicate that charged, flexible chains exhibit a power-law decay of tangent vector correlations for small separations (31). Nonetheless, the WLC model has been shown empirically to describe high-salt (i.e., fully screened) ssNA elasticity data (9, 10).
The high-force transition from WLC to FJC behavior occurs due to the discrete nature of backbone bonds (11–14). Based on the arguments of Dobrynin et al. (14), and on fitting the WLC– FJC interpolation function of those authors to our data, we con-clude that this transition occurs at a force just above those we probed. As such, our data do not have the power to constrain the extra fitting parameter,a, that would be needed to implement that model.
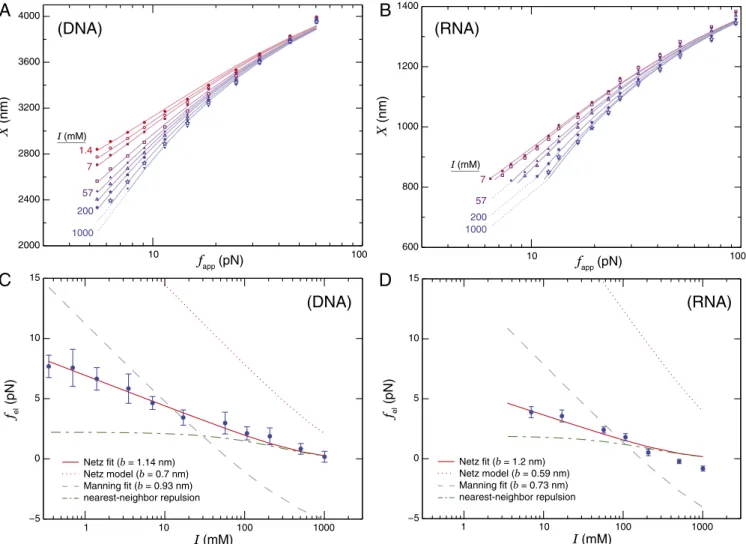
Fits of Eq.1to representative data are shown in Fig. 2Aand B. Because data for each molecule were collected across a broad range ofI, we were able to constrainLcandlp globally across all curves and fitted onlyfelon a per-curve basis. In this way,N
BIOPHYSICS
AND
COMPUTATIONAL
BIOLOGY
X
(nm)
fapp(pN)
I (mM) fel
(pN)
10 100
2000 2400 2800 3200 3600 4000
1 10 100 1000
−5 0 5 10 15
I (mM)
1.4
7
57
200
1000
Netz fit (b = 1.14 nm) Netz model (b = 0.7 nm) Manning fit (b = 0.93 nm) nearest-neighbor repulsion
X
(nm)
fapp(pN)
I (mM) fel
(pN)
10 100
600 800 1000 1200 1400
I (mM)
7
57
200 1000
1 10 100 1000
−5 0 5 10 15
Netz fit (b = 1.2 nm) Netz model (b = 0.59 nm) Manning fit (b = 0.73 nm) nearest-neighbor repulsion
(RNA)
(DNA)
(DNA)
(RNA)
A
C
D
B
Fig. 2. (AandB) Force-extension curves of a representative (A) ssDNA molecule overI=1.4–1,000 mM and (B) ssRNA molecule overI=7–1,000 mM. The curves are fitted to Eq.1, with a differentfelvalue for each curve andLcandlpfitted globally across all of the curves for a particular molecule. We do
not assume a model offelin the fitting. (CandD) Resulting values offel, combined across molecules, are plotted againstIand are well fitted by the Netz model of electrostatic tension (Eq.2) withI-independentb. Error bars are standard errors of the mean. (C) DNA data are best fitted with effective charge spacingb=1.14±0.05 nm (solid line), compared with the result for the 0.7-nm structural charge spacing (dotted line). (D) RNA data are best fitted by b=1.2±0.3 nm, vs. 0.59 nm structural spacing. In both cases, the dashed line is the result of fitting the Manning model (32) (with best-fit charge spacing noted), whereas the dashed-dotted line is the Debye–H ¨uckel force between a single pair of charges spaced by thebvalue given from Netz model fitting.
For ssDNA, there is an∼2% disagreement between the data and the fit at the highest force value. This likely arises from both the 8.4-nN stretch modulus of ssDNA (16) (accounting for half of the discrepancy) and the WLC–FJC transition (11–14), neither of which are included in our fitting. A similar disagreement in some RNA molecules (SI Appendix, Fig. S1) likely also includes the effect of the sugar pucker transition discussed below.
Electrostatic Tension. The values offel(I)obtained from fitting Eq.1to our data are shown, averaged across all molecules of a given species, in Fig. 2CandD. As expected,feldecreases as a function ofI, consistent with greater charge screening at higher salt concentrations. We compared thefel(I)data to two analyt-ical models of polyelectrolyte electrostatic tension. Both mod-els consider the pairwise interactions between all charges along the chain (Fig. 1C), modulated by the effects of screening by salt ions. One model is that of Netz (29), which considers a straight chain of charges that interact in the Debye–H¨uckel (DH) limit through Yukawa potentials,∼e−κr/r; this predicts
fel=kBTlB
b2
κb e −κb
1−e−κb −ln
1−e−κb
. [2]
The other model is that of Manning (32), which builds upon Eq.
2by explicitly accounting for counterion condensation (33–35). Both models were fitted to the data with only a single free parameter: the effective charge spacing, b. This need to use effective charge densities arises from the quantitative failure of the DH assumption underlying the models. The Netz model is able to fit both our DNA and RNA data with quantitative pre-cision, whereas the Manning model disagrees qualitatively. Fit-ting to the Netz model returns effective charge spacings (ssDNA,
b= 1.14±0.05 nm; ssRNA, b= 1.2±0.3 nm) notably larger than the structural charge spacings of elongated ssDNA (0.7 nm) and ssRNA (0.59 nm) (36). For comparison, Fig. 2 C and D also shows the Netz model evaluated with these structural sep-arations, which differ between species due to sugar pucker; the disagreement with the data is apparent.
Three-Parameter Global Fit. Using the Netz model of electrostatic tension (Eq.2) to specifyfelin our elastic model (Eq.1), we can describe a full, ionic strength-dependent elastic dataset using just three global fit parameters:Lc,lp, andb. Such fits are of similar quality to those of Fig. 2AandB. Sample global fits are given inSI Appendix, Fig. S2, as are comparable fits to models based on an electrostatics-dependent persistence length (SI Appendix, Figs. S3 and S4). Parameter values from global fits were com-bined across all three DNA and five RNA molecules studied and are listed in Table 1;Lcvalues were not combined, as they varied between molecules.
Discussion
Magnitude of Effective Charge Spacing. The empirical values ofb
obtained from our analysis (Table 1) are similar for ssDNA and ssRNA and are larger than the values expected based on the structural charge separation of the stretched chain. Anomalously large values ofbwere also seen in prior studies when Eq.2was applied to the ssDNA unstacking transition (30).
In both cases, these large b values mean that electrostatic repulsion is weaker than expected, an effect that likely arises from the failure of the DH approximation underlying Eq.2. The DH model assumes that macro-ion charge is equally offset by cation attraction and anion exclusion, i.e., that the local ionic strength near the NA is equal to the bulk value (37). However, it is known that, for highly charged chains such as ssNAs,Iis signif-icantly elevated close to the chain compared with the bulk due to preferential attraction of cations (38). For example, locally ele-vated ionic strength is seen in recent experiments (39) that show roughly 0.4 more ions per nucleotide in the ssNA ion atmosphere compared with the DH prediction, a result that decreases only very slowly with bulkI. This elevated ionic strength will more strongly screen electrostatic interactions than the DH prediction; thus, enforcing DH leads to an effectivebvalue larger than the structural spacing, as we see in our fits.
Further complications to the interpretation of b could arise from the effective local dielectric constant,, in the vicinity of the chain and from related hydration effects. Becausefelarises from repulsion between backbone charges, the value ofvery close to the ssNA axis becomes important. The molecular dynam-ics simulations of Young et al. (40) indicate thatinterpolates between unity and bulk water values over the span of∼1 nm in the vicinity of dsDNA; a similar interpolation likely occurs in the vicinity of the ssNAs. A lower local would have two opposing effects on the electrostatic tension. First, it would lead to increased interaction with cations and non-DH screening via counterion condensation (33–35), i.e., the augmented local ionic strength discussed above, leading to smaller-than-expectedfel. Second, a lowerwould also lead to stronger Coulomb repul-sion between charges and a larger than expectedfel. Quantita-tive modeling of these effects would need to account for the detailed shape, hydration, and dielectric environment of the molecule.
Salt Independence of Effective Charge Spacing. The good quality
of the fit of the Netz model tofel(I)implies that the effective
Table 1. Fit parameters from global fitting of effective charge spacing,b, bare persistence length,lp, and contour length,
Lc, to each molecule using Eq. 1 withfelgiven by Eq. 2
Species b, nm lp, nm ssDNA 1.16±0.03 0.55±0.04 ssRNA 1.12±0.04 0.41±0.04
Values were averaged across three DNA and five RNA molecules studied. Uncertainties are standard errors of the mean.
charge density is independent of ionic strength, even though we posit that these effective values arise from the behavior of the local ionic strength in the vicinity of the chain. This is consis-tent with the weak salt concentration dependence of the ssNA ion atmosphere stoichiometry (39), indicating the persistence of non-DH screening over a broad domain ofI. Put another way, the salt independence ofb is consistent with the result that the exact predictions of counterion condensation theory break down only very gradually as nonnegligible ion concentrations are intro-duced (41).
Our empirical finding that b does not depend on I directly contradicts prior modeling of high-force ssNA elasticity (20, 21) based upon an electrostatics-dependent persistence length (17– 19). Such models relied upon a highly salt-dependent charge den-sity (22) inappropriately obtained from an effective-charge DH model (42–45) valid only in the far field and not suitable for treating interactions between neighboring charges. This charge density was seemingly validated through experiments (20, 21), but those studies were not conducted over a broad range ofI
and thus were not well suited to critically test salt-dependent effects. In SI Appendix, Fig. S4, we fit a WLC model incor-porating an electrostatics-dependent persistence length derived from the charge density of Zhang et al. (22) (SI Appendix, sec-tion S1) to our broadly salt-dependent data and find very poor agreement.
Force Independence of Effective Charge Spacing. It might be
ex-pected that the effective charge spacing would increase with increasing force, as the chain is extended along the pulling axis. However, our model is able to fit the data using a force-independentb. This could be attributed to counterion condensa-tion theory (33–35), which predicts that monovalent cacondensa-tions will accumulate in the vicinity of a chain withb<lB to reduce the effective charge spacing tolB(0.7 nm in room temperature bulk water). As a highly charged chain is stretched, the bare charge spacing along the pulling axis increases, and fewer condensed counterions would be needed to maintain a constant effective charge spacing. We can test this charge-regulation picture by counting the released counterions,Γ; this counting is enabled by thermodynamic theory linking pairs of conjugate variables, here
(f,X)and(Γ,I)(46–48). The analysis (SI Appendix, section S2) indicates that a significant number of condensed ions are indeed released, but the effect is not sufficient to holdbconstant. For example, atI= 1mM, we find that stretching from 0.4 pN to 100 pN releases 0.07 ions per nucleotide, less than the release of ≈0.37ions per nucleotide expected from simple application of condensation theory.
Several other effects could work in concert with condensation to maintain a constant effectivebvs.f. One is that our approach is not equally sensitive across all values off. In particular, note in Fig. 1Bthat the addition offel (corresponding to a particu-larbthrough Eq.2) leads to a large elastic effect at low force, but has little effect at high force, relative to conventional WLC elasticity. Hence, it is the fit at low force that predominantly con-strainsb, rendering the experiment insensitive to potential high-force variation ofb; thus, the observedbvalues are largely due to the low-force configuration. An alternative explanation is moti-vated by considering undulations in the chain, which increase at lower forces. Such undulations could maintain a constant effec-tiveb through the cancellation of two competing effects. First, increased undulations bring backbone charges closer together, increasing repulsive forces. Second, the undulations create lat-eral displacements of ions that misalign the repulsive forces from the pulling axis, leading to an actual internal tension that is less than that estimated in the calculation of Eq.2.
Recovery of Bare Persistence Length. The fittedlp of ssDNA is
BIOPHYSICS
AND
COMPUTATIONAL
BIOLOGY
measurements of single-molecule elasticity at low force (0.1– 10 pN) in apparent theta conditions of the solvent, particu-larly a high-salt concentration where electrostatic interactions become negligible and the elastic response is that of an ideal chain (9). This agreement validates the basic premise of our model: that the salt-dependent electrostatic interactions are con-tained only infel and thatlp should take on its bare, salt-inde-pendent value.
The ssRNA persistence length, however, is considerably lower than the 0.83±0.05-nm value previously reported in similar apparent-theta conditions (10). We investigated this effect by collecting ssRNA data over a wider force range (0.7–60 pN) at the previously identified high-salt condition (IΘ= 4M). We find that fitting the data with the Marko–Siggia WLC interpolation formula (28) at high force (10–60 pN) giveslp = 0.43nm, simi-lar to the result in Table 1. However, fitting at lower forces (0.7– 10 pN) recovers a value of 0.85 nm, in agreement with the prior literature (10). Thus, we see that fitting Eq.1to our data does recover the bare persistence length, in keeping with our assump-tion that onlyfel is electrostatics dependent, but that the bare persistence length itself is force dependent in a way that that of ssDNA is not. This may arise from the C30-endoto C20-endo sugar pucker isomerization, or another structural transition, in ssRNA (49, 50). Regardless of its origin, this effect introduces a complication into the analysis of the ssRNA data that is not present in the ssDNA and that may explain the negative values offelseen at largeI in Fig. 2.
Conclusion
We have introduced a model of flexible polyelectrolyte elastic-ity in the intermediate-force domain that exploits the concept of internal electrostatic tension,fel. The model is validated through its ability to reproduce experimental ssDNA and ssRNA force-extension data across a broad range of salt concentrations. Fur-ther, the internal tension can be quantified from a microscopic viewpoint, resulting in salt-dependent elasticity predictions that depend on just two structural parameters:lp, which sets the con-tribution of configurational entropy to elasticity, andb, which determines the magnitude offel. The model is written as a simple, closed-form expression (Eq.1) and the resulting values offelcan be directly compared with the forces involved in other molecular processes.
The internal-tension model also naturally accounts for the transitions in polyelectrolyte elasticity through the interplay of
fel andfapp. The present results, particularly the elastic model given by Eq.1, define the structure and elasticity in the interme-diate regime,kBT/κ−1.fapp.fel. This is the regime flanked, at lower applied force, by a self-avoidance regime where confor-mation and elasticity are dominated by electrostatically defined chain parameters, and at higher applied force, by a regime sen-sitive to structural details other than the presence and spacing of charges. Indeed, prior work on NA elasticity corroborates and quantifies this view: Measurements with sub-picoNewton applied forces (8, 10) revealed swollen-chain elasticity,X∼f2/3(7), that was attributed to electrostatically controlled excluded-volume interactions. High-force ssNA elasticity has been explained by nonelectrostatic details of the chain; particularly, Dobrynin et al. (14) showed that ssNA’s moderate-force WLC behavior will transition, around 60 pN, to FJC elasticity due to the discrete nature of bonds along the backbone, whereas Hugel et al. (16) found that this FJC elasticity will eventually be dominated by enthalpic stretching of backbone bonds for forces beyond a few hundred picoNewtons.
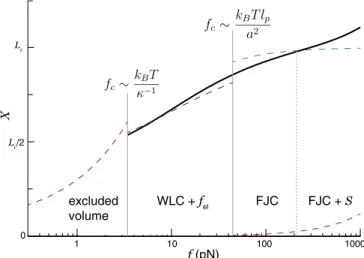
A multiregime polyelectrolyte elasticity model can be created by combining the present work with other polymer elasticity regimes. This is done in Fig. 3, where we plot the Dobrynin et al. WLC–FJC transition model (14), modified by adding
1 10 100 1000
0 Lc
Lc/2
X
f (pN) excluded
volume
WLC + fel FJC FJC + S
Fig. 3. The WLC model with internal electrostatic tension (WLC +fel) con-nects the lower-force swollen-chain elastic regime, with electrostatically dominated excluded volume, to the higher-force regime dominated by the nonelectrostatic structure of the chemical backbone. Dashed lines denote the expected scaling in the different force regimes (separated by different crossover forces,fc):X∼f2/3excluded volume scaling (red), WLC withfel
(Eq.1) (blue), FJC (green), and an additional contribution from the stretch modulusS=8.4 nN (16) (magenta). For clarity, the expected lowest-force linear response regime is not shown. The solid line is the elastic model of Dobrynin et al. (14), modified to account for electrostatic tension andS(SI
Appendix, section S3). A broad domain of quasi-logarithmic scaling arises
from the interpolation between the excluded volume,fel-modified WLC, FJC, and enthalpic stretching regimes.
an internal electrostatic tension as in Eq. 1 and by including an enthalpic stretching term (SI Appendix, section S3). The result is a single analytical model that describes elastic behav-ior over two decades of force and depends on four inten-sive chain parameters: persistence length, charge spacing (or, equivalently, electrostatic tension), bond length (controlling the WLC–FJC transition), and stretch modulus. Extending this line to the swollen-chain regime would add an intensive parame-ter (the salt-dependent excluded volume) and would require an analytical model of swollen-chain elasticity beyond the level of a scaling theory; we are unaware of such a model. The multiregime model shows a slow, near-logarithmic increase in extension over multiple decades in force, in agreement with prior experimental observations (20, 51). Thus, we find that the mean-field–inspired electrostatic tension model introduced here permits a comprehensive view of flexible polyelectrolyte elasticity.
Materials and Methods
ssNA Samples. We studied the elasticity of 1- to 6-µm ssNAs with se-quences rendering them intrinsically single stranded [the eighth polypyrim-idine sequence of Brockman et al. (52) for DNA and poly(U) for RNA]. DNA was synthesized, as in McIntosh et al. (30), by rolling-circle amplification (53) with a 50biotin-labeled primer for bead attachment; the glass substrate
attachment was by nonspecific adhesion. RNA was synthesized, as in Jacob-son et al. (10), by elongation of a 50thiol-labeled primer (for attachment to maleimide-functionalized substrate), using polynucleotide phosphorylase (54); a 30biotin label (bead attachment) was added using terminal
deoxynu-cleotidyl transferase.
and, in turn, on the molecule. Molecular extension was measured by moni-toring the diffraction ring pattern cast by the bead (24);fappwas calibrated by computing the Allan variance of the bead’s horizontal fluctuations and fitting to a model function (55). Force-extension curves for each individual molecule studied were collected over a range of solution ionic strength (0.1– 1,000 mM for DNA and 7–1,000 mM for RNA). ForI>7 mM, solutions were prepared by adding NaCl to a background of 10 mM Tris buffer at pH 7.5 (10 mM of this buffer corresponds to a 7-mM ionic strength). ForI<7 mM, the ionic strength was set by reducing the buffer concentration. Measure-ments of ssDNA were replicated in three different molecules; those of ssRNA were replicated in five molecules.
ACKNOWLEDGMENTS.We thank Philip Pincus for helpful discussions. This work was supported by the National Science Foundation (NSF) under Grant DMR-1309414. D.R.J. was supported by an NSF graduate research fellowship, DGE-1144085. M.R. acknowledges financial support from the NSF under Grants DMR-1309892, DMR-1436201, and DMR-1121107; from the National Institutes of Health under Grants P01-HL108808 and 1UH2HL123645; and from the Cystic Fibrosis Foundation. Portions of this work were done at the Center for Integrated Nanotechnologies, an Office of Science User Facil-ity operated for the US Department of Energy Office of Science. Sandia National Laboratories is a multiprogram laboratory managed and oper-ated by Sandia Corporation, a wholly owned subsidiary of Lockheed Martin Corporation, for the US Department of Energy’s National Nuclear Security Administration under Contract DE-AC04-94AL85000.
1. Doherty EA, Doudna JA (2001) Ribozyme structures and mechanisms.Annu Rev Bio-phys Biomol Struct30:457–475.
2. Garst AD, Edwards AL, Batey RT (2011) Riboswitches: Structures and mechanisms.Cold Spring Harb Perspect Biol3:a003533.
3. Bochkarev A, Pfuetzner RA, Edwards AM, Frappier L (1997) Structure of the single-stranded-DNA-binding domain of replication protein A bound to DNA. Nature
385:176–181.
4. Roe JH, Burgess RR, Record MT (1984) Kinetics and mechanism of the interaction of Escherichia coli RNA polymerase with theλP R promoter.J Mol Biol176:495–522. 5. Kozlov AG, Lohman TM (1998) Calorimetric studies of E. coli SSB
protein-single-stranded DNA interactions. Effects of monovalent salts on binding enthalpy.J Mol Biol278:999–1014.
6. Camunas-Soler J, Ribezzi-Crivellari M, Ritort F (2016) Elastic properties of nucleic acids by single-molecule force spectroscopy.Annu Rev Biophys45:65–84.
7. Pincus P (1976) Excluded volume effects and stretched polymer chains. Macro-molecules9:386–388.
8. Saleh O, McIntosh D, Pincus P, Ribeck N (2009) Nonlinear low-force elasticity of single-stranded DNA molecules.Phys Rev Lett102:068301.
9. McIntosh D, Saleh O (2011) Salt species-dependent electrostatic effects on ssDNA elas-ticity.Macromolecules44:2328–2333.
10. Jacobson DR, McIntosh DB, Saleh OA (2013) The snakelike chain character of unstruc-tured RNA.Biophys J105:2569–2576.
11. Rosa A, Hoang T, Marenduzzo D, Maritan A (2003) Elasticity of semiflexible polymers with and without self-interactions.Macromolecules36:10095–10102.
12. Livadaru L, Netz R, Kreuzer H (2003) Stretching response of discrete semiflexible poly-mers.Macromolecules36:3732–3744.
13. Toan NM, Thirumalai D (2010) Theory of biopolymer stretching at high forces. Macro-molecules43:4394–4400.
14. Dobrynin AV, Carrillo JMY, Rubinstein M (2010) Chains are more flexible under ten-sion.Macromolecules43:9181–9190.
15. Smith SB, Cui Y, Bustamente C (1996) Overstretching B-DNA: The elastic response of individual double-stranded and single-stranded DNA molecules.Science271:795–799. 16. Hugel T, Rief M, Seitz M, Gaub HE, Netz RR (2005) Highly stretched single poly-mers: Atomic-force-microscope experiments versus ab-initio theory.Phys Rev Lett
94:048301.
17. Odijk T (1977) Polyelectrolytes near the rod limit.J Polym Sci Pol Phys15:477–483. 18. Skolnick J, Fixman M (1977) Electrostatic persistence length of a wormlike
polyelec-trolyte.Macromolecules10:944–948.
19. Barrat JL, Joanny JF (1993) Persistence length of polyelectrolyte chains.Europhys Lett
24:333–338.
20. Dessinges MN, et al. (2002) Stretching single stranded DNA, a model polyelectrolyte.
Phys Rev Lett89:248102.
21. Seol Y, Skinner GM, Visscher K (2004) Elastic properties of a single-stranded charged homopolymeric ribonucleotide.Phys Rev Lett93:118102.
22. Zhang Y, Zhou H, Ou-Yang ZC (2001) Stretching single-stranded DNA: Interplay of electrostatic, base-pairing, and base-pair stacking interactions.Biophys J81:1133– 1143.
23. De Vlaminck I, Dekker C (2012) Recent advances in magnetic tweezers.Annu Rev Biophys41:453–472.
24. Ribeck N, Saleh OA (2008) Multiplexed single-molecule measurements with magnetic tweezers.Rev Sci Instrum79:094301.
25. Weiss P (1907) The hypothesis of the molecular field and the ferromagnetic property.
J Phys Theor Appl6:661–690.
26. de Gennes PG, Pincus P, Velasco RM, Brochard F (1976) Remarks on polyelectrolyte conformation.J Phys Theor Appl37:1461–1473.
27. Zhulina EB, Rubinstein M (2012) Ionic strength dependence of polyelectrolyte brush thickness.Soft Matter8:9376–9383.
28. Marko J, Siggia E (1995) Stretching DNA.Macromolecules28:8759–8770.
29. Netz RR (2001) Strongly stretched semiflexible extensible polyelectrolytes and DNA.
Macromolecules34:7522–7529.
30. McIntosh DB, Duggan G, Gouil Q, Saleh OA (2014) Sequence-dependent elasticity and electrostatics of single-stranded DNA: Signatures of base-stacking.Biophys J106: 659–666.
31. Toan NM, Thirumalai D (2012) On the origin of the unusual behavior in the stretching of single-stranded DNA.J Chem Phys136:235103.
32. Manning GS (2006) The persistence length of DNA is reached from the persistence length of its null isomer through an internal electrostatic stretching force.Biophys J
91:3607–3616.
33. Oosawa F (1957) A simple theory of thermodynamic properties of polyelectrolyte solutions.J Polym Sci23:421–430.
34. Imai N, Onishi T (1959) Analytical solution of Poisson-Boltzmann equation for two-dimensional many-center problem.J Chem Phys30:1115–1116.
35. Manning GS (1969) Limiting laws and counterion condensation in polyelectrolyte solutions I. Colligative properties.J Chem Phys51:924–933.
36. Salamone J, ed (1996)Polymeric Materials Encyclopedia(CRC, Boca Raton, FL), pp 649–650.
37. Landy J, McIntosh D, Saleh O, Pincus P (2012) Ionic excesses and entropies in mean-field screening models.Soft Matter8:9368–9375.
38. Jacobson DR, Saleh OA (2017) Counting the ions surrounding nucleic acidsNucleic Acids Res87:1596–1605.
39. Jacobson DR, Saleh OA (2016) Quantifying the ion atmosphere of unfolded, single-stranded nucleic acids using equilibrium dialysis and single-molecule methods.Nucleic Acids Res44:3763–3771.
40. Young M, Jayaram B, Beveridge D (1998) Local dielectric environment of B-DNA in solution: Results from a 14 ns molecular dynamics trajectory.J Phys Chem B102:7666– 7669.
41. Manning GS (1977) Limiting laws and counterion condensation in polyelectrolyte solutions: IV. The approach to the limit and the extraordinary stability of the charge fraction.Biophys Chem7:95–102.
42. Neukirch S, Marko JF (2011) Analytical description of extension, torque, and super-coiling radius of a stretched twisted DNA.Phys Rev Lett106:138104.
43. Ubbink J, Odijk T (1999) Electrostatic-undulatory theory of plectonemically super-coiled DNA.Biophys J76:2502–2519.
44. Stroobants A, Lekkerkerker H, Odijk T (1986) Effect of electrostatic interaction on the liquid crystal phase transition in solutions of rodlike polyelectrolytes.Macromolecules
19:2232–2238.
45. Stigter D (1975) The charged colloidal cylinder with a Gouy double layer.J Colloid Interf Sci53:296–306.
46. Zhang H, Marko JF (2008) Maxwell relations for single-DNA experiments: Monitoring protein binding and double-helix torque with force-extension measurements.Phys Rev E77:031916.
47. Landy J, McIntosh D, Saleh O (2012) Quantifying screening ion excesses in single-molecule force-extension experiments.Phys Rev Lett109:048301.
48. Jacobson DR, Saleh OA (2015) Measuring the differential stoichiometry and energet-ics of ligand binding to macromolecules by single-molecule force spectroscopy: An extended theory.J Phys Chem B119:1930–1938.
49. Saenger W (1984)Principles of Nucleic Acid Structure(Springer, New York). 50. Foloppe N, MacKerell AD (1998) Conformational properties of the deoxyribose
and ribose moieties of nucleic acids: A quantum mechanical study.J Phys Chem B
102:6669–6678.
51. Rief M, Clausen-Schaumann H, Gaub HE (1999) Sequence-dependent mechanics of single DNA molecules.Nat Struct Mol Biol6:346–349.
52. Brockman C, Kim SJ, Schroeder CM (2011) Direct observation of single flexible poly-mers using single stranded DNA.Soft Matter7:8005–8012.
53. Wickersham CE, Kerr DH, Lipman EA (2010) Synthesis of extended nanoscale optical encoders.Bioconjug Chem21:2234–2238.
54. van den Hout M, Skinner GM, Klijnhout S, Krudde V, Dekker NH (2011) The passage of homopolymeric RNA through small solid-state nanopores.Small7:2217–2224. 55. Lansdorp BM, Saleh OA (2012) Power spectrum and Allan variance methods for