R E S E A R C H
Open Access
Self-reported domain-specific and
accelerometer-based physical activity and
sedentary behaviour in relation to
psychological distress among an urban
Asian population
A. H. Y. Chu
1*, R. M. van Dam
1,2, S. J. H. Biddle
3, C. S. Tan
1, D. Koh
1,4and F. Müller-Riemenschneider
1,5Abstract
Background:The interpretation of previous studies on the association of physical activity and sedentary behaviour with psychological health is limited by the use of mostly self-reported physical activity and sedentary behaviour, and a focus on Western populations. We aimed to explore the association of self-reported and devise-based measures of physical activity and sedentary behaviour domains on psychological distress in an urban multi-ethnic Asian population.
Methods:From a population-based cross-sectional study of adults aged 18–79 years, data were used from an overall sample (n= 2653) with complete self-reported total physical activity/sedentary behaviour and domain-specific physical activity data, and a subsample (n= 703) with self-reported domain-specific sedentary behaviour and accelerometry data. Physical activity and sedentary behaviour data were collected using the Global Physical Activity Questionnaire (GPAQ), a domain-specific sedentary behaviour questionnaire and accelerometers. The Kessler Screening Scale (K6) and General Health Questionnaire (GHQ-12) were used to assess psychological distress. Logistic regression models were used to calculate odds ratios (ORs) and 95% confidence intervals, adjusted for socio-demographic and lifestyle characteristics.
Results:The sample comprised 45.0% men (median age = 45.0 years). The prevalence of psychological distress based on the K6 and GHQ-12 was 8.4% and 21.7%, respectively. In the adjusted model, higher levels of self-reported moderate-to-vigorous physical activity (MVPA) were associated with significantly higher odds for K6 (OR = 1.47 [1.03–2.10]; p-trend = 0.03) but not GHQ-12 (OR = 0.97 [0.77–1.23]; p-trend = 0.79), when comparing the highest with the lowest tertile. Accelerometry-assessed MVPA was not significantly associated with K6 (p-trend = 0.50) nor GHQ-12 (p-trend = 0.74). The highest tertile of leisure-time physical activity, but not work- or transport-domain activity, was associated with less psychological distress using K6 (OR = 0.65 [0.43–0.97]; p-trend = 0.02) and GHQ-12 (OR = 0.72 [0.55–0.93]; p-trend = 0.01). Self-reported sedentary behaviour was not associated with K6 (p-trend = 0.90) and GHQ-12 (p-trend = 0.33). The highest tertile of accelerometry-assessed sedentary behaviour was associated with significantly higher odds for K6 (OR = 1.93 [1.00–3.75]; p-trend = 0.04), but not GHQ-12 (OR = 1.34 [0.86–2.08]; p-trend = 0.18).
(Continued on next page)
* Correspondence:[email protected]
1Saw Swee Hock School of Public Health, National University of Singapore, Singapore 117549, Singapore
Full list of author information is available at the end of the article
(Continued from previous page)
Conclusions: Higher levels of leisure-time physical activity and lower levels of accelerometer-based sedentary behaviour were associated with lower psychological distress. This study underscores the importance of assessing accelerometer-based and domain-specific activity in relation to mental health, instead of solely focusing on total volume of activity.
Keywords: Physical activity, Self-report, Accelerometry, Mental health, Adult
Background
Psychological distress, also referred to as stress or emo-tional distress, is a type of non-specific mental health problem commonly used to describe a range of negative parameters such as self-deprecation, irritability, anxiety, depression and social disengagement [1]. It is the body’s response to external stressors [2]. Individuals with psy-chological distress may show symptoms such as lacking enthusiasm, having sleep problems, feeling downhearted or “blue”, feeling hopeless in life, getting “emotional”, and feeling like crying [3]. A nationwide study of 6616 Singaporean adults reported that 12.0% of the popula-tion had at least one lifetime anxiety, affective or alcohol
use disorder [4]. The prevalence of common mental
health problems (i.e. associated with mood, anxiety and substance use disorders) worldwide among adults is 17. 6% within the past 12 months and 29.2% across the life-span; and women have a higher prevalence for mood or anxiety disorder than men [5]. Traditionally, the assess-ment of psychological distress has been performed using self-report measures [6]. Two of the most widely used self-reported screening tools for psychological distress are the Kessler 6 (K6) [7] and GHQ-12 (General Health Questionnaire-12) [8], which have been translated into different languages and extensively validated in general and clinical populations [9–13]. The K6 and GHQ-12 have slightly different properties in assessing psycho-logical health outcomes with regards to the reference period, in which the K6 assessed respondents’ feelings for the past 30 days, while the GHQ-12 assessed if respon-dents’ “present state”differed from their“usual state”.
Regular physical activity [14–18] and less sedentary behaviour [19–21] have been shown to associate with better mental health. Several biological mechanisms of the effect of physical activity on psychological states have been proposed, including a reduction in stress hormones (e.g. cortisol, adrenaline), stimulation of mood-elevating chemicals (e.g. endorphins, serotonin), and an increase in the release of proteins with neuroprotective func-tions and antidepressant role (e.g. brain-derived neuro-trophic factor) [22–25]. Psychological mechanisms that occur with physical activity have also received consider-able attention. For example, the distraction theory sug-gests that diversion from painful stimulus or unpleasant events following exercise leads to improved affect [26].
The self-efficacy theory suggests that confidence in one’s ability to perform physical activity is strongly associated with the actual performance [27]. Other hypotheses in-cluding the mastery theory and social interaction hy-pothesis were also suggested to be responsible for the improved effects on mental health [28,29].
To date, many studies investigating these associations have involved self-reported physical activity or sedentary behaviour measures, which are subject to recall and
re-sponse bias when compared to so-called ‘objective’
measures using wearable devices [30–32]. A relatively small body of literature has evaluated the associations of accelerometer-based physical activity/sedentary be-haviour and psychological distress, and a majority of previous studies were from Western countries. Also, accelerometer-based data has produced different find-ings to self-report data. For example, Hamer et al. [33] found that lower levels of distress were associated with higher levels of self-reported physical activity but not accelerometer-based physical activity. For sedentary be-haviour, on the other hand, there was evidence showing that both accelerometer-based and self-reported sedentary behaviour were associated with higher prevalence of psy-chological distress in the UK population [33]. Since the evi-dence for the associations of accelerometer-based physical activity and sedentary behaviour with mental health seems inconsistent, further investigation is warranted.
(i.e. occupational, motorized transportation, and leisure-time). For example, a study has examined non-occupational sedentary behaviour among 2707 Australian working adults [20], showing that TV viewing, computer use, and total non-occupational sedentary behaviour were associated with worse mental health in women whereas in men, only com-puter use was associated with poor mental well-being.
Taken together, the interpretation of previous studies is limited by: i) the majority of research measured total volume of physical activity (or sedentary behaviour), ii) mixed findings in a limited number of studies comparing association between physical activity (or sedentary be-haviour) and psychological distress using accelerometer-based and self-reported physical activity (or sedentary behaviour), iii) a focus mainly on Western populations. Using a nationally representative sample from Singapore, an urban Asian population, we aimed to assess whether the association between physical activity (or sedentary behaviour) and psychological distress is comparable when using accelerometer-based and self-reported physical ac-tivity (or sedentary behaviour). We seek to explore the as-sociations of physical activity (or sedentary behaviour) and mental health using two different psychological distress scales. Second, we aimed to expand on the literature by comprehensively examining the extent to which total and domain-specific physical activities (or sedentary be-haviour) are associated with psychological distress.
Methods
Study design and participants
The Singapore Health 2 (SH2) is a nationally representa-tive cross-sectional survey of the physical, mental and self-rated overall health of the Singapore residents. The study was conducted between April 2014 and April 2015.
Participants were randomly selected through multistage stratified cluster sampling. Stratification was based on geo-graphical regions. The first-stage sampling included 32,100 randomly selected household addresses with at least 1
resi-dent aged 18–79 years from the National Database on
Dwellings maintained by the Department of Statistics in Singapore. Second-stage sampling included 15,000 randomly selected household addresses from the sampling frame.
Inclusion criteria:
1) Singaporeans or permanent residents, 2) aged 18 to 79 years at entry,
3) stayed at least 4 days per week in the household and were staying in the household for 3 months or longer after the time of enumeration.
Exclusion criteria:
1) household members who had severe mental retardation and mental illness,
2) stroke or injury resulting in loss of speech, were bedridden, or wheelchair-bound,
3) pregnant women.
Out of the 7749 eligible households, a total of 2686 adults participated in the SH2 (yielding a response rate of 35%) and provided self-reported total/domain-specific physical activity, and total sedentary behaviour data. A total of 895 individuals agreed to participate in a dedi-cated physical activity sub-study for additional assess-ments of accelerometer-based physical activity and sedentary behaviour, and self-reported domain-specific sedentary behaviour.
The study was approved by the National University of Singapore Institutional Review Board (NUS IRB:
refer-ence 13–512). Written informed consent was obtained
from all participants. After providing informed consent, participants were interviewed by trained interviewers. All study interviewers were briefed extensively on the study methodologies and underwent rigorous training in the study procedures assigned to them. This was to en-sure strict compliance with the standards and proce-dures of the study. Training of interviewers on consent taking, interviewing and advising on the preparation for the physical examination appointment was conducted by experienced staff from the Saw Swee Hock School of Public Health.
Demographics and clinical disease characteristics
Participants who consented to participate in this study completed a questionnaire through a face-to-face inter-view. Socio-demographics characteristics (i.e. age, gen-der, ethnicity, educational level, marital status, monthly household income and employment status), smoking status, alcohol drinking and body mass index (BMI) were collected from the interview. Study participants were also asked whether they ever had the following chronic diseases: asthma, cancer, diabetes mellitus, heart attack, and stroke.
Physical activity and sedentary behaviour measures Self-reported physical activity
moderate-to-vigorous intensity physical activity (MVPA) and domain-specific physical activity across three do-mains including work (which also comprises household activity), transportation and leisure-time were collected.
Self-reported sedentary behaviour
Total sedentary time was calculated based on: (i) a
single-item sitting question, “How much time do you
usually spend sitting or reclining on a typical day?” adopted from the GPAQ, and (ii) a weighted sum of daily domain-specific sedentary time (weekday sitting minutes*5/7 + weekend day sitting minutes*2/7) adapted from existing and established domain-specific sedentary behaviour questionnaires [38–41]. The single-item sit-ting question was asked to all SH2 participants. Partici-pants in the physical activity sub-study were asked the following additional items on domain-specific sedentary behaviour during a typical week:
(1) sitting time spent working (in the office, school or home),
(2) sitting during transportation (motor vehicle), (3) sitting while watching television (TV), DVD/video
viewing or screen viewing, such as watching videos (i.e. YouTube, online video), internet surfing, using social media, playing electronic games on any media device e.g. on computer, tablet or mobile phone during leisure-time only.
Time spent sitting in each domain was summarized as hours per day (h/d), and capped at 24-h per day (adapted from Rosenberg et al.’s [40] data cleaning protocol). Respondents with invalid summaries of time spent were removed from all analyses.
Accelerometer-based physical activity and sedentary behaviour
Participants from the sub-study were invited to wear the triaxial ActiGraph wGT3X-BT accelerometer (Acti-Graph, LLC, Pensacola, Florida, USA) placed on the right hipbone for seven consecutive days, at least 10 h/d [42,43]. The accelerometers were worn after completing the questionnaires. The accelerometers were initialized at a sampling rate of 30 Hz for data collection and distrib-uted to the participants in person by trained interviewers. Participants were allowed to wear the accelerometers overnight or remove it during bedtime and re-attach it upon waking up in the morning. They were allowed to remove their accelerometers during water-based activ-ities (e.g. showering, swimming, etc.). An instruction sheet containing details of how to wear the accelerome-ters and removing them during water-based activities was provided to the participants. Log sheets were given to participants to record the dates and times when their
accelerometers were worn and removed. Accelerometry data were downloaded and integrated into 60-s epochs, sleep scored, wear time validated, processed and scored for physical activity and sedentary behaviour variables using ActiLife software (Version 6).
Visual inspection of bedtime and wake time
Although participants were allowed to remove the accel-erometers prior to bedtime, some participants wore them 24 h a day. In the data scoring analysis, bedtime may be inadvertently identified as sedentary behaviour time due to very low-intensity activities. Therefore, visual inspection of ‘in-bed’and‘out-of-bed’period was graphic-ally flagged on a minute-by-minute, day-to-day, participant-by-participant basis by two trained researchers.
The protocol to screen for bedtime wearing was by identifying the activity counts which:
1. began with a period of low activity counts (approximately≤50% of the participant’s average daytime activity level) to zeros, lasting at least 5–10 consecutive minutes,
2. persisted to have activity counts that did not rise approximately > 50% of average daytime activity level for more than 5 consecutive minutes within a 3-h period.
Short occurring periods of activity count rise within the visually identified bedtime were allowed if the total duration was < 10 min. Wake time was identified as ac-tivity counts of > 0 lasting for at least 10–15 consecutive minutes. The sleep scoring method used in this study was partly based on Kinder et al.’s [44] approach to visually analyse waist-worn accelerometer data. In addition, the self-reported bedtime and wake times from participants were considered in the visual inspec-tion for bedtime when there is uncertainty. From the visual inspection, all sleep periods were graphically flagged as non-wear time, and subsequently, wear time validation was performed.
Wear time validation and scoring
Non-wear time was defined as 90-consecutive minutes of zero accelerometer counts per min (CPM), and the artefactual movements detection was set to allow inter-ruptions up to a 2-min interval accompanied by either up or downstream 90-min consecutive zero CPM win-dow [45]. The criterion for determining valid monitoring days was having ≥4 days with ≥10 h/d of waking hours in a 24-h period [46].
Accelerometry-based MVPA was analysed by accumu-lated time in bouts of≥10-min.
Psychological distress
Psychological distress was measured using the Kessler
Screening Scale (K6) [7], with the General Health
Questionnaire (GHQ-12) [8] scale as an additional
psychological dimension.
Using the K6, the frequency of non-specific psycho-logical distress experienced by study participants during the last 30 days was measured. The K6 consists of six questions asking how often one felt: (i) nervous, (ii) hopeless, (iii) restless or fidgety, (iv) so depressed that nothing could cheer one up, (v) that everything was an effort, (vi) and worthless. A value of 1, 2, 3, 4 or 5 was assigned to each five Likert-type response category for each question: “none of the time”, “a little of the time”,
“some of the time”, “most of the time”, or “all of the time”, respectively. Responses were summed with a score range of 6–30. Based on previous studies, the summed scores can be classified into three categories: i) no or low psychological distress: 6–13; ii) moderate psycho-logical distress: 14–18; and iii) high psychological distress: 19–30 [49]. Participants were subsequently classified into two groups: no-to-low distress (≤13) vs. moderate-to-high distress only (≥14). Participants with incomplete responses to the questionnaires were excluded from the analysis.
The GHQ-12 measures psychological distress by asking if the respondents’current state differs from their usual state. Thus, the GHQ-12 is sensitive to short-term psycho-logical conditions. The GHQ-12 consists of 12 questions in the contexts of: concentration, losing much sleep, feeling useful, capable of making decisions, under stress, inability to overcome difficulties, enjoy normal activities, able to face up to problems, feeling unhappy and de-pressed, losing confidence, feelings of worthlessness, and feeling reasonably happy. The original Goldberg’s scoring method was used, with each response category of“not at all”, “no more than usual”, “rather more than usual”,
“much more than usual”corresponding to a value of 0–0– 1-1, respectively. A respondent’s total score (summed across all questions) ranges from 0 to 12. Using a cut-off of ≥2 to detect psychological distress was validated in
Singapore [50] and by the WHO [8]. The GHQ-12 was
used as a one-dimensional scale in the current study to keep its originality and simplicity in our analysis [12].
Data analysis
Descriptive analyses were presented as median (inter-quartile range; IQR) for continuous variables as they were not normally distributed, and counts and percent-ages for categorical variables. Differences in the socio-demographic and clinical disease characteristics between psychological distress levels in the overall sample and
physical activity sub-study were tested using Mann-Whitney U test for continuous variables and chi-square test for categorical variables. Logistic regression was used to model psychological distress, such that self-reported and accelerometer-based physical activity/sedentary be-haviour variables were exposures categorized into tertiles. For the categorization of self-reported domain-specific physical activity, a high proportion of participants re-ported zero activity per week in work- and leisure-time domains (57.9% and 50.8%, respectively). Therefore, for the categorization of tertiles across all domain-specific physical activity (work-, transport-, and leisure-time do-mains), all zero values were defined as a separate category (1st tertile). The remaining values were then stratified into two categories based on a median split to form a total of three categories (2nd and 3rd tertile).
In Model 1, the univariable association was examined. In Model 2, adjustments were made for age, gender, eth-nicity, educational level, employment status, BMI, mari-tal status, smoking status, alcohol drinking, the presence of at least one chronic disease; with total sedentary be-haviour added in the physical activity analyses, and vice versa. We reported the association between the expo-sures and outcomes with the odds ratio (OR) and the corresponding 95% confidence interval (CI). When we explored the relationships of moderate- and vigorous-intensity physical activity with psychological distress, the associations were not significant (data not presented). To test for linear trends across categories, we modelled physical activity and sedentary behaviour as continuous variables in their original form. We also tested whether gender, ethnicity, and age could be effect modifiers in the association between the exposures and outcomes. As-sumptions for the logistic regression analyses were met and multicollinearity among independent variables was in-vestigated (variance inflation factor [VIF] values < 1.97) [51]. The significance level was set at 0.05. The statistical analysis was performed using the Stata Statistical Software version 14 (College Station, TX: StataCorp LP).
Results
Study participants
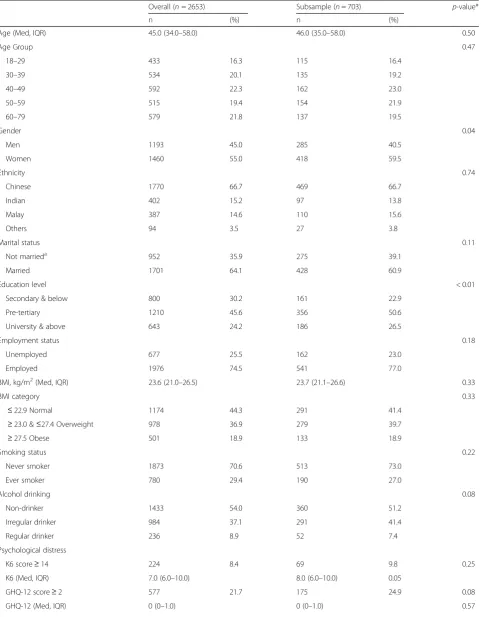
Table 1Participants’characteristics in SH2 study and physical activity sub-study
Overall (n= 2653) Subsample (n= 703) p-value*
n (%) n (%)
Age (Med, IQR) 45.0 (34.0–58.0) 46.0 (35.0–58.0) 0.50
Age Group 0.47
18–29 433 16.3 115 16.4
30–39 534 20.1 135 19.2
40–49 592 22.3 162 23.0
50–59 515 19.4 154 21.9
60–79 579 21.8 137 19.5
Gender 0.04
Men 1193 45.0 285 40.5
Women 1460 55.0 418 59.5
Ethnicity 0.74
Chinese 1770 66.7 469 66.7
Indian 402 15.2 97 13.8
Malay 387 14.6 110 15.6
Others 94 3.5 27 3.8
Marital status 0.11
Not marrieda 952 35.9 275 39.1
Married 1701 64.1 428 60.9
Education level < 0.01
Secondary & below 800 30.2 161 22.9
Pre-tertiary 1210 45.6 356 50.6
University & above 643 24.2 186 26.5
Employment status 0.18
Unemployed 677 25.5 162 23.0
Employed 1976 74.5 541 77.0
BMI, kg/m2(Med, IQR) 23.6 (21.0–26.5) 23.7 (21.1–26.6) 0.33
BMI category 0.33
≤22.9 Normal 1174 44.3 291 41.4
≥23.0 &≤27.4 Overweight 978 36.9 279 39.7
≥27.5 Obese 501 18.9 133 18.9
Smoking status 0.22
Never smoker 1873 70.6 513 73.0
Ever smoker 780 29.4 190 27.0
Alcohol drinking 0.08
Non-drinker 1433 54.0 360 51.2
Irregular drinker 984 37.1 291 41.4
Regular drinker 236 8.9 52 7.4
Psychological distress
K6 score≥14 224 8.4 69 9.8 0.25
K6 (Med, IQR) 7.0 (6.0–10.0) 8.0 (6.0–10.0) 0.05
GHQ-12 score≥2 577 21.7 175 24.9 0.08
complete information on domain-specific sedentary behaviour, valid accelerometer-based physical activity/ sedentary behaviour data, and psychological distress measures were included in the sub-study. Participants from the physical activity sub-study as compared with those in the main SH2 study were statistically signifi-cantly different in gender, educational level, stroke, and presence of at least one chronic disease (i.e. asthma, cancer, diabetes mellitus, heart attack, and stroke).
Psychological distress
The prevalence of psychological distress based on the K6 was 8.4% and based on the GHQ-12 was 21.7% (Table1). Characteristics of participants according to the K6 psychological distress score in each overall sample and subsample are presented in Additional file1: Table S1, those who had moderate-to-high distress tended to be younger, not married, had asthma and had at least one chronic disease in the overall sample (p-value< 0.05). Dif-ferences in the characteristics between K6 psychological distress levels in the subsample presented similar findings for the aforementioned variables except for educational level, employment status, and smoking status.
Based on the GHQ-12, those who were distressed tended to be younger, married, regular alcohol drinkers, had asthma or at least one chronic disease in the overall sample (p-value< 0.05) (Additional file1: Table S2). Dif-ferences in the characteristics between GHQ-12 psycho-logical distress levels in the subsample presented similar findings for the aforementioned variables except for al-cohol drinking and had at least one chronic disease.
Total physical activity, sedentary behaviour and psychological distress
Self-reported physical activity and sedentary behaviour
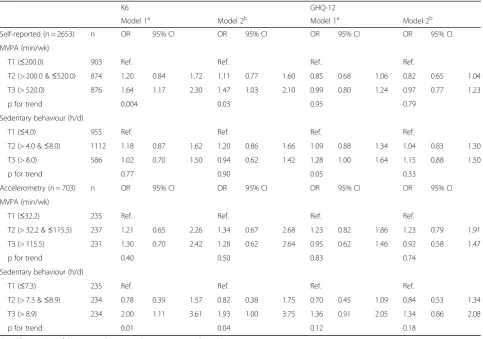
Table 2 presents the association of total MVPA and
sedentary behaviour with psychological distress. In comparison with the lowest tertile, the unadjusted and adjusted ORs suggest that higher levels of self-reported
MVPA were associated with higher psychological
distress using the K6 (adjusted OR = 1.47; 95% CI =
1.03–2.10), but not the GHQ-12 (adjusted OR = 0.97;
95% CI = 0.77–1.23). There was evidence of a linear
trend between MVPA and higher psychological dis-tress using the K6 (p for trend = 0.03). Self-reported sedentary behaviour was not significantly associated with psychological distress using the K6 or GHQ-12 in the adjusted model. No significant effect modifica-tion/potential interaction by gender, ethnicities and age group was observed.
Accelerometer-based physical activity and sedentary behaviour
There was no significant linear trend between
accelerometer-based MVPA and psychological distress
using the K6 or GHQ-12 (Table 2). However, the
highest tertile of accelerometer-based sedentary be-haviour had borderline significance with higher psy-chological distress using the K6 (adjusted OR = 1.93;
95% CI = 1.00–3.75, p for trend = 0.04), whereas no
significant association was reported for GHQ-12 psy-chological distress.
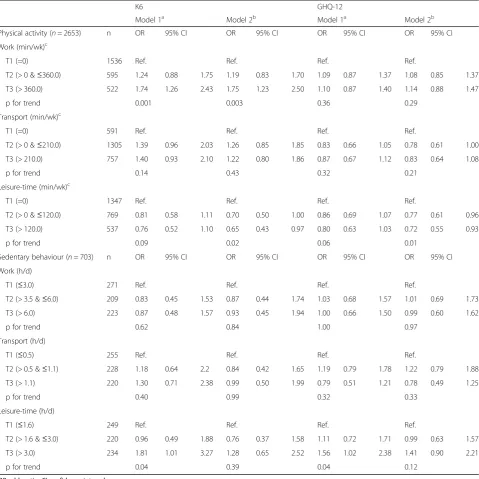
Domain-specific physical activity, sedentary behaviour and psychological distress
Within physical activity domains, there was a significant linear trend between work-domain physical activity and K6 psychological distress (Table 3). The highest tertile of work-domain physical activity was significantly associated with higher odds of psychological distress using the K6 (adjusted OR = 1.75; 95% CI = 1.23–2.50; p for trend = 0.003), but not the GHQ-12 (adjusted OR = 1.14; 95% CI = 0.88–1.47; p for trend = 0.29). No significant linear trend was observed between transport-domain physical activity and psychological distress by any scales. In con-trast, the highest tertile of leisure-time physical activity was associated with lower odds for K6 psychological distress (adjusted OR = 0.65; 95% CI = 0.43–0.97; p for trend = 0.02). Similarly, increasing activity across ter-tiles of leisure-time physical activity was associated with Table 1Participants’characteristics in SH2 study and physical activity sub-study(Continued)
Overall (n= 2653) Subsample (n= 703) p-value*
n (%) n (%)
Asthma 281 10.6 69 9.8 0.55
Cancer 52 2.0 16 2.3 0.60
Diabetes mellitus 235 8.9 52 7.4 0.22
Heart attack 34 1.3 9 1.3 0.99
Stroke 31 1.2 1 0.1 0.01
Presence of at least one disease 172 6.5 136 19.3 < 0.01
*p-value: Test of significance between overall sample and subsample a
decreasing odds for GHQ-12 psychological distress (Middle tertile: adjusted OR = 0.77; 95% CI = 0.61–0.96, highest tertile: adjusted OR = 0.72; 95% CI = 0.55–0.93; p for trend = 0.01). Within sedentary behaviour do-mains, none of the adjusted domain-specific sedentary behaviour variables was significantly associated with psychological distress.
The associations of domain-specific physical activity and psychological distress in the subsample are pre-sented in Additional file1: Table S3. The association be-tween the highest tertile of work-domain physical activity and psychological distress using the K6 was of borderline significance in the subsample (adjusted OR = 1.97; 95% CI = 1.00–3.93; p for trend = 0.07). The middle tertile of leisure-time physical activity in the subsample was associated with lower odds for psychological distress using the K6 (adjusted OR = 0.47; 95% CI = 0.23–0.95; p for trend = 0.21). Similarly, the middle tertile of leisure-time physical activity was associated with lower odds for GHQ-12 psychological distress, with a statis-tically significant linear trend of borderline significance
(adjusted OR = 0.64; 95% CI = 0.41–0.98; p for trend = 0.05). No significant linear trend was observed be-tween transport-domain physical activity and psycho-logical distress by any scales.
Discussion
In this multi-ethnic adult Asian population, higher levels of self-reported MVPA were associated with a higher likelihood of psychological distress assessed by the K6 but not the GHQ-12. In contrast, total MVPA assessed by the accelerometers was not associated with psycho-logical distress. Consideration of domain-specific physical activities revealed that this direct association between self-reported MVPA and psychological distress was mainly due to work-related physical activity, whereas higher leisure-time physical activity was associated with less psychological distress based on both the K6 and the GHQ-12. Self-reported total and domain-specific sedentary behaviour were not associated with psychological distress. How-ever, higher levels of accelerometer-based total seden-tary behaviour were associated with a greater likelihood
Table 2Physical activity and sedentary behaviour by self-report and accelerometry in relation to psychological distress
K6 GHQ-12
Model 1a Model 2b Model 1a Model 2b
Self-reported (n= 2653) n OR 95% CI OR 95% CI OR 95% CI OR 95% CI
MVPA (min/wk)
T1 (≤200.0) 903 Ref. Ref. Ref. Ref.
T2 (> 200.0 &≤520.0) 874 1.20 0.84 1.72 1.11 0.77 1.60 0.85 0.68 1.06 0.82 0.65 1.04
T3 (> 520.0) 876 1.64 1.17 2.30 1.47 1.03 2.10 0.99 0.80 1.24 0.97 0.77 1.23
p for trend 0.004 0.03 0.95 0.79
Sedentary behaviour (h/d)
T1 (≤4.0) 955 Ref. Ref. Ref. Ref.
T2 (> 4.0 &≤8.0) 1112 1.18 0.87 1.62 1.20 0.86 1.66 1.09 0.88 1.34 1.04 0.83 1.30
T3 (> 8.0) 586 1.02 0.70 1.50 0.94 0.62 1.42 1.28 1.00 1.64 1.15 0.88 1.50
p for trend 0.77 0.90 0.05 0.33
Accelerometry (n= 703) n OR 95% CI OR 95% CI OR 95% CI OR 95% CI
MVPA (min/wk)
T1 (≤32.2) 235 Ref. Ref. Ref. Ref.
T2 (> 32.2 &≤115.5) 237 1.21 0.65 2.26 1.34 0.67 2.68 1.23 0.82 1.86 1.23 0.79 1.91
T3 (> 115.5) 231 1.30 0.70 2.42 1.28 0.62 2.64 0.95 0.62 1.46 0.92 0.58 1.47
p for trend 0.40 0.50 0.83 0.74
Sedentary behaviour (h/d)
T1 (≤7.3) 235 Ref. Ref. Ref. Ref.
T2 (> 7.3 &≤8.9) 234 0.78 0.39 1.57 0.82 0.38 1.75 0.70 0.45 1.09 0.84 0.53 1.34
T3 (> 8.9) 234 2.00 1.11 3.61 1.93 1.00 3.75 1.36 0.91 2.05 1.34 0.86 2.08
p for trend 0.01 0.04 0.12 0.18
ORodds ratio,CIconfidence interval,MVPAmoderate-to-vigorous physical activity a
Unadjusted odds b
of psychological distress, especially when assessed by the K6.
The difference in the association for self-reported total MVPA according to the K6 and the GHQ-12 in this study may in part be related to the different psycho-logical measurement scales. As mentioned previously, the K6 reflects respondents’psychological distress status of the past 30 days, whereas the GHQ-12 reflects their present psychological state relative to their usual state.
Therefore, people with long-term chronic psychological health conditions may not respond optimally to the GHQ-12. This study finding was inconsistent with most previous studies [15, 30–33]. For example, the associ-ation between higher doses of MVPA and lower likeli-hood of psychological distress using the K6 has been described in a large population of Australian adults [32]. In a large representative sample of 78,886 U.S. adults aged
≥18-years from the 2009 Behavioral Risk Factor
Table 3Domain-specific physical activity and sedentary behaviour by self-report in relation to psychological distress
K6 GHQ-12
Model 1a Model 2b Model 1a Model 2b
Physical activity (n= 2653) n OR 95% CI OR 95% CI OR 95% CI OR 95% CI
Work (min/wk)c
T1 (=0) 1536 Ref. Ref. Ref. Ref.
T2 (> 0 &≤360.0) 595 1.24 0.88 1.75 1.19 0.83 1.70 1.09 0.87 1.37 1.08 0.85 1.37
T3 (> 360.0) 522 1.74 1.26 2.43 1.75 1.23 2.50 1.10 0.87 1.40 1.14 0.88 1.47
p for trend 0.001 0.003 0.36 0.29
Transport (min/wk)c
T1 (=0) 591 Ref. Ref. Ref. Ref.
T2 (> 0 &≤210.0) 1305 1.39 0.96 2.03 1.26 0.85 1.85 0.83 0.66 1.05 0.78 0.61 1.00
T3 (> 210.0) 757 1.40 0.93 2.10 1.22 0.80 1.86 0.87 0.67 1.12 0.83 0.64 1.08
p for trend 0.14 0.43 0.32 0.21
Leisure-time (min/wk)c
T1 (=0) 1347 Ref. Ref. Ref. Ref.
T2 (> 0 &≤120.0) 769 0.81 0.58 1.11 0.70 0.50 1.00 0.86 0.69 1.07 0.77 0.61 0.96
T3 (> 120.0) 537 0.76 0.52 1.10 0.65 0.43 0.97 0.80 0.63 1.03 0.72 0.55 0.93
p for trend 0.09 0.02 0.06 0.01
Sedentary behaviour (n= 703) n OR 95% CI OR 95% CI OR 95% CI OR 95% CI
Work (h/d)
T1 (≤3.0) 271 Ref. Ref. Ref. Ref.
T2 (> 3.5 &≤6.0) 209 0.83 0.45 1.53 0.87 0.44 1.74 1.03 0.68 1.57 1.01 0.69 1.73
T3 (> 6.0) 223 0.87 0.48 1.57 0.93 0.45 1.94 1.00 0.66 1.50 0.99 0.60 1.62
p for trend 0.62 0.84 1.00 0.97
Transport (h/d)
T1 (≤0.5) 255 Ref. Ref. Ref. Ref.
T2 (> 0.5 &≤1.1) 228 1.18 0.64 2.2 0.84 0.42 1.65 1.19 0.79 1.78 1.22 0.79 1.88
T3 (> 1.1) 220 1.30 0.71 2.38 0.99 0.50 1.99 0.79 0.51 1.21 0.78 0.49 1.25
p for trend 0.40 0.99 0.32 0.33
Leisure-time (h/d)
T1 (≤1.6) 249 Ref. Ref. Ref. Ref.
T2 (> 1.6 &≤3.0) 220 0.96 0.49 1.88 0.76 0.37 1.58 1.11 0.72 1.71 0.99 0.63 1.57
T3 (> 3.0) 234 1.81 1.01 3.27 1.28 0.65 2.52 1.56 1.02 2.38 1.41 0.90 2.21
p for trend 0.04 0.39 0.04 0.12
ORodds ratio,CIconfidence interval a
Unadjusted odds b
Adjusted for age, gender, ethnicity, marital status, education, employment status, BMI, smoking status, and alcohol drinking, presence of at least 1 disease and mutually adjusted for physical activity and sedentary behaviour, respectively
c
Surveillance System, individuals without serious psycho-logical distress were more likely to self-report higher phys-ical activity levels than those with serious psychologphys-ical distress using the K6 [52]. Previous studies using the GHQ-12 also reported an association between higher levels of self-reported physical activity and less psycho-logical distress in the Health Survey for England [33], the Scottish Health Survey [15,30], and the Singapore’s
2010 National Health Survey [31]. The discrepancies
between previous studies and ours may in part be due to the use of: i) different cut-off points for detecting psychological distress despite using the same scale (i.e. GHQ-12) [15,30,33], ii) different psychological distress scales (i.e. K10) [32], iii) or merely the diverse charac-teristics of study populations. Of note, despite the simi-larities between the study setting in Sloan et al.’s [31] and ours, the discrepancies in findings could partly be due to different classification of participants into cat-egories (i.e. meeting or not meeting physical activity guidelines in Sloan et al.’s study vs. categorization into tertiles in our study).
Accelerometer-based MVPA was not associated with psychological distress in the current study. Such differ-ences were also observed in Parker et al.’s study [53], of which accelerometer-based MVPA predicted psycho-logical negative affectivity better than self-reports among older adults. Our study revealed substantial differences between accelerometer-based and self-report data (e.g. range of medium tertiles of time spent on MVPA based on self-report and accelerometry were > 200.0 & ≤520. 0 min/week and > 32.2 &≤115.5 min/week, respectively). Accelerometers are considered relatively accurate and reliable instrument to measure physical activity [54,55], and thus may provide greater accuracy in reflecting the associations with psychological distress. Our finding is in line with Hamer et al.’s [33] study which did not observe any relationship between accelerometer-based MVPA and psychological distress. In contrast, previous studies found that higher levels of accelerometer-based MVPA were as-sociated with less depressive symptoms using the Patient Health Questionnaire-9 in a sample of 2862 general adult population [56] and 708 older adults from the National Health and Nutrition Examination Survey (NHANES) 2005–2006 [57]. The use of different accelerometers (ActiGraph accelerometer model 7164) and cut-offs to
categorize MVPA in Vallance et al. [56] (counts/min
≥1952) and Loprinzi’s studies [57] (counts/min ≥2020) could have also led to inconsistent results between accelerometer-based MVPA and psychological distress as seen in our study. Two previous studies in older Japanese adults also showed that higher levels of accelerometer-based physical activity assessed over a period of 1 year were associated with lower depressive scores [58] and stressful life events [59]. However, it
should be noted that with different psychological mea-sures, these results cannot be directly compared. Over-all, the observed variations in health outcomes have further indicated the differences in accelerometer-based or self-report measures.
Interestingly, there appear to be clear and distinct dif-ferences among domains of physical activity. Our study revealed that higher levels of work-domain physical ac-tivity were associated with higher likelihood of psycho-logical distress using the K6, while transport-domain physical activity was not associated with psychological distress. Whether the relationship between higher physical activity levels and higher psychological dis-tress was related to the different amount of activity time occurred in each domain remains unclear. How-ever, when compared with other studies that assessed the associations of domain-specific physical activity with psychological health, it did not appear to be the case that our population engaged in a particularly higher amount of work-related physical activity or lower amount of leisure-time physical activity [60,61].
associations between leisure-time and work-domain phys-ical activities for psychologphys-ical distress can be attributed to the different intensity of the activities engaged in these domains or merely to the difference in the type of activ-ities. It is possible that work-domain physical activity was not perceived as a self-controlled behaviour or choice of task performance. Also, the performance of work-related physical activity has been linked to symptoms of lower back pain or other associated negative physical health out-comes [65]. This collection of evidence shows that differ-ences in the associations between psychological distress and domain-specific physical activity do exist, implying that psychological distress is influenced by the context in which physical activity is performed. Engagement in leisure-time physical activity should thus be encouraged and could be an effective means of health promotion strategy.
Self-reported total sedentary behaviour was not associ-ated with psychological distress, and this was consistent across the K6 and the GHQ-12. This interpretation con-trasts with that of previous studies which showed detri-mental associations between self-reported sedentary behaviour and psychological distress using the GHQ-12 [31,33] and the K10 [66]. We also did not find any asso-ciation between self-reported domain-specific sedentary behaviour and psychological distress. To date, the lim-ited evidence has generally been mixed. For example, Proper et al.’s study [34] found no association between work-domain sedentary behaviour and mental health, but not in Kilpatrick et al.’s study [66]. Also, Hamer et al. [33] found an equivocal association of TV viewing time on psychological distress, but not in Atkin et al.’s study [20]. Differences in the use of dissimilar self-report indicators of total sedentary behaviour could underlie some of the inconsistencies in results. In Hamer et al.’s study [33], for instance, sedentary behaviour question-naire with items on TV viewing and other leisure-time sitting such as reading and computer use was employed. These aspects of our results should always be confirmed by further investigations.
Our study found that accelerometer-based total seden-tary behaviour was associated with higher likelihood of psychological distress. The present findings were con-sistent with previous studies which included accelerom-eter measurement of sedentary behaviour. Hamer et al. [33] showed that higher levels of accelerometer-based sedentary behaviour were also associated with psycho-logical distress using the GHQ-12. Likewise, the NHANES 2005–2006 revealed that higher levels of accelerometer-based sedentary behaviour were associated with a higher likelihood of depression, although the associ-ation was not statistically significant in the fully ad-justed model [56]. In a smaller study, lower levels of accelerometer-based sedentary behaviour (< 8 h/day)
have also been associated with fewer depressive symptoms in sedentary, overweight and obese U.S. women [67]. The associations between higher levels of accelerometer-based sedentary behaviour and higher psychological distress may reflect the effect of being sedentary on one’s development of social networks [68]. This finding again highlights the importance of describing the asso-ciation between psychological distress and sedentary behaviour (and physical activity) assessed using acceler-ometer measurement.
The strengths of the present study include the assess-ment of accelerometer-based and self-reported physical activity and sedentary behaviour, and different psycho-logical measures. This study adds strength to previous studies in assessing self-reported physical activity and sedentary behaviour across various life domains. Also, the study was conducted in a fairly large nationally representative sample of an urban Asian population con-sisting of men and women from a wide range of educa-tional and socioeconomic backgrounds.
Conclusion
In conclusion, our findings demonstrated that more leisure-time physical activity and less sedentary behav-iour were associated with reduced psychological distress in an urban Asian setting, whereas higher levels of work-domain or transport physical activity were not asso-ciated with less psychological distress. Higher levels of work-domain physical activity were associated with higher levels of psychological distress. To improve psychological health, interventions could promote leisure-time physical activity as a targeting construct. This study underscores the importance of assessing accelerometer-based and self-reported domain-specific activity in relation to mental health, instead of solely focusing on total volume of activity.
Additional file
Additional file 1:Table S1.Participants’characteristics according to K6 psychological distress scale in SH2 study and physical activity sub-study.
Table S2.Participants’characteristics according to GHQ-12 psychological distress scale in SH2 study and physical activity sub-study.Table S3.
Domain-specific physical activity by self-report in relation to psychological distress in subsample (n= 703). (DOCX 88 kb)
Abbreviations
BMI:Body mass index; CPM: Counts per min; GHQ-12: Health Questionnaire; GPAQ: Physical Activity Questionnaire; IQR: Interquartile range; K6: Kessler screening scale; MVPA: Moderate-to-vigorous intensity physical activity; NHANES: National Health and Nutrition Examination Survey; OR: Odds ratio; SH2: Singapore Health 2; VIF: Variance inflation factor; WHO: World Health Organization
Acknowledgements
The authors wish to thank the data management team for their thorough explanations on the set-up of the SH2 and its derived data, extraction and preparation of data; and all SH2 participants for their time and contributions to the data.
Funding
This study was supported by grants from the National University of Singapore, Ministry of Health, Singapore, and National University Health System, Singapore.
Availability of data and materials
The data that support the findings of this study are available from the Saw Swee Hock School of Public Health, National University of Singapore, and may be requested from its data accession committee by email to [email protected].
Authors’contributions
AHYC contributed to the acquisition of data, the design of the analysis plan, performed all statistical analysis and interpreted the data, as well as drafted the article. RMvD contributed to the design of the analysis plan, supported the data interpretation and revised the article critically for important intellectual content, as well as contributed his expertise on epidemiological research. SJHB critically read and commented on the article, as well as contributed his expertise on physical activity, sedentary behaviour, and mental health. CST contributed to the design of the analysis plan, supported the data interpretation, critically read and commented on the article. DK supported the data interpretation, as well as contributed his expertise on mental health research. FMR contributed to the design of the analysis plan, critically read and commented on the article, as well as contributed his expertise on physical activity and sedentary behaviour. All authors read and approved the final manuscript.
Ethics approval and consent to participate
Ethics approval for the Singapore Health 2 Study was obtained by the National University of Singapore Institutional Review Board (NUS IRB: reference 13–512). Written informed consent was obtained from all participants before the conduct of the study.
Consent for publication
Not applicable.
Competing interests
The authors declare that they have no competing interests.
Publisher’s Note
Springer Nature remains neutral with regard to jurisdictional claims in published maps and institutional affiliations.
Author details
1
Saw Swee Hock School of Public Health, National University of Singapore, Singapore 117549, Singapore.2Department of Nutrition, Harvard School of Public Health, Boston, MA 02115, USA.3Physically Active Lifestyles (PALs) Research Group, Institute for Resilient Regions, University of Southern Queensland, Springfield Central, Ipswich, Australia.4PAPRSB Institute of Health Sciences, Universiti Brunei Darussalam, Jalan Tungku Link, Gadong BE1410, Brunei Darussalam.5Institute for Social Medicine, Epidemiology and Health Economics, Charité University Medical Centre, 10117 Berlin, Germany.
Received: 19 December 2017 Accepted: 27 March 2018
References
1. Massé R, Poulin C, Dassa C, Lambert J, Bélair S, Battaglini A. The structure of mental health: higher-order confirmatory factor analyses of psychological distress and well-being measures. Soc Indic Res. 1998;45:475–504. 2. McKenzie SH, Harris MF. Understanding the relationship between stress,
distress and healthy lifestyle behaviour: a qualitative study of patients and general practitioners. BMC Fam Pract. 2013;14:166.
3. Decker FH. Occupational and nonoccupational factors in job satisfaction and psychological distress among nurses. Res Nurs Health. 1997;20:453–64. 4. Chong SA, Abdin E, Vaingankar JA, Heng D, Sherbourne C, Yap M, Lim YW,
Wong HB, Ghosh-Dastidar B, Kwok KW. A population-based survey of mental disorders in Singapore. Ann Acad Med Singap. 2012;41:49–66. 5. Steel Z, Marnane C, Iranpour C, Chey T, Jackson JW, Patel V, Silove D. The
global prevalence of common mental disorders: a systematic review and meta-analysis 1980-2013. Int J Epidemiol. 2014;43:476–93.
6. Haeffel GJ, Howard GS. Self-report: psychology's four-letter word. Am J Psychol. 2010;123:181.
7. Kessler RC, Andrews G, Colpe LJ, Hiripi E, Mroczek DK, Normand SL, Walters EE, Zaslavsky AM. Short screening scales to monitor population prevalences and trends in non-specific psychological distress. Psychol Med. 2002;32:959–76. 8. Goldberg DP, Gater R, Sartorius N, Ustun TB, Piccinelli M, Gureje O, Rutter C.
The validity of two versions of the GHQ in the WHO study of mental illness in general health care. Psychol Med. 1997;27:191–7.
9. Kessler RC, Green JG, Gruber MJ, Sampson NA, Bromet E, Cuitan M, Furukawa TA, Gureje O, Hinkov H, Hu C-y, et al. Screening for serious mental illness in the general population with the K6 screening scale: results from the WHO World Mental Health (WMH) survey initiative. Int J Methods Psychiatr Res. 2010;19:4–22.
10. Furukawa TA, Kessler RC, Slade T, Andrews G. The performance of the K6 and K10 screening scales for psychological distress in the Australian National Survey of mental health and well-being. Psychol Med. 2003;33: 357–62.
11. Furukawa TA, Kawakami N, Saitoh M, Ono Y, Nakane Y, Nakamura Y, Tachimori H, Iwata N, Uda H, Nakane H, et al. The performance of the Japanese version of the K6 and K10 in the World Mental Health Survey Japan. Int J Methods Psychiatr Res. 2008;17:152–8.
12. Gao F, Luo N, Thumboo J, Fones C, Li SC, Cheung YB. Does the 12-item General Health Questionnaire contain multiple factors and do we need them? Health Qual Life Outcomes. 2004;2:63.
14. Penedo FJ, Dahn JR. Exercise and well-being: a review of mental and physical health benefits associated with physical activity. Curr Opin Psychiatry. 2005;18:189–93.
15. Hamer M, Biddle SJH, Stamatakis E. Weekend warrior physical activity pattern and common mental disorder: a population wide study of 108,011 British adults. Int J Behav Nutr Phys Act. 2017;14:96.
16. Chu AHY, Koh D, Moy FM, Müller-Riemenschneider F. Do workplace physical activity interventions improve mental health outcomes? Occup Med. 2014; 64:235–45.
17. Mammen G, Faulkner G. Physical activity and the prevention of depression. Am J Prev Med. 2013;45:649–57.
18. Rosenbaum S, Tiedemann A, Sherrington C, Curtis J, Ward PB. Physical activity interventions for people with mental illness: a systematic review and meta-analysis. J Clin Psychiatry. 2014;75:964–74.
19. Teychenne M, Ball K, Salmon J. Sedentary behavior and depression among adults: a review. Int J Behav Med. 2010;17:246–54.
20. Atkin AJ, Adams E, Bull FC, Biddle SJ. Non-occupational sitting and mental well-being in employed adults. Ann Behav Med. 2012;43:181–8. 21. Teychenne M, Costigan SA, Parker K. The association between sedentary
behaviour and risk of anxiety: a systematic review. BMC Public Health. 2015; 15:513.
22. Lobstein DD, Rasmussen CL. Decreases in resting plasma beta-endorphin and depression scores after endurance training. J Sports Med Phys Fitness. 1991;31:543–51.
23. Sarbadhikari SN, Saha AK. Moderate exercise and chronic stress produce counteractive effects on different areas of the brain by acting through various neurotransmitter receptor subtypes: a hypothesis. Theor Biol Med Model. 2006;3:33.
24. Wolff E, Gaudlitz K, von Lindenberger B-L, Plag J, Heinz A, Ströhle A. Exercise and physical activity in mental disorders. Eur Arch Psychiatry Clin Neurosci. 2011;261:186.
25. Neeper SA, Gomez-Pinilla F, Choi J, Cotman C. Exercise and brain neurotrophins. Nature. 1995;373:109.
26. Greist JH, Klein MH, Eischens RR, Faris J, Gurman AS, Morgan WP. Running as treatment for depression. Compr Psychiatry. 1979;20:41–54.
27. Bandura A. Self-efficacy: toward a unifying theory of behavioral change. Psychol Rev. 1977;84:191–215.
28. Mellion MB. Exercise therapy for anxiety and depression. 1. Does the evidence justify its recommendation? Postgrad Med. 1985;77:59–66. 29. Ransford CP. A role for amines in the antidepressant effect of exercise: a
review. Med Sci Sports Exerc. 1982;14:1–10.
30. Hamer M, Stamatakis E, Steptoe A. Dose-response relationship between physical activity and mental health: the Scottish Health Survey. Br J Sports Med. 2009;43:1111–4.
31. Sloan RA, Sawada SS, Girdano D, Liu YT, Biddle SJ, Blair SN. Associations of sedentary behavior and physical activity with psychological distress: a cross-sectional study from Singapore. BMC Public Health. 2013;13:885.
32. Perales F, del Pozo-Cruz J, del Pozo-Cruz B. Impact of physical activity on psychological distress: a prospective analysis of an Australian national sample. Am J Public Health. 2014;104:e91–7.
33. Hamer M, Coombs N, Stamatakis E. Associations between objectively assessed and self-reported sedentary time with mental health in adults: an analysis of data from the Health Survey for England. BMJ Open. 2014;4(3):e004580. 34. Proper KI, Picavet HSJ, Bemelmans WJ, Verschuren W, Wendel-Vos G. Sitting
behaviors and mental health among workers and nonworkers: the role of weight status. J Obes. 2011;2012. doi:https://doi.org/10.1155/2012/607908. 35. White RL, Babic MJ, Parker PD, Lubans DR, Astell-Burt T, Lonsdale C.
Domain-specific physical activity and mental health: a meta-analysis. Am J Prev Med. 2017;52(5):653–66.
36. Chu AHY, Ng SHX, Koh D, Müller-Riemenschneider F. Reliability and validity of the self- and interviewer-administered versions of the Global Physical Activity Questionnaire (GPAQ). PLoS One. 2015;10:e0136944.
37. World Health Organization. WHO STEPS surveillance manual. The WHO STEPwise approach to chronic disease risk factor surveillance. 2005. Geneva: World Health Organization; 2005.
38. Chau JY, van der Ploeg HP, Dunn S, Kurko J, Bauman AE. A tool for measuring workers' sitting time by domain: the workforce sitting questionnaire. Br J Sports Med. 2011;45:1216–22.
39. Lynch B, Friedenreich C, Khandwala F, Liu A, Nicholas J, Csizmadi I. Development and testing of a past year measure of sedentary behavior: the SIT-Q. BMC Public Health. 2014;14:899.
40. Rosenberg DE, Norman GJ, Wagner N, Patrick K, Calfas KJ, Sallis JF. Reliability and validity of the Sedentary Behavior Questionnaire (SBQ) for adults. J Phys Act Health. 2010;7:697–705.
41. Wijndaele K, D. E. Bourdeaudhuij I, Godino JG, Lynch BM, Griffin SJ, Westgate K, Brage S. Reliability and validity of a domain-specific last 7-d sedentary time questionnaire. Med Sci Sports Exerc 2014, 46:1248–1260. 42. Troiano RP, Berrigan D, Dodd KW, Masse LC, Tilert T, McDowell M. Physical
activity in the United States measured by accelerometer. Med Sci Sports Exerc. 2008;40:181–8.
43. Tudor-Locke C, Camhi SM, Troiano RP. A catalog of rules, variables, and definitions applied to accelerometer data in the National Health and Nutrition Examination Survey, 2003–2006. Prev Chronic Dis. 2012;9:E113. 44. Kinder JR, Lee KA, Thompson H, Hicks K, Topp K, Madsen KA. Validation of a
hip-worn accelerometer in measuring sleep time in children. J Pediatr Nurs. 2012;27:127–33.
45. Choi L, Liu Z, Matthews CE, Buchowski MS. Validation of accelerometer wear and nonwear time classification algorithm. Med Sci Sports Exerc. 2011;43: 357–64.
46. Trost SG, McIver KL, Pate RR. Conducting accelerometer-based activity assessments in field-based research. Med Sci Sports Exerc. 2005;37:S531–43. 47. Sasaki JE, John D, Freedson PS. Validation and comparison of ActiGraph
activity monitors. J Sci Med Sport. 2011;14:411–6.
48. Kozey-Keadle S, Libertine A, Lyden K, Staudenmayer J, Freedson PS. Validation of wearable monitors for assessing sedentary behavior. Med Sci Sports Exerc. 2011;43:1561–7.
49. Kessler RC, Barker PR, Colpe LJ, Epstein JF, Gfroerer JC, Hiripi E, Howes MJ, Normand SL, Manderscheid RW, Walters EE, Zaslavsky AM. Screening for serious mental illness in the general population. Arch Gen Psychiatry. 2003; 60:184–9.
50. Fones CS, Kua EH, Ng TP, Ko SM. Studying the mental health of a nation: a preliminary report on a population survey in Singapore. Singap Med J. 1998; 39:251–5.
51. Kutner M, Nachtsheim C, Neter J. Applied linear statistical models. 4th ed. New York: McGraw-Hill; 2004.
52. Okoro CA, Stoodt G, Rohrer JE, Strine TW, Li C, Balluz LS. Physical activity patterns among U.S. adults with and without serious psychological distress. Public Health Rep. 2014;129:30–8.
53. Parker SJ, Strath SJ, Swartz AM. Physical activity measurement in older adults: relationships with mental health. J Aging Phys Act.
2008;16:369–80.
54. Ried-Larsen M, Brønd JC, Brage S, Hansen BH, Grydeland M, Andersen LB, Møller NC. Mechanical and free living comparisons of four generations of the ActiGraph activity monitor. Int J Behav Nutr Phys Act. 2012;9:113. 55. Hendelman D, Miller K, Baggett C, Debold E, Freedson P. Validity of
accelerometry for the assessment of moderate intensity physical activity in the field. Med Sci Sports Exerc. 2000;32:S442–9.
56. Vallance JK, Winkler EA, Gardiner PA, Healy GN, Lynch BM, Owen N. Associations of objectively-assessed physical activity and sedentary time with depression: NHANES (2005–2006). Prev Med. 2011;53:284–8. 57. Loprinzi PD. Objectively measured light and moderate-to-vigorous physical
activity is associated with lower depression levels among older US adults. Aging Ment Health. 2013;17:801–5.
58. Yoshiuchi K, Nakahara R, Kumano H, Kuboki T, Togo F, Watanabe E, Yasunaga A, Park H, Shephard RJ, Aoyagi Y. Yearlong physical activity and depressive symptoms in older Japanese adults: cross-sectional data from the Nakanojo study. Am J Geriatr Psychiatry. 2006;14:621–4.
59. Yoshiuchi K, Inada S, Nakahara R, Akabayashi A, Park H, Park S, Shephard RJ, Aoyagi Y. Stressful life events and habitual physical activity in older adults: 1-year accelerometer data from the Nakanojo study. Ment Health Phys Act.
2010;3:23–5.
60. Cerin E, Leslie E, Sugiyama T, Owen N. Associations of multiple physical activity domains with mental well-being. Ment Health Phys Act. 2009;2:55–64. 61. Kull M, Ainsaar M, Kiive E, Raudsepp L. Relationship between low
depressiveness and domain specific physical activity in women. Health Care Women Int. 2012;33:457–72.
62. Richards J, Jiang X, Kelly P, Chau J, Bauman A, Ding D. Don't worry, be happy: cross-sectional associations between physical activity and happiness in 15 European countries. BMC Public Health. 2015;15:53.
64. Newman DB, Tay L, Diener E. Leisure and subjective well-being: a model of psychological mechanisms as mediating factors. J Happiness Stud. 2014;15: 555–78.
65. Vuori IM. Dose-response of physical activity and low back pain, osteoarthritis, and osteoporosis. Med Sci Sports Exerc. 2001;33:S551–86. discussion 609-510
66. Kilpatrick M, Sanderson K, Blizzard L, Teale B, Venn A. Cross-sectional associations between sitting at work and psychological distress: reducing sitting time may benefit mental health. Ment Health Phys Act.2013;6:103–9. 67. Sanchez A, Norman GJ, Sallis JF, Calfas KJ, Rock C, Patrick K. Patterns and
correlates of multiple risk behaviors in overweight women. Prev Med. 2008; 46:196–202.
68. Anderson S, Currie CL, Copeland JL. Sedentary behavior among adults: the role of community belonging. Prev Med Rep. 2016;4:238–41.
69. Healy GN, Clark BK, Winkler EAH, Gardiner PA, Brown WJ, Matthews CE. Measurement of adults’sedentary time in population-based studies. Am J Prev Med. 2011;41:216–27.
70. Smith AL, Biddle SJH. Youth physical activity and sedentary behavior: challenges and solutions. Champaign: Human Kinetics; 2008. 71. Tudor-Locke C, Barreira TV, Schuna JM Jr, Mire EF, Katzmarzyk PT. Fully
automated waist-worn accelerometer algorithm for detecting children's sleep-period time separate from 24-h physical activity or sedentary behaviors. Appl Physiol Nutr Metab. 2014;39:53–7.
72. van Hees VT, Golubic R, Ekelund U, Brage S. Impact of study design on development and evaluation of an activity-type classifier. J Appl Physiol. 2013;114:1042–51.
73. Chow CM, Wong SN, Shin M, Maddox RG, Feilds K-L, Paxton K, Hawke C, Hazell P, Steinbeck K. Defining the rest interval associated with the main sleep period in ActiGraph scoring. Nat Sci Sleep. 2016;8:321–8.
• We accept pre-submission inquiries
• Our selector tool helps you to find the most relevant journal
• We provide round the clock customer support
• Convenient online submission
• Thorough peer review
• Inclusion in PubMed and all major indexing services
• Maximum visibility for your research
Submit your manuscript at www.biomedcentral.com/submit