Received 15 Oct 2015|Accepted 29 Mar 2016|Published 10 May 2016
Altered mGluR5-Homer scaffolds and
corticostriatal connectivity in a
Shank3
complete
knockout model of autism
Xiaoming Wang
1,*, Alexandra L. Bey
2,*, Brittany M. Katz
3, Alexandra Badea
4, Namsoo Kim
5, Lisa K. David
5,
Lara J. Duffney
1,2, Sunil Kumar
3, Stephen D. Mague
5, Samuel W. Hulbert
2, Nisha Dutta
6, Volodya Hayrapetyan
5,
Chunxiu Yu
5, Erin Gaidis
5, Shengli Zhao
2, Jin-Dong Ding
7, Qiong Xu
1,8, Leeyup Chung
1, Ramona M. Rodriguiz
3,
Fan Wang
2, Richard J. Weinberg
9, William C. Wetsel
2,3,6,10, Kafui Dzirasa
3,10, Henry Yin
5,10& Yong-hui Jiang
1,2,10,11Human neuroimaging studies suggest that aberrant neural connectivity underlies behavioural deficits in autism spectrum disorders (ASDs), but the molecular and neural circuit mechanisms underlying ASDs remain elusive. Here, we describe a complete knockout mouse model of the autism-associatedShank3gene, with a deletion of exons 4–22 (De4–22). Both mGluR5-Homer scaffolds and mGluR5-mediated signalling are selectively altered in striatal neurons. These changes are associated with perturbed function at striatal synapses, abnormal brain morphology, aberrant structural connectivity and ASD-like behaviour.In vivorecording reveals that the cortico-striatal-thalamic circuit is tonically hyperactive in mutants, but becomes hypoactive during social behaviour. Manipulation of mGluR5 activity attenuates excessive grooming and instrumental learning differentially, and rescues impaired striatal synaptic plasticity inDe4–22/ mice. These findings show that deficiency of Shank3 can impair mGluR5-Homer scaffolding, resulting in cortico-striatal circuit abnormalities that underlie deficits in learning and ASD-like behaviours. These data suggest causal links between genetic, molecular, and circuit mechanisms underlying the pathophysiology of ASDs.
DOI: 10.1038/ncomms11459 OPEN
1Department of Pediatrics, Duke University, Durham, North Carolina 27710, USA.2Department of Neurobiology, Duke University, Durham, North Carolina 27710, USA.3Department of Psychiatry and Behavioral Sciences, Duke University, Durham, North Carolina 27710, USA.4Department of Radiology, Duke University, Durham, North Carolina 27710, USA.5Department of Psychology and Neuroscience, Duke University, Durham, North Carolina 27710, USA. 6Department of Cell Biology, Duke University, Durham, North Carolina 27710, USA.7Department of Ophthalmology, Duke University, Durham,
D
espite significant progress in identifying genetic defects in autism spectrum disorders (ASDs), the molecular and neural circuit mechanisms that underlie the behavioural impairments remain poorly defined. Genetic studies have consistently identified mutations in genes implicated in synaptic development and function1,2, although no clear consensus has emerged regarding the specific synapse types or brain regions whose dysfunction underlies ASDs. Recent studies suggest that the pathophysiology of ASDs involves not only aberrant synaptic connections but also defective development of neural networks and abnormal neural synchronization3,4. Neuroimaging investigations indicate that ASDs are associated with perturbed neural connectivity5; however, its exact nature remains uncertain6,7. Early studies identified reduced functional connectivity8, whereas recent reports implicate hyper-connectivity in multiple brain regions9,10. Further limiting their interpretability, these studies were conducted primarily in high-functioning ASD patients for whom etiologies are mostly unknown.Mouse models can provide unique insights into the basic biological mechanisms underlying ASDs, but the development of these models is challenging because the biological basis for the majority of ASDs remains unknown11. Moreover, most animal models lack strong construct validity supported by human genetic studies12. SHANK3(PROSAP2)-related mutations represent a unique opportunity to address this challenge13. Genetic defects
of SHANK3 are one of the best replicated findings in autism
genetics14–16. Point mutations typically lead to limited disruption of isoform-specific expression of SHANK3, due to multiple intragenic promoters and alternatively spliced coding exons within the gene17. However, the vast majority of SHANK3
mutations found in ASDs are deletions of the entire gene. Most patients carrying deletions of the entireSHANK3gene in 22q13.3 deletion or Phelan-McDermid syndrome (PMS) have the diagnosis of ASDs16,18,19.
Eleven lines of Shank3 isoform-specific mutant mice, with deletions of different exons or point mutations [De4–7, De4–9 (two lines), De9, De11, De13–16, De21 (two lines) e21InsG3680 (two lines) and e21R1117X], have been reported20–28. These
Shank3mice show variable molecular, synaptic and behavioural phenotypes, likely because different sets of Shank3 isoforms were disrupted in each line. While these data support heterogeneity in the phenotypes of Shank3mutations, most of them lack construct validity because the same exonic deletions have not been reported in humans.
Accordingly, we generatedShank3complete knockout mice, by deleting the protein-coding exons 4–22 (De4–22). Here we present results from molecular, ultrastructural and electrophysiological analyses, high-resolution magnetic resonance histology (MRH), diffusion tensor imaging (DTI) (structural connectomics), in vivo multi-circuit mapping (functional connectomics), behavioural testing and pharmacological analyses of theDe4–22 mice. Together, these data support the significance of these mice as a particularly suitable model forSHANK3-related human neurodevelopmental and neuropsychiatric disorders.
Results
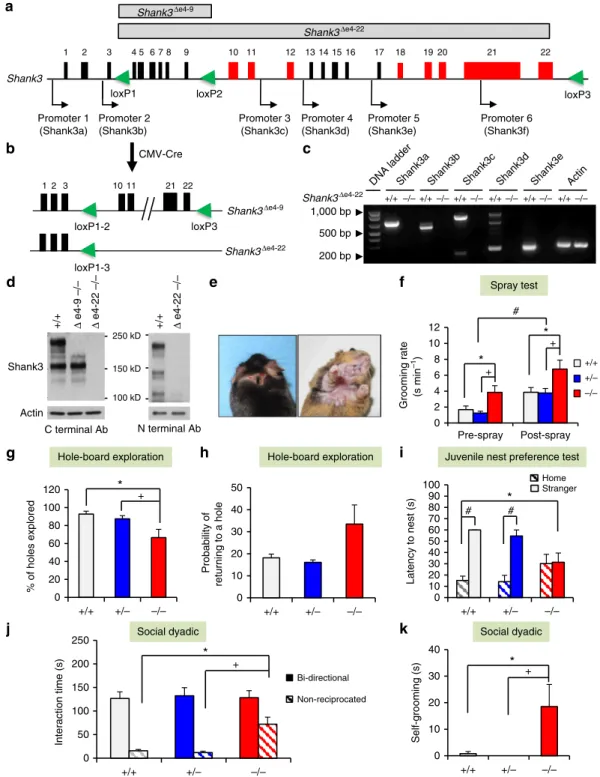
Generation ofShank3complete knockout mice. We and others
have reported several isoform-specific Shank3 mutant mice (Supplementary Fig. 1a). To disrupt all murineShank3isoforms, we adopted a two-step gene targeting and a Cre/loxPstrategy to flox exons 4–22 (e4–22floxed); these exons span 58 kb and include the coding sequences for all Shank3 protein isoforms (Fig. 1a and Supplementary Fig. 1b–e). E4–22floxed mice were bred with CMV-Cre mice to generate mice with deletions of
exons 4–22 (De4–22) (Fig. 1b). Loss of all knownShank3mRNA and protein isoforms in De4–22/ mice was confirmed (Fig. 1c,d and Supplementary Fig. 1f).
After backcrossing to the C57BL/6J strain for more than eight generations, 10 cohorts ofDe4–22 mice were used for behavioural testing (Supplementary Table 1). De4–22 mice were viable, without any gross developmental defects, although ear opening and paw position developmental milestones inDe4–22/pups on postnatal day 4 (P4) were delayed (Supplementary Table 2). The body weights ofDe4–22/ mice were similar to the other genotypes regardless of sex (Supplementary Fig. 1g), and we did not observe spontaneous seizures in these mice. No genotype differences were found in preference for sniffing a social stimulus (Supplementary Table 2). Both genotypes demonstrated habitua-tion-dishabituation to olfactory stimuli; however, responses were less robust forDe4–22/ mice (Supplementary Fig. 1h).
De4–22/ mice display core behavioural features of ASDs.
More than half of De4–22/ mice (16/30) developed skin lesions by 5½ months of age (range: 4–7 months) across three cohorts; no such lesions were seen inDe4–22þ/ (0/30) or De4–22þ/þ(0/29) mice. Lesions were observed around the eyes, on the ears, back of the head, and under the chin of mice on both C57BL/6J and mixed C57BL/6J-129R1 backgrounds (Fig. 1e). These lesions appeared to be caused by excessive self-grooming (Supplementary Movie 1). To examine this propensity in De4–22/ mice that had not developed lesions, we evaluated grooming in the home cage before and after misting with water. Although all mice increased grooming after spraying, the De4–22/ mice engaged in significantly higher rates of grooming, relative to De4–22þ/ and De4–22þ/þ animals (Fig. 1f).
To examine another aspect of repetitive behaviour, mice were tested on the hole-board. While De4–22/ and De4–22þ/ mice engaged in fewer nose-pokes thanDe4–22þ/þ mice, these differences were not significant (Supplementary Table 2). However, De4–22/ mice engaged significantly fewer of the 16 holes (Fig. 1g) than the other genotypes; they also had a greater tendency to re-investigate the same hole (Fig. 1h). Collectively, we find that De4–22/ mice display more repetitive behaviours and they sample their environment in a more restricted pattern thanDe4–22þ/andDe4–22þ/þmice. To evaluate social preferences in neonates, we examined De4–22 juveniles (P15) in a nest-homing test. In a one-way test, the latency to approach a sample of the home nest did not differ among the genotypes (Supplementary Table 2). However, when given a choice between the home nest and an unfamiliar nest sample from a developmentally matched litter’s nest, the De4–22/mice failed to show a preference for home nests, unlikeDe4–22þ/ andDe4–22þ/þ mice (Fig. 1i). In a further examination of social behaviour, we monitored the formation of dominance hierarchies over 6 days where three unfamiliar adults of the same genotype were placed into each cage. Since no sex differences were found (Supplementary Table 2), the data were collapsed across sex. From the number and direction of agonistic behaviours observed within each triad, a dominance ranking was calculated for each mouse. AllDe4–22þ/þ mice established a hierarchy rank by day 1 and this remained stable through day 6. In contrast, 75% of hierarchies of De4–22/ mice were unstable; either dominance was not maintained across days, or no dominant animal could be identified in the triad (w2(1,N¼30)¼19.3,Po0.001).
0 50 100 150 200 250
+/+ +/– –/–
Interaction time (s)
Bi-directional Non-reciprocated
0 10 20 30 40
+/+ +/– –/–
Self-grooming (s)
+
* a
b c
Shank3
1 2 3 4 5 6 9 10 11 12 16 17 18 19 20 21 22
Promoter 1 (Shank3a)
Promoter 5 (Shank3e)
Promoter 6 (Shank3f) Promoter 3
(Shank3c)
Promoter 4 (Shank3d) Promoter 2
(Shank3b)
loxP1 loxP2 loxP3
e
g
CMV-Cre
d
loxP1-2 loxP3
loxP1-3
f Spray test
0 2 4 6 8 10 12
Pre-spray Post-spray
Grooming rate
(s min
–1)
+
*
+
*
#
+/– –/– +/+ +/+ –/– +/+ –/–+/+ –/––/–+/+ –/–+/+ –/–+/+ 1,000 bp
500 bp
200 bp
j Social dyadic k Social dyadic Shank3Δe4-9
Shank3Δe4-22 Shank3Δe4-9
Shank3Δe4-22
Hole-board exploration
0 20 40 60 80 100 120
+/+ +/– –/–
% of holes explored
*
+
h Hole-board exploration
0 10 20 30 40 50
+/+ +/– –/–
Probability of
returning to a hole
0 10 20 30 40 50 60 70 80 90 100
Latency to nest (s)
i Juvenile nest preference test
+/+ +/– –/– Stranger Home
# #
*
Shank3Δe4-22
1 10 22
+
*
250 kD
150 kD
100 kD Actin
Δ
e4-9 –/–
Δ
e4-22 –/–
Δ
e4-22 –/–
+/+
Shank3
C terminal Ab N terminal Ab
+/+
7 8 13 14 15
2 3 11 21 DNA ladderShank3aShank3b Shank3cShank3d Shank3e Actin
Figure 1 | Generation ofShank3complete knockout mice and their ASD-like behaviours.(a) Schematic design forShank3complete knockout mice using a Cre-loxPstrategy. Alternatively spliced exons are in red and promoters are indicated by arrows.loxPsites are green triangles. (b) e4–22floxedmice were
crossed with CMV-Cre mice to generate deletion ofDe4–9 orDe4–22, respectively. (c) All mRNA isoforms ofShank3were deleted inDe4–22/ (/) mice relative toDe4–22þ/þ (þ/þ) mice, as shown by RT–PCR. (d) Western blot shows that all Shank3 protein bands are absent in /
brain, using Shank3 C- and N-terminal antibodies. The experiments were repeated three times. (e) Skin lesions were observed in450% of / mice, but not inþ/þorDe4–22þ/(þ/) mice (w2(2,N¼89)¼38.4,Po0.001). (f)/ mice spent significantly more time in self-grooming (RMANOVA:
genotype F(2,46)¼5.68,Po0.01), relative toþ/þ andþ/mice (pso0.01),n¼15–18/genotype. (g,h) Hole-board exploration. (g) On the hole-board,
/ mice explored fewer holes (pso0.05) than the other genotypes (F(2,21)¼5.64,Po0.02) (h) with the/ mice showing a trend for increased
probability of re-investigating holes (F(2,21)¼2.99,Po0.08);n¼7–8/genotype. (i)/ pups (P15) failed to demonstrate a preference for their home
over a stranger’s nest, whereas þ/þ and / littermates preferred and rapidly entered (pso0.001) their home nest (RMANOVA:
nest-choicegenotype F(2,25)¼4.38,Po0.03);n¼8–10/genotype. (j,k) Responses in the social dyadic test. (j) No genotype differences were detected in
bidirectional contact in the social dyadic test. However, the duration of non-reciprocated interaction was prolonged (pso0.001) in / mice (F(2,37)¼11.30,Po0.001);n¼10–15/genotype. (k) During the social dyadic test, / mice engaged in more self-grooming (F(2,37)¼4.99,Po0.02)
(Supplementary Fig. 2a); no genotype differences were discerned in the duration or numbers of contacts with the non-social and social stimuli across all test phases (Supplementary Table 2). To evaluate social behaviour in a novel environment more critically, we conducted social dyadic tests. In pairings of De4–22 males with age-matched C3H males, the time spent in and the numbers of bidirectional interactions did not differ among the genotypes; the mice only displayed mild social investigations characterized by approach behaviours and sniffing of the head, face, anogenital and shoulder areas of the partner mouse (Fig. 1j and Supplementary Table 2). However, De4–22/ mice engaged in longer and greater numbers of non-reciprocated behaviours (where theShank3mouse initiated the social interaction, but the C3H partner did not reciprocate and disengaged its partner by ignoring, leaving, or turning away from the target mouse) than the other genotypes (Fig. 1j and Supplementary Table 2). Moreover,De4–22/ animals engaged in more self-grooming during the social test than didDe4–22þ/þ orDe4–22þ/mice (Fig. 1k). Thus theDe4–22/mice have normal levels of social interest, but they persist in unsuccessful efforts to engage the social partner, and they engage in non-social behaviours that include repetitive self-grooming behaviours during social encounters.
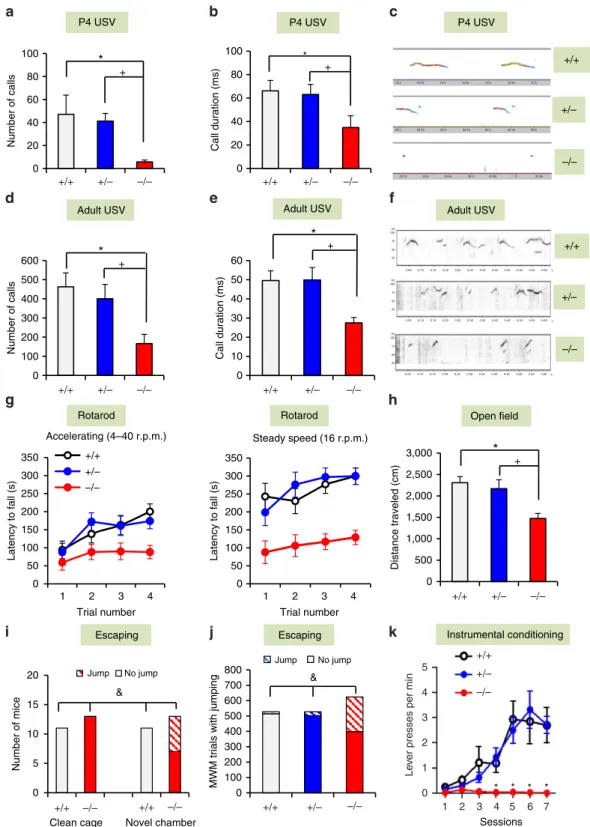
Ultrasonic vocalizations (USVs) were assessed in both pups and adults, as communication impairments represent a major feature of SHANK3-related disorders and ASDs. The P4 De4–22/ pups emitted significantly fewer USVs that were of shorter duration than De4–22þ/ and De4–22þ/þ pups (Fig. 2a–c). Although the frequencies and amplitudes of calls fromDe4–22/mice were lower than the other two genotypes (Supplementary Fig. 2b,c), all USVs were within a range appropriate for pup distress calls29. Upon exposure to oestrous females, De4–22/ adult males emitted fewer calls, and their calls were significantly shorter in duration and reduced in amplitude relative to the other genotypes (Fig. 2d–f and Supplementary Table 2). By comparison, no genotype differences were observed in the peak frequency of adult USVs (Supplementary Table 2).
De4–22/ comorbidities phenocopy SHANK3 patients.
Motor performance inDe4–22/ mice was deficient on both the accelerating and steady-speed rotarod tasks (Fig. 2g), despite normal grip strength (Supplementary Table 2). In their home cages, we observed that De4–22/ mice were hypoactive. This response was confirmed in the open field, where they showed reduced locomotion (Fig. 2h) and a tendency towards decreased rearing (Supplementary Table 2). De4–22/ mice also displayed reduced locomotion and spent less time in the centre of the open field compared with the other genotypes (Supplementary Fig. 2d and Supplementary Table 2). In the light– dark emergence test,De4–22/ mice delayed their entry into the lighted chamber (Supplementary Fig. 2e) and made fewer transitions between chambers than the other genotypes (Supplementary Fig. 2f). Collectively, these results suggest that De4–22/ mice present with anxiety-like behaviours.
While habituating mice to arenas for the novel object recognition memory test, manyDe4–22/mice tried to escape from the test chamber. Since we did not observe escape responses in their home cages, we hypothesized that novelty was inducing this behaviour. When mice were placed individually into clean home cages, no escape behaviour was observed (Fig. 2i). However, when the mice were transferred to a novel larger arena, one-half of theDe4–22/ mice escaped; noDe4–22þ/þ mice engaged in this response. Similarly, during testing in the Morris water maze, we found that De4–22/ mice leapt from the hidden
platform and away from the experimenter on more trials than the other genotypes (Fig. 2j). This behaviour may be similar to the enhanced reactivity to novel environments reported in
SHANK3-related ASD patients15,18,19.
Cognitive performance was examined using several different paradigms. Pre-attentive function was unchanged when analysed by prepulse inhibition, but startle reactivity was reduced inDe4– 22/ compared with the De4–22þ/þ mice (Supplementary Table 2). Hippocampal function was evaluated with the Morris water maze. De4–22/ mice showed normal acquisition performance (Supplementary Fig. 2g), but displayed slower reversal learning when the hidden platform was moved from the northeast to the southwest quadrant (Supplementary Fig. 2h). During probe trials,De4–22/ mice were impaired in locating the target quadrant, compared with the other genotypes (Supplementary Fig. 2i–k). In the visible platform task, swim time did not differ among genotypes (Supplementary Table 2), indicating that sensory and motor function and motivation were intact. In fear conditioning, no significant genotype differences were noted for cued conditioning, although De4–22/ mice showed a small enhancement in freezing during contextual testing (Supplementary Table 2). Since Shank3 is enriched in the striatum (Supplementary Fig. 6a),De4–22 mice were examined in a striatal-dependent instrumental learning task30. Each bar-press was reinforced with a food pellet across seven sessions. The De4–22/ mice were unable to learn this task, showing a dramatic deficit after the second training session (Fig. 2k). In summary, we find that fear learning is intact in De4–22/ mice, whereas hippocampal spatial memory is mildly perturbed, and striatal learning is severely impaired.
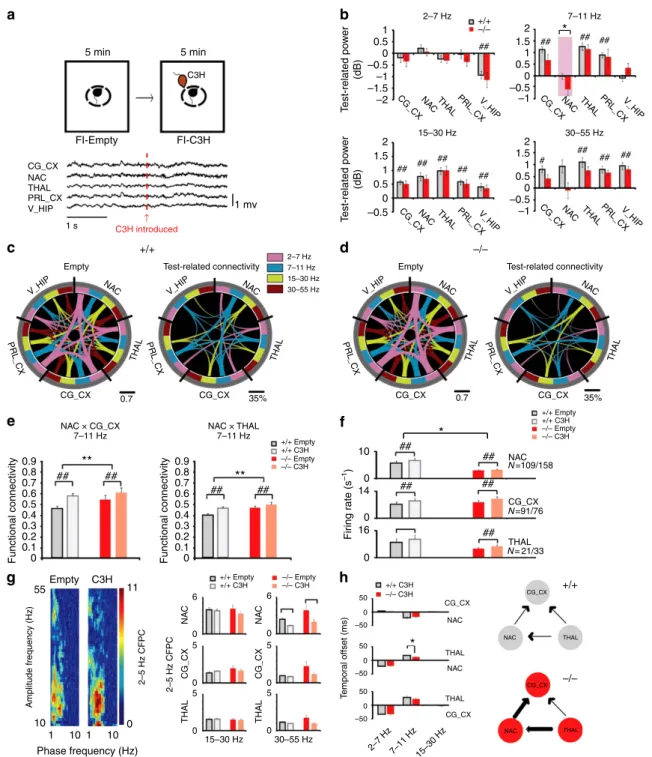
Altered functional connectivity in a frontostriatal circuit.
Alterations in brain oscillatory function and global network connectivity have been proposed to mediate ASDs7,31. To test whether Shank3 disruption was sufficient to alter oscillatory activity across limbic networks, De4–22þ/þ and De4–22/ mice were implanted with microwire arrays into the prelimbic cortex (PRL_CX), cingulate cortex (CG_CX), medial dorsal nucleus of thalamus (THAL), ventral hippocampus (V_HIP), and nucleus accumbens (NAC). The NAC was targeted forin vivo
analysis instead of the dorsolateral striatum (DLS) because the NAC is the projection target of the CG_CX, and this latter brain region is heavily involved in social behaviours32. Following surgical recovery, local field potentials (LFP) and single-unit activities were recorded before and after exposure to a novel mouse as a test for social responsiveness (Fig. 3a).
0 10 20 30 40 50 60
Call duration (ms)
0 100 200 300 400 500 600
Number of calls
Adult USV
+/+
+/–
–/– 0
20 40 60 80 100
Call duration (ms)
+/+
+/–
–/– 0
20 40 60 80 100
Number of calls
P4 USV P4 USV
Adult USV P4 USV
Adult USV
+ + * +
*
+
*
*
0
1 2 3 4 50
100 150 200 250 300 350
Latency to fall (s)
Trial number
1 2 3 4 Trial number Accelerating (4–40 r.p.m.)
+/+ +/– –/–
0 500 1,000 1,500 2,000 2,500 3,000
Distance traveled (cm)
+
*
Rotarod Rotarod Open field
0 50 100 150 200 250 300 350
Steady speed (16 r.p.m.)
Latency to fall (s)
Escaping Escaping
0 5 10 15 20
Number of mice
Jump No jump
Jump No jump
Novel chamber &
0 100 200 300 400 500 600 700 800
MWM trials with jumping
&
* * * * +/+ +/– –/–
+/+ +/– –/–
+/+ +/+
+/+
+/+
–/– +/– 1 2 3 4 5 6 7
+/–
–/– –/–
–/–
+/+ +/– –/–
+/+ +/– –/– +/+ +/– –/–
70.2
90.3
20.75 20.8 20.85 20.9 20.95 21 20.05
90.35 90.4 90.45 90.5 90.55 90.6
70.25 70.3 70.35 70.4 70.45 70.5
Hz 100 75 50 25
0.05 0.10 0.15 0.20 0.25 0.30 0.35 0.40 0.45 0.50 0.55 0.60s Hz
100 75 50 25
0.05 0.10 0.15 0.20 0.25 0.30 0.35 0.40 0.45 0.50 0.55 0.60s
Hz 100 75 50 25
0.05 0.10 0.15 0.20 0.25 0.30 0.35 0.40 0.45 0.50 0.55 0.60s
Clean cage
5
4
3
2
1
0
Le
v
e
r presses per min
Instrumental conditioning
Sessions a
d
g
b
e
i j k
c
f
h
Figure 2 |De4–22/mice display additional ASDs-related and comorbid behaviours.(a–f) Abnormal USV communication. P4De4–22/ (/) pups emitted significantly fewer USVs (a) (F(2,32)¼7.29,Po0.003) and of shorter duration (b) (F(2,29)¼4.59,Po0.02), than the other genotypes (pso0.01).
(c) Representative spectrographs of P4 USVs;n¼8–13/genotype. Upon exposure to females, adult/males emitted fewer USVs (d) (F(2,38)¼6.15,Po0.01)
that were of significantly shorter duration (e) (F(2,34)¼7.12,Po0.01) than the other genotypes (pso0.02). (f) Representative spectrographs of adult USVs;
n¼10–18/genotype. (g,h) Impaired motor performance. (g) On the accelerating rotarod (left) / mice had shorter latencies to fall (RMANOVA: genotype effect F(2,27)¼5.33,Po0.02) than the other genotypes (pso0.01). On the steady-speed rotarod (right),/ mice also fell sooner (RMANOVA: genotype
effect F(2,27)¼15.86,Po0.001) than the other genotypes (pso0.005);n¼9–12/genotype. (h) Hypoactivity in the open field. / mice had reduced
locomotion (F(2,23)¼6.04,Po0.01) relative to the other genotypes (pso0.001);n¼6–10/genotype. (i,j) Escape behaviours in different environments. (i) No
mice escaped from new home cages. However, six out of 13/ mice escaped from a novel environment (w2(1, N¼24)¼6.77,Po0.01);n¼11–13/genotype.
(j) In the MWM,/ mice escaped from the hidden platform on significantly more trials than the other genotypes (w2
(2,N¼1,680)¼314.01,Po0.001);
n¼11–13/genotype. (k) Impaired instrumental learning. / mice had difficulty learning to press a lever for food reward (RMANOVA: genotype effect F(2,102)¼4.7,Po0.05, genotypesession F(12, 102)¼3.0,Po0.001) relative to the other genotypes (pso0.001);n¼4–8/genotype. For all panels, *Po0.05
+/+ –/– 5 min 5 min
C3H FI-C3H FI-Empty CG_CX NAC THAL PRL_CX V_HIP
1 s C3H introduced↑
1 mv 1 2 0.5 1.5 –0.5 0.5 –1 0 –1.5 –0.5 –2 –1 0 1 2 2 1.5 1.5 0.5 0.5 0 0 –0.5 –0.5 1 1 –1 T est-related po w e r (dB) T est-related po w e r (dB) 2–7 Hz
15–30 Hz 30–55 Hz
7–11 Hz +/+ ## ## ## ## # ## ## ## ## ## ## ## ## –/– *
CG_CXNA CG_CX
CTHAL PRL_CXV_HIP
CG_CXNA
CTHAL PRL_CXV_HIP
CG_CXNA
C THAL PRL_CXV_HIP
NA
CTHAL PRL_CXV_HIP
Empty Test-related connectivity Empty Test-related connectivity
CG_CX 0.7 35% 0.7 35%
V_HIP PRL_CX NA C THAL CG_CX V_HIP PRL_CX NA C THAL CG_CX V_HIP PRL_CX NA C THAL CG_CX V_HIP PRL_CX NA C THAL 2–7 Hz 7–11 Hz 15–30 Hz 30–55 Hz
NAC × CG_CX NAC × THAL
+/+ Empty
+/+ Empty –/– Empty –/– Empty +/+ C3H
–/– C3H
+/+ C3H –/– C3H
CG_CX CG_CX CG_CX CG_CX –/– C3H 50 –50 NAC NAC NAC NAC THAL THAL THAL THAL 0 50 –50 0 50 –50 0 +/+ C3H +/+ Empty –/– Empty +/+ C3H –/– C3H
7–11 Hz 7–11 Hz
Functional connectivity 0.9 0.8 0.7 0.6 0.5 0.4 0.3 0.2 0.1
0 Functional connectivity
0.9 0.8 0.7 0.6 0.5 0.4 0.3 0.2 0.1 0 ** ** ## ## ## ## ## ## ## NAC CG_CX THAL N=109/158 N=91/76
N= 21/33 ## ## 10 14 Fir ing r a te (s –1) 16 0 0 0 Empty 55 10
1 10 1 10 0 11 C3H
Amplitude frequency (Hz)
2–5 Hz CFPC
2–5 Hz CFPC
T
empor
al offset (ms)
6 NA C CG_CX THAL THAL CG_CX NA C 0 5 0 5 0 15–30 Hz
2–7 Hz 7–11 Hz15–30 Hz
30–55 Hz 5 0 5 0 6 0 * +/+ –/– * a c e g h b d f
Phase frequency (Hz)
Figure 3 | Aberrant functional neural connectivity inDe4–22 mice.(a) Schematic representation of the forced social interaction test (top). A 4 s trace of LFP activity inDe4–22 mice, recorded before and following introduction of the C3H social stimulus mouse (arrow at bottom). (b) Test-related changes in oscillatory power inDe4–22/ (/) andDe4–22þ/þ (þ/þ) littermates. (Mixed model ANOVA genotypetest–condition interaction (see
Supplementary Table 3)). *Po0.05, þ/þ versus/mice,#Po0.05, comparisons within genotype. (c,d) Diagrams showing functional connectivity across the recorded brain areas before and after introduction of the social stimulus mouse in þ/þ (c) and / (d) mice. The thickness of the connecting lines corresponds to the coherence between each pair of brain areas in the specified frequency band. The image on the right shows the change in coherence observed across the network following introduction of the social stimulus mouse. Only coherence measures that demonstrated significant test–condition interactions are shown. (e) Significant genotype by test–condition interaction identified in the social-related network using mixed model ANOVA. **Po0.05, for significant genotype effect,þ/þversus /mice (FDR-corrected);##Po0.01, within genotype comparison (FDR-corrected)
(see Supplementary Table 3). (f) Effects of genotype and test–conditions—in unit firing rates (mixed model ANOVA, genotypetest–condition interaction (see Supplementary Table 3)). *Po0.05, for significant genotype effect,þ/þ versus/mice;##Po0.05, for test–condition effects within genotype.
(g) LFP phase-amplitude coupling (CFPC) in þ/þ and / mice. LFP-b(15–30 Hz) and -g(30–55 Hz) oscillatory activities were modulated by the phase of locally recorded 2–5 Hz oscillations. An example of CFPC across a single NAC channel is shown during the forced interaction test (left). Effects of genotype and test–conditions in CFPC (right) (mixed model ANOVA, genotypetest–condition interaction (see Supplementary Table 3)).##Po0.05, for
De4–22þ/þ mice. We conclude thatShank3deficiency results in hyperactivation of this social neural network under basal conditions, whereas the gain induced by the social stimulus is diminished inDe4–22/ mice.
Aside from abnormal network activity,De4–22/ mice also displayed lower unit firing rates in NAC both before and after introduction of the social stimulus (Fig. 3f). No genotype differences were observed in cross-frequency phase coupling or phase lock of unit responses (two measures of local connectivity) within the cortical, striatal and thalamic microcircuits (Fig. 3g and Supplementary Fig. 3). We quantified directional oscillatory interactions during the social stimulus presentation, as a measure of information transfer across the cortico-striatal-thalamic circuit. In both De4–22/ and De4–22þ/þ mice, oscillatory synchrony was directed from thalamus to cortex and striatum in the 7–11 Hz frequency band; however, the temporal delay between thalamic to striatal oscillatory activity was diminished in theDe4–22/ animals (Fig. 3h).
NAC firing deficit is due to localShank3disruption. The NAC
firing deficit observed in theDe4–22/ mice could result from developmental influences ofShank3disruption on NAC function, changes in the function of NAC inputs from other brain regions (for example, hippocampus), or a direct change in the firing properties of NAC independent of development. To examine directly these possibilities, we used e4–22floxedmice (Fig. 1a). We bilaterally infected the NAC of these e4–22floxed mice with an AAV10-Cre virus to selectively knockdown Shank3 in the NAC; an AAV10-GFP virus served as the control (Supplementary Fig. 4a). Four weeks after injections, these mice were surgically implanted with recording electrodes in NAC and unit activity was recorded during the baseline period of the social stimulus probe test. The reduced Shank3 expression, locations of viral infection (Supplementary Fig. 4b) and NAC electrode placement (Supplementary Fig. 4c) were verified post mortem. We found that the mice treated with AAV10-Cre exhibited significantly lower firing rates in the NAC than AAV10-GFP controls (Supplementary Fig. 4d). Thus, these results provide direct evidence that selective deficiency of Shank3 in the NAC is sufficient to reduce the firing rate of medium spiny neurons (MSNs), recapitulating the phenotype observed in the De4–22/ mutants.
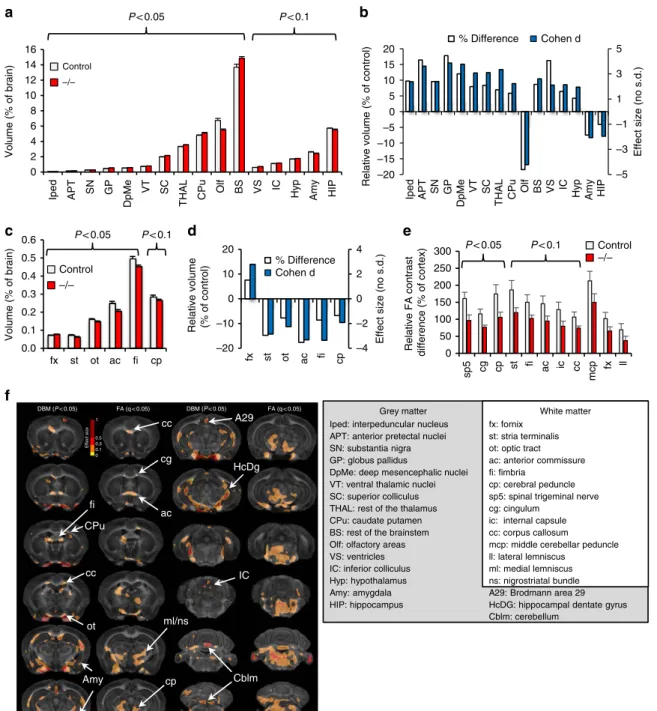
Altered brain morphometry and structural connectivity. To
probe anatomic changes that might underlie the observed impairments in behaviour and functional connectivity, we imaged fixed brains of seven adult De4–22/ and seven C57BL/6J controls, using high-field MRH and a high-resolution (43mm) DTI protocol33,34. Quantitative analysis revealed slightly larger brains inDe4–22/ mice (472.5±19.7 mm3; M±s.e.m.) than in controls (459.7±15.7 mm3); however, this did not reach statistical significance. After normalizing regional to total brain volume, multiple grey matter structures were found to differ between De4–22/ and control mice (Fig. 4a,b and Supplementary Table 5). The basal ganglia (globus pallidus, 17.8%; substantia nigra, 9.6%; and caudate putamen, 5.9%) and thalamus (ventral thalamic nuclei, 8.7%; rest of the thalamus, 7.0%) were enlarged, while the olfactory areas (18.5%), hippocampus (4.1%), and amygdala (7.7%) were smaller in theDe4–22/ mice. With the exception of the fornix, all the other five white matter tracts had reduced volumes relative to controls (Fig. 4c,d).
To gain insight into white matter integrity, we performed DTI, comparing fractional anisotropy (FA) contrast between white matter tracts and the cortex in both genotypes. Qualitative
evaluation of FA images showed reduced intensity in white matter relative to grey matter in De4–22/ mice, compared with controls (Supplementary Fig. 5a). Significant reductions were identified for the spinal trigeminal tract, cingulum, and the cerebral peduncle (Fig. 4e and Supplementary Fig. 5b). We further examined how changes in FA contrast (normalized to cortex) correlated across various fibre tracts throughout the brain (Supplementary Fig. 5c). Significant correlations were found for white matter tracts in De4–22/ mice (48 versus 32 correlational pairs in controls).
Voxel-based morphometry confirmed the regional results and revealed additional areas of volume loss in theDe4–22/mice. The effect size is shown as a texture map overlaid on the average template for the control group (Fig. 4f). Corrected
P values using all brain voxels exceeded the 5% false discovery rate threshold (FDR). Areas exhibiting significant FA reductions (after FDR correction) included the genu of the corpus callosum and cingulum, the anterior commissure, fimbria, optic tract, areas around the medial lemniscus and nigrostriatal bundles, as well as the cerebral peduncle, cerebellum and brainstem. We detected a unilateral change in the internal capsule, implying an asymmetric change in white matter resulting fromShank3deficiency.
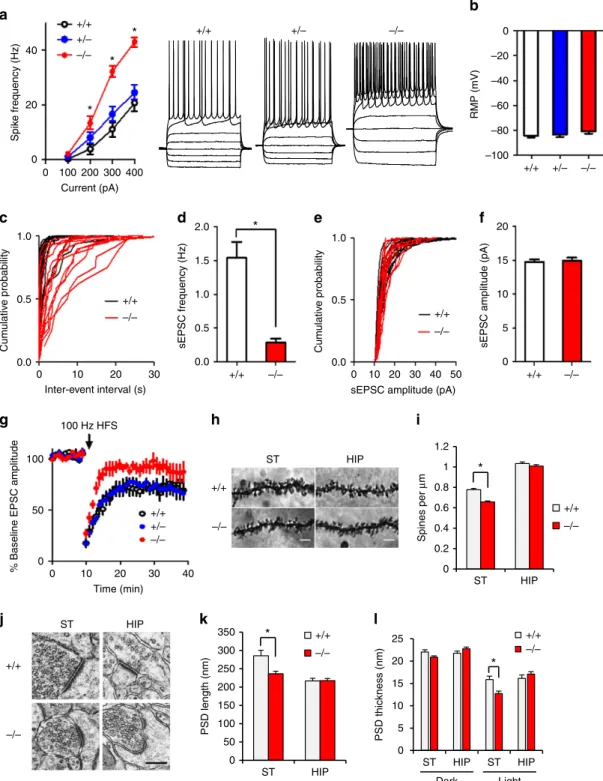
Dysfunctional striatal synapses. Our functional and structural
connectivity results suggest that striatal circuitry may be dysfunctional in De4–22/ mice. Accordingly, synaptic function was examined in acute striatal slices. We used whole-cell patch-clamp recordings to assess excitatory synaptic transmission in the DLS, which receives strong projections from sensorimotor cortical regions and has been implicated in habit formation and compulsive behaviour35. First, we characterized the intrinsic excitability of MSNs by measuring spike frequency in response to depolarizing steps of current injection. De4–22/ MSNs showed enhanced excitability, compared with De4–22þ/ and De4–22þ/þ neurons (Fig. 5a), while no genotype difference was observed for resting membrane potential (Fig. 5b). De4–22/ mice displayed a marked reduction in the frequency of spontaneous excitatory postsynaptic currents (sEPSCs) (Fig. 5c,d), consistent with decreased spine density and number of glutamatergic synapses on MSNs in these mice. In contrast, the mean sEPSC amplitude was not affected byShank3
deficiency (Fig. 5e,f). We used high-frequency stimulation (HFS) -induced long-term depression (LTD) to probe synaptic plasticity. LTD was significantly reduced in De4–22/ mice, compared with the De4–22þ/þ and De4–22þ/ mice (Fig. 5g). These results indicate that multiple aspects of synaptic function are impaired inDe4–22/ striatal neurons.
Changes in synaptic organization in De4–22/ mice. These
abnormalities in synaptic function inDe4–22/striatum led us to investigate possible underlying morphological changes in synapses. Golgi staining revealed that spine density in the striatum of De4–22/ mice was reduced, but not in the hippocampus (Fig. 5h,i). Electron microscopic examination showed that the postsynaptic density (PSD) was significantly shorter and thinner in striatal synapses ofDe4–22/compared withDe4–22þ/þ mice (Fig. 5j–l). There was a similar trend for smaller PSD structures in hippocampal and cortical synapses (data not shown for cortical synapses).
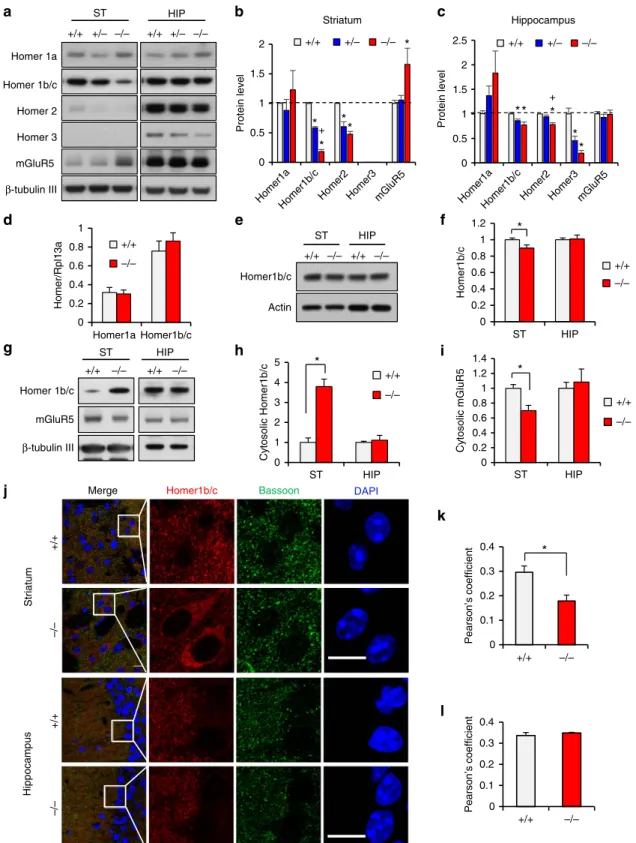
De4–22/ mice were for the Homer family proteins (Fig. 6a–c). Homer1b/c was markedly decreased (18% of
þ/þ) in striatum and mildly reduced in hippocampus (77% of þ/þ) relative toDe4–22þ/þ mice. There was no significant change for Homer1a in either brain region. In the De4–22/ mice, Homer2 was significantly decreased in both brain areas (48% of þ/þ in striatum; and 78% of þ/þ in hippocampus).
Homer3 (the least abundant isoform) was undetectable in striatum, but was reduced in the De4–22/ hippocampus (20% of þ/þ). Unexpectedly, we found that mGluR5 was substantially increased in striatum (165% of þ/þ), but not in De4–22/ hippocampus. These results indicate region-specific alterations in PSD proteins in De4–22/ brains, especially in the striatum.
Olf
0 50 100 150 200 250 300
sp5 cg cp st
fi
ac ic cc
mcp
fx ll
0.0 0.1 0.2 0.3 0.4 0.5 0.6
fx st ot ac fi cp
Volume
(% of brain)
–4 –2 0 2 4
–20 –10 0 10 20
fx st ot ac fi cp
Effect size (no s.d.)
Relative volume (% of control)
% Difference Cohen d 0
2 4 6 8 10 12 14 16
P< 0.05 P< 0.1
Volume
(% of brain)
Control
P< 0.05 P< 0.1
P< 0.05 P< 0.1
fi CPu
cc
ot
Amy
cc cg
ac
ml/ns
A29
HcDg
IC
cp Cblm
b a
c d e
–/–
–5 –3 –1 1 3 5
–20 –15 –10 –5 0 5 10 15 20
Effect size
(no
s.d.)
Relative volume
(%
of
control)
% Difference Cohen d
HIP
Iped APT SN GP
DpMe
VT SC
TH
A
L
CPu BS VS IC Hy
p
Amy Iped APT SN GP HIP
DpMe
VT SC
TH
A
L
CPu Olf BS VS IC Hy
p
Amy
f
Iped: interpeduncular nucleus APT: anterior pretectal nuclei SN: substantia nigra GP: globus pallidus
DpMe: deep mesencephalic nuclei VT: ventral thalamic nuclei SC: superior colliculus THAL: rest of the thalamus CPu: caudate putamen BS: rest of the brainstem Olf: olfactory areas VS: ventricles IC: inferior colliculus Hyp: hypothalamus Amy: amygdala HIP: hippocampus
fx: fornix st: stria terminalis ot: optic tract ac: anterior commissure fi: fimbria
cp: cerebral peduncle sp5: spinal trigeminal nerve cg: cingulum
ic: internal capsule cc: corpus callosum mcp: middle cerebellar peduncle ll: lateral lemniscus
ml: medial lemniscus ns: nigrostriatal bundle A29: Brodmann area 29 HcDG: hippocampal dentate gyrus Cblm: cerebellum
Grey matter White matter
Control –/–
Control –/–
Relative FA contrast difference (% of cortex)
DBM (P< 0.05) FA (q < 0.05) DBM (P< 0.05)
1
0.5 0.3 0.1 0
Effect size
FA (q < 0.05)
Figure 4 | Abnormalities in brain structure inDe4–22/mice.(a,b) Volume changes in grey matter ofDe4–22 mice. (a) Significant volume differences
in several brain regions (normalized to total brain volume) were observed inDe4–22/(/) mice, relative to controls.t-test,n¼7 mice/genotype. (b) These differences are also apparent when the data are expressed as relative volume (shown as percentage of control) or Cohen’s d changes, where positive values represent enlargement and negative values represent reduction in/ mice. (c,d) Volume changes were observed in white matter tracts.
–/– a
c d e f
g
b
ST HIP
0 0.2 0.4 0.6 0.8 1 1.2
+/+
–/–
Spines per
μ
m *
ST HIP
h i
0 5 10 15 20 25
ST HIP ST HIP +/+ –/–
Dark Light
PSD thickness
(nm) *
l
0 50 100 150 200 250 300
350 +/+
–/–
PSD length (nm)
*
ST HIP k
j ST HIP
+/+
–/– 40
–40 –20
–60
–80
–100
20
15
10
5
0 0
Spik
e frequency (Hz)
Cum
ulativ
e probability
Cum
ulativ
e probability
sEPSC frequency (Hz) sEPSC amplitude (pA)
% Baseline EPSC amplitude
sEPSC amplitude (pA)
RMP (mV)
* *
* *
20
0
1.0 2.0
1.5
1.0
0.5
0.0 0.5
0.0
100
50
0
0 10 20 Time (min)
30 40 0 10
100 Hz HFS 20 Inter-event interval (s)
30 0 100200300 400
Current (pA) +/– –/– +/+
+/+
–/– +/+
–/– +/+
–/– +/+
+/–
1.0
0.5
0.0
0 10 20 30 40 50 –/– +/+
–/– +/+ –/–
+/+
+/–
–/– +/+ +/–
Figure 5 | Electrophysiological characterization of striatal medium spiny neurons inDe4–22 mice.(a) Spike frequency in response to current injection.
De4–22/ (/) neurons showed enhanced excitability with 200–400 pA injected current (*Po0.05) compared withDe4–22þ/ (þ/) andDe4–22þ/þ (þ/þ) neurons (F(3, 267)¼242.8,Po0.0001);n¼28–32 neurons/genotype. (b) No genotype differences in RMPs were observed;
n¼28–32/genotype. (c,d) The frequency of sEPSCs was significantly reduced in /neurons; *Po0.001,t-test,n¼13–14/genotype. (e,f) The sEPSC amplitude was not altered in / neurons;n¼13–14/genotype. (g) HFS-induced LTD was impaired in / neurons; (planned comparison,t-test,
Po0.05 for mice þ/þ,Po0.01 for þ/, andp40.05 for / mice;n¼8–12/genotype). (h) Sample images of Golgi-impregnated neurons in striatum (ST) and CA1 area of hippocampus (HIP) from / and þ/þmice. Scale bar: 5mm. (i) A decrease in spine density was found in striatum of
Altered cellular distributions of Homer1b/c and mGluR5. We next examined the possible mechanism by which synaptic Homer1b/c was reduced. The mRNA levels for Homer1a and Homer1b/c in De4–22/ striatum and hippocampus were similar to þ/þ controls (Fig. 6d). Although total Homer1b/c protein was slightly decreased inDe4–22/ striatum (Fig. 6e,f), this is unlikely to explain the drastic reduction of Homer1b/c in the PSD. Sub-fractionation studies revealed a marked increase of Homer1b/c in the cytosolic fraction from De4–22/ striatum (379% of þ/þ), while that in the hippocampus was similar to controls (Fig. 6g,h). In contrast, striatal cytosolic mGluR5 was decreased (70% of þ/þ), with no genotype differences in the hippocampus (Fig. 6i). Homer1b/c was also examined inDe4–9 mice. The decreased expression of Homer1b/c in the PSD and the cytosolic accumulation of this protein in De4–9/ striatum were less prominent than in De4–22/ mice (Supplementary Fig. 6c,d,f,h).
The increase in cytosolic Homer1b/c inDe4–22/ striatum was confirmed by Homer1b/c immunostaining of striatal neurons (Fig. 6j). Similar changes were observed in the NAC but not in the hippocampus or neocortex (Supplementary Fig. 6e,g). Conversely, the co-localization of Homer1b/c with the presynaptic marker Bassoon was significantly decreased in De4–22/ striatum, consistent with decreased Homer1b/c in the PSD (Fig. 6k,l). Homer 1b/c immunostaining completely overlapped with the neuronal marker NeuN (Supplementary Fig. 7g), but only partially overlapped in dopamine D1 receptor (D1R) labelled neurons (defined by D1-td-Tomato) (Supplementary Fig. 7h). Since the striatum is composed primarily of MSNs containing either D1Rs or D2Rs, our findings suggest that mGluR5-Homer scaffolds are likely altered in both D1R- and D2R-positive MSNs.
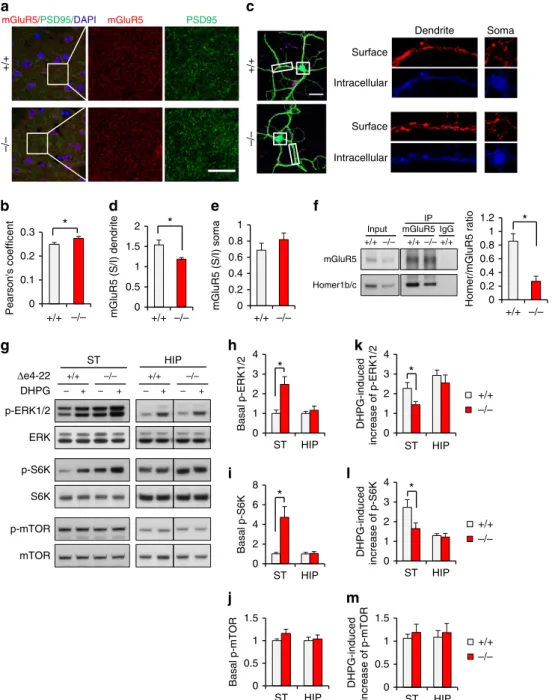
Altered mGluR5/ Homer1 organization in striatal synapses.
To corroborate the increased mGluR5 in striatal PSDs, we immune-stained for mGluR5 and PSD-95 in striatal slices. Co-localization studies revealed their increased association in De4–22/ mice (Fig. 7a,b), supporting the biochemical evidence for elevated mGluR5 in synapses. Using an antibody recognizing the extracellular domain of mGluR5, we found that that surface mGluR5s were unchanged in cortical-striatal neuronal co-cultures (Supplementary Fig. 7a–d). However, the ratio of surface to intracellular mGluR5 was reduced in De4–22/ MSN dendrites but not in soma (Fig. 7c–e), suggesting a selectively increased intracellular pool of mGluR5.
The aforementioned mislocalization of Homer1b/c and mGluR5 likely causes disruption of the mGluR5-Homer scaffold, and this is supported by the reduced interaction of Homer1b/c and mGluR5 inDe4–22/ striatum (Fig. 7f). To further test if mGluR5-mediated signalling was altered, we examined the phosphorylation state of several kinases in the mGluR5-mediated pathway from De4–22/ striatal and hippocampal slices. (Fig. 7g). Under the baseline condition, levels of p-ERK1/2 and p-S6K were significantly elevated in De4–22/ striatum, but not in hippocampus (Fig. 7h,i). Activation of mGluR5 with the selective group I metabotropic agonist (S)-3,5-dihydroxyphenyl-glycine (DHPG) enhanced levels of p-ERK1/2 and p-S6K in the striatum in both genotypes. However, the DHPG-induced increase (fold change) of ERK1/2 and S6K phosphorylation was less apparent inDe4–22/striatum (Fig. 7k,l), suggesting a weaker ligand-dependent response for mGluR5. By contrast, there was no genotype difference in p-mTOR level in De4–22 striatum and hippocampus before or after DHPG treatment (Fig. 7j,m). Since mGluR5 signalling regulates protein synthesis in hippocampus36, we also evaluated protein synthesis in De4–22/ striatum. No genotype difference was observed
(Supplementary Fig. 7e,f), though cell type-specific changes cannot be excluded. These results suggest that mGluR5 function may be enhanced at baseline, but the ligand-dependent response of mGluR5 is attenuated in the De4–22/ striatum.
mGluR5 modulators correct impaired behaviour and LTD. The
reduced association of mGluR5 with Homer1b/c suggests that mGluR5-related function may be compromised, whereas the increased mGluR5 in the PSD raises the possibility that mGluR5-mediated functions may be augmented in the De4–22/ striatum. To determine whether these changes may mediate some of the abnormal behaviours in De4–22/ mice, we performed behavioural analysis in mice treated with a mGluR5 antagonist (MPEP) or a positive allosteric modulator of mGluR5 (CDPPB). The hypoactivity in the open field in the De4–22/ mice was normalized with MPEP; this compound also suppressed the increased self-grooming (Fig. 8a,c). In contrast, CDPPB failed to alter the hypoactivity, while it augmented self-grooming in De4–22/ mice (Fig. 8b,d). The inverse effects of MPEP and CDPPB on grooming behaviour support the hypothesis that enhanced mGluR5 function contributes to the elevated self-grooming inDe4–22/ mice.
We had found instrumental learning to be profoundly impaired inDe4–22/ mice (Fig. 2k). Since there is evidence for reduced mGluR5 function in De4–22/ mice and CDPPB has been reported to rescue impaired learning inShank2 mutant mice37, we reasoned that positive allosteric modulation of mGluR5 might restore the impaired instrumental learning. Indeed, we found that CDPPB treatment partially rescued instrumental learning inDe4–22/ mice (Fig. 8e–h).
We also tested the effects of CDPPB on synaptic function and neuronal excitability in striatal slices. CDPPB rescued the impaired LTD (Fig. 8i) but it did not change the probability of presynaptic release (PPR) in De4–22/ mice (Fig. 8j). In addition, CDPPB did not change the frequency or amplitude of sEPSCs, and it failed to affect the resting membrane potential (Supplementary Fig. 8a–c). CDPPB also reduced the hyper-excitability in MSNs of De4–22/ mice. However, a similar reduction in excitability was observed in De4–22þ/þ neurons, suggesting that this rescue effect may not be specific (Fig. 8k).
Since Homer1b/c is an important mediator in the mGluR5 signalling pathway, we next examined whether there was any relationship between synaptic Homer1b/c and lever pressing in De4–22/ mice. After 7 days of lever-press training, we found that those mutants with increased numbers of lever presses had significantly higher levels of Homer1b/c in their striatal PSDs than those with lower lever-press rates (Fig. 8l). We also observed that 7 days of treatment with CDPPB resulted in a slight increase of synaptic Homer1b/c inDe4–22/mice (Fig. 8m), consistent with the partial rescue of lever pressing by this compound. These data suggest that the disruption of mGluR5-Homer scaffolds, due to the reduction of Homer1b/c, may contribute to the impaired instru-mental learning and striatal plasticity in theDe4–22/ mice.
Discussion
0 0.2 0.4 0.6 0.8 1 1.2
ST HIP +/+
–/–
0 1 2 3 4 5
ST HIP
0 0.2 0.4 0.6 0.8 1 1.2 1.4
ST HIP c
b a
f e
d
g h i
j
0 0.1 0.2 0.3 0.4
+/+ –/–
Pearso
n
’s coefficien
t
l k
0 0.1 0.2 0.3 0.4
+/+ –/–
Pearso
n
’s coefficie
n
t *
Hippocampus
–/–
+/+
Striatum
–/–
+/+
Homer1b/c Bassoon DAPI
Merge
+/+
–/–
*
Cy
tosolic Homer1b/c
*
Cy
tosolic mGluR5
Hippocampus Striatum
*
* *
*
*
+
0 0.5 1 1.5
2 +/+ +/– –/–
Protein level
* * *
0 0.5 1 1.5 2
2.5 +/+ +/– –/–
Protein level
* *
+
Homer1b/c
Actin
+/+ –/– +/+ –/– ST HIP
0 0.2 0.4 0.6 0.8 1
+/+
–/–
Homer/Rp
l13a
Homer1a Homer1b/c
*
Homer1b/c
+/+
–/– Homer 1b/c
β-tubulin III mGluR5
+/+ +/– –/– +/+ +/– –/– ST HIP
Homer 2
Homer 3 Homer 1a
Homer 1b/c
β-tubulin III
+/+ –/– +/+ –/– ST HIP
mGluR5
Homer1a Homer1a
Homer1b/cHomer2Homer3mGluR5 Homer1b/cHomer2Homer3mGluR5
repetitive behaviours, impaired USV communication and aberrant social behaviours, as well as common comorbidities associated with SHANK3 deficiency. The De4–22þ/ mice displayed only mild behavioural impairments, in contrast to the severe phenotype in SHANK3 haploinsufficient
patients15,16,18,19. The basis for this discrepancy is unknown, but a similar pattern has been seen in other mouse models of human haploinsufficiency23,37–39.
TheDe4–22/ mice displayed a spectrum of changes in PSD proteins, synaptic functions and behaviours distinct from 0
2 4 6 8
0 1 2 3 4
Basal p-ERK1/2
+/+
–/–
Surface
Intracellular
Surface
Intracellular
Dendrite Soma
0 0.2 0.4 0.6 0.8 1
+/+ –/– +/+ –/–
+/+–/– +/+–/–+/+
+/+ –/– +/+ –/–
+ – + – + – + –
+/+ –/– +/+ –/–
mGluR5 (S/I) soma
Basal p-mTOR
p-ERK1/2
ERK DHPG
ST HIP Δe4-22
p-S6K
S6K
p-mTOR
mTOR a
b d e f
c
g h
i
j 0
0.5 1 1.5 2
mGluR5 (S/I) dendrite
*
Basal p-S6K
0 0.1 0.2 0.3
Pearson's coefficent
*
mGluR5 Homer1b/c
Input mGluR5IgG IP
0 0.2 0.4 0.6 0.8 1 1.2
Homer/mGluR5 ratio
*
–/–
+/+
mGluR5 PSD95
mGluR5/PSD95/DAPI
*
0 1 2 3 4
ST
DHPG-induced
increase of p-ERK1/2
0 1 2 3 4
0 0.5 1 1.5
0 0.5 1 1.5
* *
*
+/+ –/–
+/+ –/–
+/+ –/– k
l
m
DHPG-induced
increase of p-S6K
DHPG-induced
increase of p-mTOR
HIP
ST HIP ST HIP ST HIP
ST HIP ST HIP
previously described lines of Shank3 mice23,24,26,27,36,37. For example, the isoform-specificDe4–9 mice22were more impaired in some social tests and in spatial learning and memory, whereas
alterations in anxiety/escape behaviours, grooming and striatal Homer1 protein levels were more apparent inDe4–22/mice. The impaired striatal LTD, increased neuronal excitability and
0
100 200 300 400 20
40 60
–/– aCSF +/+ aCSF
–/– CDPPB +/+ CDPPB
Current (pA)
Frequency (Hz)
e
0 10 20 30 40
0 1 2 3 4 5 6 7 +/+ Vehicle +/+ CDPPB –/– Vehicle –/– CDPPB
Lever presses per min
f
0 2 4 6 8 10 12 14 16
+/+ –/– Vehicle CDPPB
Average lever press
*
g
0 10 20 30
0 1 2 3 4 5 6 7 +/+ Vehicle +/+ CDPPB –/– Vehicle –/– CDPPB
Head-in per min
h
0 2 4 6 8 10 12 14 16
+/+ –/– Vehicle CDPPB
Average head-in
*
m l
Homer 1b/c β-tubulin III
+/+
–/–
Vehicle CDPPB
Homer 1b/c
β-tubulin III +/+
–/–
Learner Non- learner
0 0.1 0.2 0.3 0.4 0.5
Learner Non-learner
Homer 1b/c
(normalized to +/+)
*
0 0.05 0.1 0.15 0.2 0.25 0.3
Vehicle CDPPB
Homer 1b/c
(normalized to +/+)
*
j k
i
*
*
#
#
#
0 10 20 30 40
0 50 100
+/+ aCSF (n = 8) +/+ CDPPB (10 μM, n = 7)
Min
% Baseline EPSC
0 10 20 30 40
0 50 100
–/– CDPPB (10 μM, n = 8) –/– aCSF (n = 8)
Min Baseline After HFS Baseline After HFS Baseline After HFS Baseline After HFS 0.0
0.5 1.0 1.5 2.0
+/+ aCSF +/+ CDPPB –/– aCSF –/– CDPPB
* *
PPR
Total distance
0 500 1,000 1,500 2,000 2,500 3,000
Vehicle a
*
#
MPEP b
Total distance
*
NS
0 500 1,000 1,500 2,000 2,500 3,000
Vehicle CDPPB
0 50 100 150
Vehicle
Grooming duration (s)
c
*
NS #
MPEP
0 50 100 150 200 250
Vehicle
+/+ –/–
Grooming duration (s)
d
NS
*
#
CDPPB
Figure 8 | Behavioural phenotypes inDe4–22 mice are rescued by mGluR5 modulators.(a,b) Reduced activity in open field inDe4–22/(/) mice was rescued by the mGluR5 antagonist MPEP (a) but not by the mGluR5 positive allosteric modulator CDPPB (b). (c,d) Increased self-grooming in the/
mice was attenuated by MPEP (c) and was exacerbated by CDPPB (d). *Po0.05,/versusþ/þ;#Po0.05, within genotype for treatment. For (a,c), vehicle:þ/þ,n¼10,/,n¼12; MPEP:þ/þ,n¼10,/,n¼12. Forb,d, vehicle:þ/þ,n¼8,/,n¼12; CDPPB:þ/þ,n¼9,/,n¼11. (e–h) CDPPB enhanced lever pressing (e,f) and head-entries into the magazine (g,h) across the 7 days in/mice. *Po0.01, planned comparison: two-tailedt-test. vehicle:þ/þ,n¼8, /,n¼12; CDPPB:þ/þ,n¼9, /,n¼11. (i) CDPPB does not alter LTD in MSNs ofþ/þ mice (left). CDPPB rescues LTD in MSNs of/ mice (right). (j) HFS increased probability of PPR inþ/þmice but not in/mice. *Po0.05, pairedt-test,n¼7,þ/þ
CDPPB,n¼8 for the other groups. (k) CDPPB decreased spike frequency in response to current injection in the MSNs ofþ/þ and/ mice. *Po0.05,
impaired striatal-dependent learning in the De4–22/ mice have not been reported in other lines of Shank3 mutants. Behavioural profiles among different lines of the mutant mice are also distinct. Although excessive grooming has been observed in other lines, skin lesions were reported only inDe11,De13–16, and De4–22, but not inDe4–7,De4–9,De9 andDe21 (refs 20–26,40), suggesting that the severity of over-grooming is Shank3
isoform-specific.
The high levels ofShank3expression in striatum may explain the prominent striatal defects found in De4–22/ mice21. Changes in Homer1b/c and mGluR5 proteins were prominent in striatum, but not in neocortex and hippocampus. Furthermore, De4–22/ striatum had reduced spine density and attenuated PSD structures that are consistent with the deficiency of Shank3 and reduced Homer1 scaffolding proteins in this brain region. The decreased sEPSC frequency in De4–22/ MSNs, along with their reduced spine densities, suggests a loss of excitatory synapses. While the striatum receives glutamatergic inputs from both cortex and thalamus41, it is unclear whether both corticostriatal and thalamostriatal synapses are affected by the
Shank3 deletion. We interpret the significantly increased
excitability of striatal De4–22/ MSNs as a homoeostatic compensation for reduced glutamatergic transmission, allowing spikes to be generated with less synaptic input. This increased excitability is consistent with ourin vivorecordings, which show enhanced baseline functional connectivity between the cortex and striatum, yet reduced coupling between these areas during social interaction.
The De4–22/ mice also showed impaired striatal LTD, a form of synaptic plasticity associated with protein synthesis42. While this impairment might reflect reduced overall excitatory transmission, it may also be attributed to impaired mGluR5 signalling due to the disrupted mGluR5-Homer1 scaffolds, previously shown to be critical for striatal LTD43. This hypothesis is supported by the fact that impaired LTD in De4–22/mice was completely rescued by CDPPB, a mGluR5 positive allosteric modulator. While CDPPB did not significantly alter the probability of PPR, it elevated levels of Homer1b/c in the De4–22/ PSD, implying that disrupted mGluR5-Homer scaffolds might be a major contributor to the impaired LTD. This deficit in LTD could be linked to the observed deficits in instrumental learning and other behavioural impairments, but not to the increased self-grooming in De4–22/ mice. Importantly, striatal-dependent instrumental learning was nearly abolished. Since instrumental learning involves acquiring new responses based on reward feedback44,45, our findings suggest a role for Shank3 in reward-related processes in general, including social rewards, potentially relevant to the pathophysiology of ASDs.
Abnormal brain connectivity has been proposed to underlie human autistic behaviours3,4,6, but the evidence is inconsistent due to both limitations in experimental design and heterogeneity of ASD presentation in humans. Mutant mice provide an experimentally tractable model to dissect the role of Shank3 in ASD-like behaviours. The overall brain volume and ventricular size were increased, consistent with the increased head circumference reported in a subset of SHANK3 patients19. The abnormal neural circuit function and behaviours seen in our De4–22 mice are reminiscent of the alterations in grey matter content and the integrity of white matter reported in SHANK3
patients. For example, enlargements in the basal ganglia found in De4–22/ mice correspond to reported enlargement in the neostriatum of human patients46. The De4–22/ mice have reduced cingulate cortices and enlarged deep mesencephalic nuclei, which receive inputs from the striatum and have projections to the ventral thalamus47. The changes in these
structures may underlie the abnormal functional connectivity within the cortico-stiratial-thalamic circuit revealed from our
in vivorecordings.
Multi-site in vivo recordings allowed us to document hyperactivity in the cortico-striatal-thalamic axis in De4–22/ mice. These recordings bear similarities to those in human ASD patients9,10. The altered pattern of oscillations in the 7–11 Hz frequency band inDe4–22/ mice corresponds to the abnormalities at 8–11 Hz reported in human ASDs subjects31. As with our mice, hyperactivity in the anterior cingulate-striatal-thalamic circuits has been observed also in human subjects with ASDs7. A study of functional connectivity focusing on SHANK3-deficient patients may yield important new insights.
The deficiency of Shank3 in De4–22 mice caused a redistribution of Homer and mGluR5 in striatal neurons. The drastic changes for Homer1b/c (decrease in the PSD but increase in the soma) are consistent with a putative role of Shank3
in the synaptic trafficking of Homer1b/c, as
previously suggested by in vitro studies48–50. The increased mGluR5 but disrupted mGluR5-Homer scaffolds in the PSD (presumably secondary to the mislocalized Homer1b/c) suggest a bidirectional alteration in mGluR5-mediated functions at synapses. The reduced association of Homer1 and mGluR5 could result in the hypofunction of mGluR5-mediated signalling, whereas the increased PSD-localized mGluR5 could be associated with enhanced mGluR5 function. This hypothesis of bidirectional change is supported by the elevation of basal p-ERK and p-S6K levels with a correspondingly blunted DHPG response. Because of differences in signalling between the striatum and hippocampus, it appears that mGluR5-mediated signalling could be synapse-and cell type-specific. Future experiments will investigate these possibilities. The bidirectional changes in mGluR5 function may contribute to the differential striatal-related behavioural impairments observed. That excessive grooming behaviour is moderated with the mGluR5 antagonist MPEP, but augmented with the positive allosteric modulator CDPPB, suggests that enhanced synaptic mGluR5 function underlies the excessive grooming seen in theDe4–22/ mice. Conversely, partial rescue of lever-press by CDPPB raises the possibility that decreased mGluR5 function may contribute to the impaired instrumental learning.
In summary, the present work suggests that many of the observed abnormalities in De4–22/ may be explained by disrupted mGluR5-Homer scaffolds and altered mGluR5 signalling in the striatum (Fig. 9). The deficiency of Shank3 protein leads to redistribution of Homer1b/c and mGluR5 protein at the synapse and soma. Our results suggest this could be a pathophysiological mechanism for ASDs in humans. While our findings indicate that these processes could be linked to distinct behavioural phenotypes and synaptic dysfunction, further studies will be required to establish exact mechanistic links among these molecular changes, behavioural impairments and neural circuitry dysfunction inDe4–22/ mice.
Methods
Generation ofShank3mice with deletion of exons 4–22 (De4–22).The targeting constructs were prepared using a previously described recombineering method60.The 129/SvEv BAC clone (bMQ457K21) covering theShank3gene was first identifiedin silicousing the Ensembl mouse genome browser (www.ensembl. org) and the clone was obtained from Geneservice Ltd, UK61.Shank3De422 mice were generated by a two-step targeting strategy using the Cre-loxPsystem. The first (50) construct inserted theloxP1andloxP2sites flanking exons 4–9 with a
neomycin cassette. The second (30) construct inserted theloxP3at a 30-site
5 kb-downstream of exon 22 with a puromycin cassette (Fig. 1a and Supplementary Fig. 1b). See details in Supplementary Methods. All experiments were conducted with protocols approved by the Institutional Animal Care and Use Committee at Duke University.
Preparation of crude PSD and cytosolic fractions.Isolation of crude PSDs was performed using a previously described protocol62with some modifications (see details in Supplementary Methods).
Quantitative immunoblot and co-immunoprecipitation analysis.See details in Supplementary Methods. Images for immunoblot have been cropped for presentation. Full-size images are presented in Supplementary Fig. 9.
Immunocytochemistry and confocal microscopy.Eight-week-old mice were transcardially perfused with 4% paraformaldehyde in 1PBS (pH 7.4). The brains were dissected and post-fixed in the same fixative overnight. The brains were then cryoprotected by submerging them in 30% sucrose for 48 h. After embedding into optimal cutting temperature compound (O.C.T.) on dry ice, brains were sectioned on a cryostat at 40mm thickness. Slices with brain regions of interest were used for further staining with corresponding antibodies. See details in Supplementary Methods.
Corticostriatal Co-cultured neurons and mGluR5 surface immunostaining. Corticostriatal co-cultures were prepared from P1 littermateDe4–22þ/þand
De4–22/mice according to a method described previously63(see details in Supplementary Methods).
Antibodies.See details in Supplementary Methods
Brain slices preparation and DHPG treatment.Hippocampal and striatal slices were prepared from 4-week-old mice, anaesthetized with isoflurane. Brains were dissected rapidly and cut coronally at 400mm in dissection buffer containing the following (in mM): 75 sucrose; 87 NaCl; 2.5 KCl; 1.25 NaH2PO4; 26 NaHCO3; 10
glucose; 7 MgCl2; and 0.5 CaCl2. Slices were allowed to recover at 32°C for 1 h in a
submersion chamber containing oxygenated artificial cerebrospinal fluid (aCSF) consisting of the following (in mM): 124 NaCl; 3 KCl; 1.25 NaH2PO4; 26 NaHCO3;
20 glucose; 1 MgCl2; and 2 CaCl2. For DHPG treatment, slices were transferred
into six-well plates with or without 100mM DHPG for 5 min. After treatment, slices were transferred into a 1.5 ml tube and frozen on dry ice for further western blot analysis. Protein synthesis in the striatal slices was evaluated by measuring puromycin incorporation into newly synthesized proteins using a puromycin antibody as described52.
Golgi staining.Golgi staining was performed using 8-week-old mice as descri-bed22. See details in Supplementary Methods.
Electron microscopy.Electron microscopy was performed using 8-week-old mice as described22. See details in Supplementary Methods.
Mouse cohorts for the behavioural tests.Mice were tested in 10 cohorts of mixed sexDe4–22þ/þ,De4–22þ/andDe4–22/littermates beginning at 2 mos of age (except for neonatal studies as described below) (Supplementary Table 1). Many of the methods described below (some behavioural anaylses are described in Supplementary Methods) have been reported previously by our group, allowing us to determine appropriate numbers of mice per cohort to assess significant differences22,64. Since some mice developed lesions across testing, they were euthanized according to Duke IACUC policy and thus were excluded from subsequent tests. All experimenters handling animals or scoring behavioural data were blinded to genotype throughout the studies. Mice in cohorts 1–6, 9,10 were housed on a 14:10 h light:dark cycle with most testing occurring during the light cycle. Mice in cohorts 7 and 8 were housed on a 12:12 light:dark cycle. Mice were housed 4–5 per cage unless otherwise specified.
Spray test.Individual animals were acclimated to clean home cages for 5 min before filming (MediaRecorder2, Noldus Information Technologies, Leesburg, VA, USA). Mice were filmed for 5 min and then lightly misted with tap water from a spray bottle. Filming continued for an additional 10 min. Grooming behaviour was scored using TopScan software (CleverSys, Reston, VA, USA) and verified by a blinded observer. Because of the differing length of pre- and post-spray responses, the data were reported as seconds spent in self-grooming per min observation.
Hole-board test.Mice were placed individually into a 424230 cm open field and allowed free exploration of a hole-board apparatus (42423 cm) (AccuScan Instruments, Columbus, OH, USA) as described22. The hole-board was made of white plexiglass with 16 equally spaced holes (3 cm in diameter) arranged in four rows. Animals were filmed with a digital video camera and hand-scored by a blinded observer for the numbers of nose-pokes and the location of each nose-poke.
Juvenile nest choice.This test was conducted on postnatal day 15, when pups had opened their eyes and were capable of thermoregulation and goal-directed locomotor behaviour65. Testing occurred in two phases. For the first phase, 2 cm2 nesting material was removed from the home-cage nest and placed at one end of a clean and empty mouse cage. Testing began when a single pup was placed at the end of the cage opposite to the nesting material, with the head of the pup facing away from the nest. The latency of the pup to turn and enter the home nest was scored. If the pup did not find the home nest after 60 s, the latency was scored as 60 s. At the end of the test, pups were quickly removed and placed into a clean 8 oz. holding cup. The testing cage was cleaned of any urine or boli, and an equal amount of stranger nesting materials was placed in the test cage opposite that of the mGluR5
function
Homer mGluR5
Synapse
Instrumental learning
Self-grooming
Thalamus
Enhanced connectivity
Enhanced connectivity Neocortex
Basal ganglia
Other behavioural impairments Complete loss of Shank3
Soma
Homer1b/c
mGluR5
Figure 9 | A proposed model of the impairments inShank3completely deficient mice.InDe4–22/ (/) mice, the deficiency inShank3