COMPUTATIONAL VISUAL METHOD OF WHEAT
TEMPERATURE IN WHEAT BARN
1HAN CHEN, 2XING-PEI LIANG,AND 3HUA HUO
1Electronic & Information Engineering College, Henan University of Science and Technology, Luoyang
471003, P.R.China
2Institute of Scientific and Engineering Computation, Henan University of Technology, Zhengzhou
450001, P.R.China
3Electronic & Information Engineering College, Henan University of Science and Technology, Luoyang
471003, P.R.China
1Corresponding author, [email protected]
ABSTRACT
In the paper, the three-dimensional numerical model and the data interface between database and calculating program are established for the prediction of wheat temperature variation during the practical grain storage. Due to the temperature-dependence of thermal properties of wheat, the nonlinear transient finite element simulation of the wheat temperature field is carried out. The numerical results are compared with the measured results to verify the proposed numerical model, and it’s found that there is a good agreement between them. So, it can be said that the temperature variation for the practical wheat storage can be observed and analyzed in the visual type, instead of time and money-consuming experiment, if the numerical method developed in this paper can be put into practice. Furthermore, the present method of monitoring grain temperature only based on the data analysis can be further improved to the visual level.
Keywords: Grain storage, Visual method, Numerical simulation, Finite element
1. INTRODUCTION
For ensuring the quality of commissariat, the temperature of commissariat in the storage is one of the key parameters during the storage procedure and should be monitored at any time. The temperatures of each storage at some specific points are measured in a certain time interval, which usually is two hours. So there are large numbers of temperature data which should be collected and analyzed. However, the management and analysis of such data are usually tedious and time-consuming. In addition, the method of monitoring wheat temperature by observing and analyzing limited temperature data obtained by experiment is not enough and clear, and also it is not intuitionistic. But till now, there is no better method that can be directly put into practice. The numerical simulation is a useful technique to implement the prediction of grain temperature in the visual way. In the past few years, some studies [1, 2, 3] have been carried out to investigate the problem of observing grain temperature in the visual type by numerical
simulation. But the simulated objects in these studies were testing storages which are smaller than the practical storages. The environment of grain storage is complicated and the size of it is large. So it’s interesting to conduct such a study of visual monitor of the practical storage. Besides, He et. al studied the temperature distribution in the practical warehouse by statistical method [4]. Gu and He [5], Li et. al. [6] respectively measured the temperature data by temperature sensor and analyzed the temperature variation in large horizontal warehouses. These works mentioned above don’t involve the visualization of temperature data.
624 monitoring wheat temperature field in the visual interface for grain storage is developed.
[image:2.612.98.295.237.591.2]The paper starts from a brief description of wheat storage problem in Section 2. Next, Section 3 gives the corresponding finite element formulations and numerical experiments are performed in Section 4 to verify the present finite element model and investigate the thermal behavior of wheat storage. Finally, some concluding remarks are drawn in Section 5.
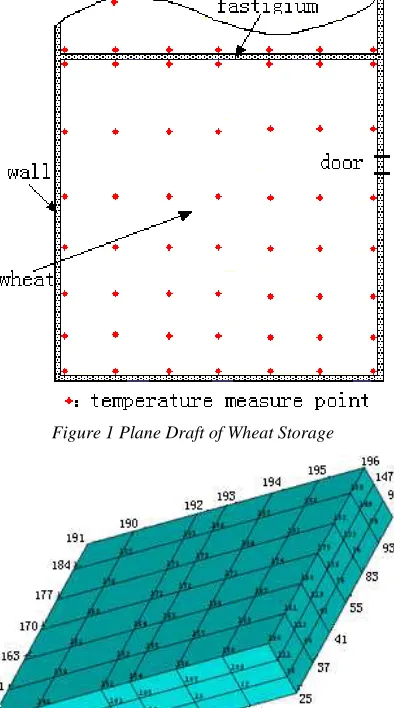
Figure 1 Plane Draft of Wheat Storage
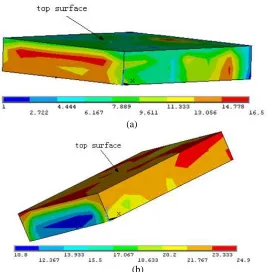
Figure 2 Computational Model for Wheat Storage
2. PRACTICAL WHEAT STORAGE
Figure 1 is the plane draft of practical wheat storage. The wheat storage to be studied in this paper is connected with another one by a fastigium. The length of the wheat stack is 29.3m, the width is 28.3m and the height is 12.0m. The location of temperature measured points in one layer are shown
in Figure 1 and there are four layers temperature measured points in the vertical direction, so there are 49 points for every lay and totally 196 points for the whole wheat stack. The temperature of every measured point has been measured for 354 days (i.e. 8496 hours) with the interval of two hours and the measured temperature for every point are stored in the specific database.
3. FINITE ELEMENT MODEL
In order to show the temperature variation in the wheat storage, the three-dimensional finite element computational model is built as shown in Figure 2. For solving this three-dimensional heat conduction problem, the well-posed governing partial differential equation [7] is given by
( ) ( ) ( )
( ) ( ) in
T T T
k T k T k T
x x y y z z
T T c T
t ρ ∂ ∂ ∂ ∂ ∂ ∂ + + ∂ ∂ ∂ ∂ ∂ ∂ ∂ = Ω ∂ (1)
in which T denotes the sought temperature field, k is the thermal conductivity (W/(m•K)), ρ denotes
the density (kg/m3), c represents the specific heat (J/(kg•K)) and t is the time variable. In this paper, the thermal properties of wheat used have been determined by the physical experiments, i.e. the constant density ρ=780 kg/m3 for the wheat is
taken, while the thermal conductivity and specific heat are assumed to be dependent of temperature variable, for example,
0.0007 T 1.666W/(m K)
0.0094 T 1.5855 J/(kg K)
k
c
=
⋅ +
⋅
=
⋅ +
⋅
(1)For the governing equation (1), the corresponding finite element equation can be written as [8]
+ =
C T& K T P (2)
where the C and K are separately specific heat matrix and conductivity matrix,
T
&
,T
andP
respectively denote nodal temperature derivative vector to the time variable t, nodal temperature vector and nodal equivalent thermal load vector.
For the transient analysis, the following initial condition related to predefined temperature field should be supplied as
0
( , , ,
0)
( , , ) in
T x y z t
= =
T x y z
Ω
(3)where the measured temperature at the beginning of 196 measuring points is taken as the initial temperature
T
0.The measured time interval is two hours, and the measured temperatures are stored in the specific database. For the sake of automatical selection of the boundary temperature data and the initial temperature, a special interface between database and calculating program is developed.
The total solving time is 354 days (i.e. 8496 hours). In the transient temperature analysis, Newmark integral method is used and the time step is two hours.
4. NUMERICAL RESULTS AND VISUALIZATION
As we expect, both numerical results calculated by finite element method and measured results obtained from temperature sensors give similar
[image:3.612.174.441.431.703.2]temperature variation and the wheat temperature changes continuously in terms of days in one year. Figure 3 respectively shows temperature distribution at the time instance of 4000 hours (corresponding to 29th of September, 2009) and 6000 hours (corresponding to 20th December, 2009). It can be seen that although the temperature of wheat in September is high, only the temperature of wheat in the top lay increased. The temperature of internal wheat still kept about 10 . Totally speaking, the temperature of the top layer is higher than the internal temperature (see Figure 3a) in September, while it is lower than the internal temperature (see Figure 3b) in December. It’s reasonable that the thermal conductivity of wheat is small, so that the heat energy is difficult to flow into or out from the wheat stack.
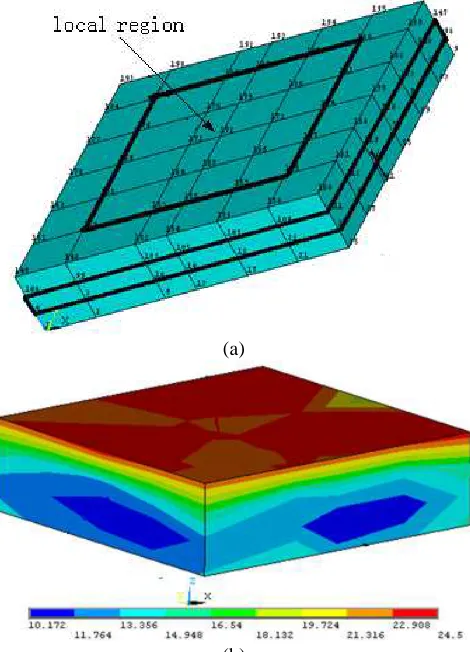
To observe and analyze the internal temperature distribution of the wheat, the internal local region can be cut out from the whole model so that its temperature can be shown clearly. Figure 4b is the picture of temperature distribution at the time of 4000 hours (corresponding to 29th September) for the local region shown in Figure 4a.
(a)
(b)
626 In order to verify the proposed numerical model, the numerical results of temperature at some internal points are compared with those by experiment measurement. The two curves of temperature at two temperature points are given in
Figure 5. It can be seen that the total tendency of numerical temperature curve along with time is in agreement with that of test temperature, and the maximum relative percentage error in temperature between calculation results and test results is 6%.
(a)
[image:4.612.189.424.169.495.2](b)
Figure 4 Temperature Distribution At Local Region: (A) Local Region (B) Temperature Distribution
(a) (b)
[image:4.612.110.512.531.697.2]5. CONCLUSIONS
In the paper, the three-dimensional finite element model and the data interface between database and calculating program are established. The transient finite element numerical simulation of the wheat temperature field is performed. The numerical results for temperature field are compared with the measured results. It’s found that the numerical simulation results are reasonable in the total tendency and the numerical value of temperature is in agreement with the measured results.
Based on the calculated results, it has been actualized that the wheat temperature of practical storage can be observed in a visual way, so the method of this paper is feasible. If the method of this paper can be put into practice, the temperature of grain in storage can not only be predicted but also observed in the type of visual way. In the future, the nonlinear transient heat conduction analysis in the practical wheat storage will be performed by considering the dependence of thermal conductivity of the wheat on the temperature. At the same time, the seamless connection between the numerical analysis and the database of measured temperature will be studied.
ACKNOWLEDGEMENT
The research work in this paper is partially supported by the National Key Technology R&D Program for the 11th five-year plan, China under the grant no. 2006BAD08B01-4.
REFERENCES
[1] F. Ayuga, M. Guaita, P.J. Aguado and A. Couto: J. Eng. Mech Vol. 127 (2001), p.1067 [2] P. Vidal, M. Guaita and F. Ayuga: Biosystems
Eng Vol.91 (2005), p.335
[3] Y.X. Yan and L.Z. Chao: Chin. J. Tech. Comm. Storage Vol. 40 (2006), p.28 (in Chinese) [4] Z.F. He, Y.X. Zhao, Y. Cao, D.F. Li, et.al:
Chin. J. Grain Storage Vol. 39 (2010), p. 15 (in Chinese)
[5] X.M. Gu and Y. He: Chin. J. Grain Storage Vol. 41 (2012), p. 19 (in Chinese)
[6] Z.M. Li, S.J. Meng, N. Li, J.C. Zhang, et. al. Chin. J. Science and Technology of Cereals, Oils and Foods Vol. 16 (2008), p. 22 (in Chinese)
[7] J.E. Parrott and D.S. Audrey: Thermal conductivity in Solids (London Pion, 1975)