The Relationship Between Understanding of E-Learning with
Self-Directed Learning Among Students
Normala Ismail1*, Mohamad Kamil Ariff Khalid2 1, 2
Faculty of Business and Management, Universiti Teknologi MARA Pahang Branch, Jengka Campus, 26400 Bandar Tun Abdul Razak Jengka, Pahang, Malaysia
Email Address: *[email protected], [email protected]
Received Date: 2 April 2020 Accepted Date: 1 June 2020 Published Date: 31 July 2020
ABSTRACT
The main purpose of this study is to identify the students’ understanding of e-learning and their readiness for self-directed learning. A total of 306 Diploma level students of a various program from three faculties at Universiti Teknologi MARA Pahang Branch, Raub Campus have been surveyed. The data were obtained through questionnaires distributed and analyzed using the Statistical Package for Social Sciences (SPSS) version 23. The findings show that the respondents’ level of understanding of the concept and their responsibility on e-learning is high while their readiness for self-directed learning is low. The correlation test results show that there is a significant positive relationship between the respondents’ level of understanding to e-learning and their willingness for self-directed learning but the correlation is weak. The findings also showed that the respondents’ level of education and study grade have a significant difference in their readiness for self-directed learning.
Keywords: Academic achievement, E-learning, Self-directed learning
INTRODUCTION
The concept of life-long learning is not a new thing in the national education system. This concept refers to the process of democratization of education that includes programs enhancing knowledge, skills and competencies whether formal or informal. According to Geng, Law & Niu (2019) life-long learning requires students to understand the whole learning system. They are expected to acquire new skills, use them in learning and sharing information with other students. Such knowledge experiences cannot be learned in the usual form, nor informal form and in practice. It requires a continuous effort, creative and understand the concept of knowledge sharing (Grover, 2015). Hence, when designing, developing and facilitating learning experiences, student characteristics and learning styles need to be taken into account. Knowles Andragogy Theory (Slater, Cusick & Louie, 2017) shows some differences in learning methods of adults and young people where adults see themselves as self-leaners and want to invest in their learning experience, while young people rely on their teachers.
library instead of being in the university. It does not require students to be in the classroom according to the set time. However, this learning can also be in a formal form where students need to register a number of courses offered by the university, except here, the students themselves will determine their own learning time according to their own suitability and intellectual needs. According to Beach (2016), this e-learning method is increasingly popular, even every higher e-learning institution are implementing it. The current learning can be seen from a wider perspective where the use of technology, especially the internet in learning has greatly changed the learning method.
This e-learning can be used in a way that allows students to access materials and learn on their own in terms of time, technique and informal setting (Beach, 2016). E-learning enables students to access information from around the world through online forums, e-mails, conference videos and online chats (Boyer, 2015). In addition, e-learning is a cost-effective way where many of the materials available on various sites are accessible to students without the cost. In fact, free resources on the internet bring many benefits to consumers (Cassidy & Eachus, 2012). The use of e-learning has the potential to bring about change and renewal from classroom-oriented learning to web-based learning. Boyer (2015) and Beach (2016) show that the use of technology in the teaching and learning process can enhance learning outcomes. Boyer (2015) further emphasizes that technology-based teaching is more alternative and needs to be improved. Students also need to use technology including e-learning in the learning process to get the information they need (Swart, 2018).
Lately, e-learning has grown rapidly and in addition, many models have emerged. The models differ from each other, in terms of duration, schedule, and interactive level. E-learning can be implemented in stages and initially made in addition to traditional or existing teaching resources at higher learning institutions. For higher learning institutions, the need for e-learning has risen to a critical level. These requirements are closely related and also determine the ability of higher learning institutions to provide services that are aligned in a borderless world. High-tech higher learning institutions can certainly attract more students (Swart, 2018).
According to the study of Casey & Eachus (2012) on e-learning at one of the universities, students accept e-learning as a method of learning. They are aware of the importance and need of computers as one of the tools in learning. However, the use of e-learning is far from satisfactory. The main problems faced by them during e-learning are lack of internet access; followed by external factors such as lack of support from the faculty, colleagues, families, administrators and university technical staff; problems in understanding learning materials, not interactive, not up-to-date and data transfer problems to computer storage; and other personal-related problems such as lack of interest in computer applications, discomfort with ICT, no personal computer and internet access at their residence. According to Grover (2015), the implementation of e-learning in the higher learning institutions should be conducted by a task force, perhaps consisting of a faculty representative that serves to provide guidelines, syllabus contents and monitor the project’s journey at the faculty level.
understanding on e-learning in the aspects of gender, education level, faculty and grade of study and their readiness for self-directed learning, (2) identify the relationship between the students’ level of understanding on the implementation of e-learning and their readiness for self-directed learning, and (3) know other factors that contribute to the students’ understanding of e-learning and their readiness for self-directed learning.
LITERATURE REVIEW
Students’ demographics play an important role in determining students' understanding and readiness for e-learning and the obstacles in e-learning (Grover, 2015). Some studies indicate that there are differences between genders in technology use. For example, female students are found to be more ambivalent about technology and less interested in using technology while male students are more interested and experienced in using technology (Cassidy & Eachus, 2012). However, Grover (2015) found that gender is not a hindrance to the learning process and does not make a significant difference in e-learning. The results of the same study by Tekkol & Demirel (2018) on higher education students in South Korea found that the understanding and readiness of internet use among male students was not significant compared to female students.
The study by Swatsky et al. (2017) found that students with internet connection computers influence their frequency and access to e-learning. A study by Grover (2015) found that it is very important to consider computer ownership and ability to use computers. Owning a computer alone is not enough for e-learning but requires the ability to access the internet at any time and place. According to Cassidy & Eachus (2012), computer ownership can improve student’s efficiency on e-learning.
A student’s computer experience is also a critical factor in determining confidence in one’s own competencies. Casey & Eachus (2012) concludes that a positive experience with computers improves the students’ understanding and readiness of e-learning. Their study indicates that there is a positive relationship between the students’ understanding and readiness of e-learning and computer experience and software familiarity. On the contrary, negative experience decreases the students’ understanding and readiness for self-directed learning.
Besides, computer courses can enhance students’ understanding and readiness for e-learning. A study by Casey & Eachus (2012) found that students’ understanding and readiness for e-learning increased after attending computer courses. However, the study does not specify the type of course provided to students. Further, the study of Swatsky et al. (2017) found that students’ existing experiences using the internet will influence their attitude toward e-learning. According to the study, students with computer and internet experience have a positive attitude towards e-learning.
Thus, there are five hypotheses to be considered in this research. They are no significant relationship in the aspects of students’: (1) gender with their readiness for self-directed learning, (2) education level with their readiness for self-directed learning, (3) faculty with their readiness for self-directed learning, (4) study grade with their readiness for self-directed learning, and (5) level of understanding on the implementation for e learning with their readiness of self-directed learning.
RESEARCH METHODOLOGY
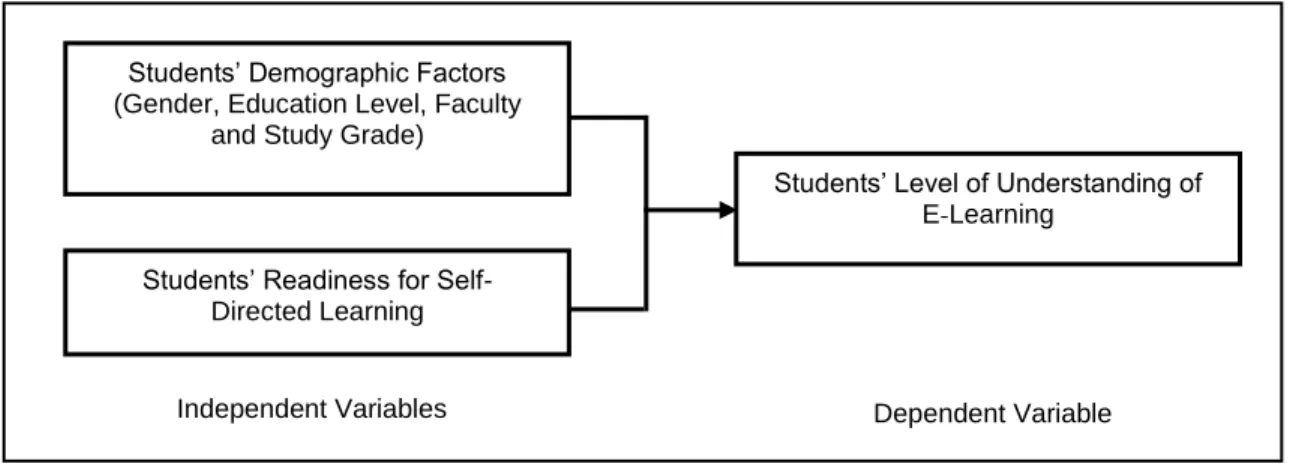
Based on the research, a model has been developed to explain the students’ level of understanding on the implementation of e-learning with their readiness for self-directed learning. This study involves descriptive and inferential analysis. Here, the students’ level of understanding of e-learning is the dependent variable while their demographic factors (gender, education level, faculty and study grade) and readiness for self-directed learning are the independent variables as illustrated in Figure 1.
Figure 1: Theoretical Framework
The population of the study consists of diploma students from the Faculty of Administrative Science and Policy Studies (FSPPP), Faculty of Business and Management (FPP) and the Faculty of Computer Science and Mathematics (FSKM) at UiTM Pahang Branch, Raub Campus. According to the Students’ Academic Affairs Division (BHEA), the total number of students throughout the year 2017 roughly estimated is around 2,800. The researchers used the Krejeie and Morgan’s Sampling and Population Table (Krejeie and Morgan, 1970) to determine the sample size of the study which was 454 students. The sample covers from part two (02) to part five (05) students. Once the permission is obtained from the university administration, a total of 454 questionnaires were distributed using stratified random sampling procedure. Of these, 306 (67.40%) questionnaires can be used for further analysis while 148 (32.6%) questionnaires could not be used because they were incomplete. Table 1 shows the sample size of this study according to the faculties.
Table 1: Sample Size
Faculty Number of Respondents
Faculty of Administrative Science and Policy Studies (FSPPP) 137
Faculty of Business and Management (FPP) 105
Faculty of Computer Science and Mathematics (FSKM) 64
Students’ Demographic Factors (Gender, Education Level, Faculty
and Study Grade)
Students’ Level of Understanding of E-Learning
Students’ Readiness for Self- Directed Learning
The data were collected using questionnaires distributed to the respondents. The questionnaire consists of four parts, the students’ background and the students’ level of understanding on the implementation of e-learning, the Scale of Readiness in Self Learner Learning (SDLRS) and factors contributing to the students’ understanding on e-learning.
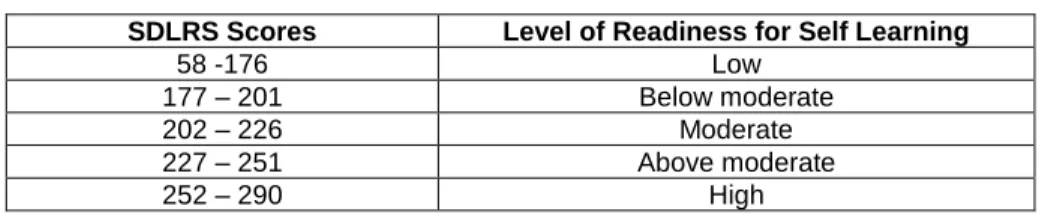
The SDLRS developed by Gugleilmino, Gugleilmino and Long (1987) is used to see whether students have the skills and attitudes associated with self-directed learning. It contains 30 items with five point Likert scales that measure the students’ readiness of self-directed learning in eight factors, namely learning preferences, student self-concept, student tolerance to risk, simplicity and complexity, creativity, learning of learning as life-long activities, student initiatives, self-understanding and acceptance of responsibility for self-study. To get scores range, items are counted and added to each other. Table 2 shows the SDLRS scores and levels. According to them, students who earn high scores can plan their own learning methods and strategies. They also feel comfortable in a structured learning environment of their choices. Meanwhile, students who receive moderate scores can plan their own learning methods and strategies but they are dependent on others for their performance. Finally, students who receive low scores not only need a structured but also guided methods and strategies to feel secure because they are not able to determine their own learning.
Table 2: Scores and Level of Self Learning Readiness Skills (SDLRS)
SDLRS Scores Level of Readiness for Self Learning
58 -176 Low
177 – 201 Below moderate
202 – 226 Moderate
227 – 251 Above moderate
252 – 290 High
Source: Gugleilmino, Gugleilmino and Long (1987)
The data were analyzed using the Statistical Package for Social Sciences (SPSS) version 23. The respondents’ background was analyzed using descriptive statistics in frequency, percentage and mean. The Mann-Whitney U test is used to see the relationship in the aspects of students’ gender with their readiness for self-directed learning at significant level of Alpha = 0.05. The Kruskal-Wallis Chi-Square test is used to identify the relationship in the aspects of students’ education level and faculty with their readiness for self-directed learning. Next, the Pearson Chi-Square test is used to see the relationship in the aspects of students’ study grade with their readiness for self-directed learning. Finally, the Spearman’s Rho test is used to examine the relationship between the students’ level of understanding on e-learning and their readiness of self-directed learning.
FINDINGS AND DISCUSSION
Respondents’ Background
Table 3: Respondents’ Background
Items Number of Respondents Percentages (%)
Gender Male 193 63
Female 113 37
Level of Education (SPM Examination Results)
SPM 3A below 145 47.39
SPM 4A 90 29.41
SPM 5A 58 18.95
SPM 6A above 13 4.25
Faculty
FSPPP 137 44.77
FPP 105 34.13
FSKM 64 21.10
Study Grade (CGPA)
2.00 to 2.49 75 24.51
2.50 to 3.00 101 33.01
3.01 to 3.49 75 24.51
3.50 above 55 17.97
Respondents’ Understanding of E-Learning
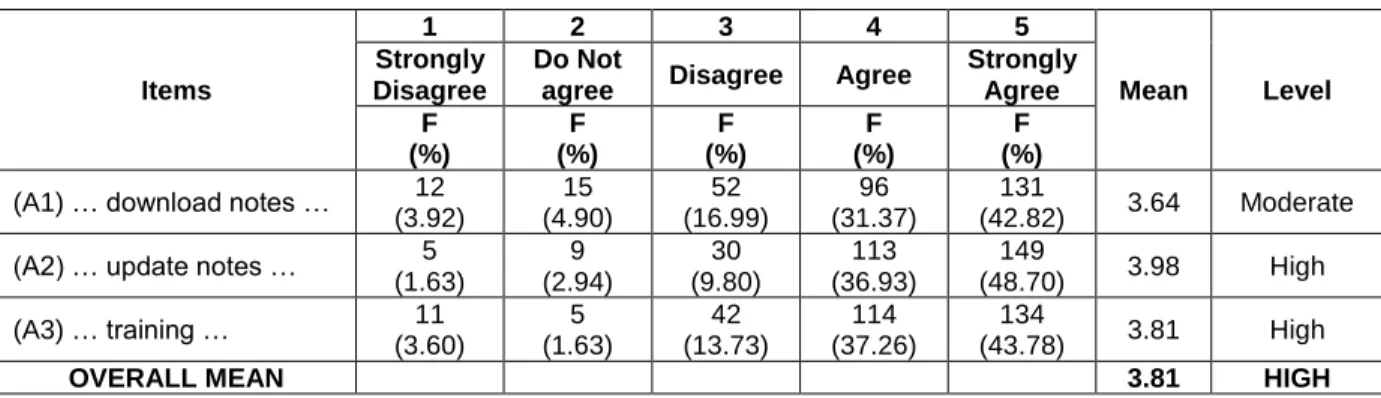
Table 4 illustrates the respondents’ understanding of e-learning. The mean for item A1 is 3.64. This shows that the students’ understanding of their responsibility to download lecture notes from the website is moderate. Next, the mean for item A2 is 3.98 which indicates that the students’ understanding of their responsibility to update notes from time to time is high. Finally, the students also understand that it is their responsibility to inform the lecturers in charge if they want to join training related to e-learning. Here, the mean obtained under item A3 is 3.81. The overall mean of 3.81 indicates that the students’ level of understanding on the implementation of e learning is high.
Table 4: Respondents’ Understanding of E-Learning
Items
1 2 3 4 5
Mean Level
Strongly Disagree
Do Not
agree Disagree Agree
Strongly Agree F (%) F (%) F (%) F (%) F (%)
(A1) … download notes … 12
(3.92) 15 (4.90) 52 (16.99) 96 (31.37) 131
(42.82) 3.64 Moderate
(A2) … update notes … 5
(1.63) 9 (2.94) 30 (9.80) 113 (36.93) 149
(48.70) 3.98 High
(A3) … training … 11
(3.60) 5 (1.63) 42 (13.73) 114 (37.26) 134
(43.78) 3.81 High
OVERALL MEAN 3.81 HIGH
Respondents’ Readiness for Self Directed Learning
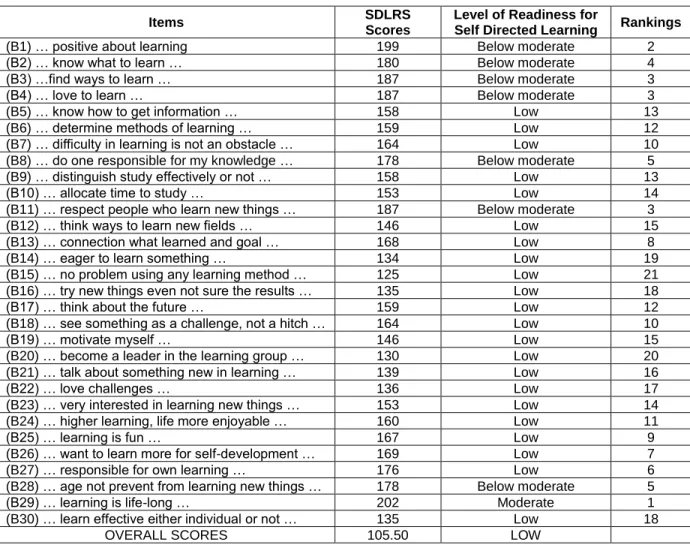
followed by items B12 to B27 and item B30 indicate that the students’ readiness for self-directed learning is low. This shows that they are still unsure of accepting new learning methods. The overall scores are 105.50 which indicates that the students’ readiness for self-directed learning is low. This shows that the students need a guided and structured learning methods to feel secure. They are not able to study on their own.
Table 5: Respondents’ Readiness for Self Directed Learning
Items SDLRS
Scores
Level of Readiness for
Self Directed Learning Rankings
(B1) … positive about learning 199 Below moderate 2
(B2) … know what to learn … 180 Below moderate 4
(B3) …find ways to learn … 187 Below moderate 3
(B4) … love to learn … 187 Below moderate 3
(B5) … know how to get information … 158 Low 13
(B6) … determine methods of learning … 159 Low 12
(B7) … difficulty in learning is not an obstacle … 164 Low 10
(B8) … do one responsible for my knowledge … 178 Below moderate 5
(B9) … distinguish study effectively or not … 158 Low 13
(B10) … allocate time to study … 153 Low 14
(B11) … respect people who learn new things … 187 Below moderate 3
(B12) … think ways to learn new fields … 146 Low 15
(B13) … connection what learned and goal … 168 Low 8
(B14) … eager to learn something … 134 Low 19
(B15) … no problem using any learning method … 125 Low 21
(B16) … try new things even not sure the results … 135 Low 18
(B17) … think about the future … 159 Low 12
(B18) … see something as a challenge, not a hitch … 164 Low 10
(B19) … motivate myself … 146 Low 15
(B20) … become a leader in the learning group … 130 Low 20
(B21) … talk about something new in learning … 139 Low 16
(B22) … love challenges … 136 Low 17
(B23) … very interested in learning new things … 153 Low 14
(B24) … higher learning, life more enjoyable … 160 Low 11
(B25) … learning is fun … 167 Low 9
(B26) … want to learn more for self-development … 169 Low 7
(B27) … responsible for own learning … 176 Low 6
(B28) … age not prevent from learning new things … 178 Below moderate 5
(B29) … learning is life-long … 202 Moderate 1
(B30) … learn effective either individual or not … 135 Low 18
OVERALL SCORES 105.50 LOW
Other Factors Contributing to the Students’ Level of Understanding of E-Learning and Readiness for Self-Directed Learning
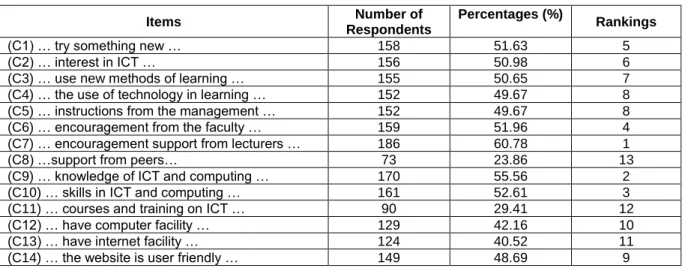
Table 6: Other Factors Contributing Students’ Level of Understanding of E-Learning
Items Number of
Respondents
Percentages (%)
Rankings
(C1) … try something new … 158 51.63 5
(C2) … interest in ICT … 156 50.98 6
(C3) … use new methods of learning … 155 50.65 7
(C4) … the use of technology in learning … 152 49.67 8
(C5) … instructions from the management … 152 49.67 8
(C6) … encouragement from the faculty … 159 51.96 4
(C7) … encouragement support from lecturers … 186 60.78 1
(C8) …support from peers… 73 23.86 13
(C9) … knowledge of ICT and computing … 170 55.56 2
(C10) … skills in ICT and computing … 161 52.61 3
(C11) … courses and training on ICT … 90 29.41 12
(C12) … have computer facility … 129 42.16 10
(C13) … have internet facility … 124 40.52 11
(C14) … the website is user friendly … 149 48.69 9
Hypotheses Testing
Table 7 shows the result for Hypothesis 1. The Mann-Whitney U test statistics = 110.000 with the p-value is larger than the chosen significance level (Alpha = 0.05), p = 0.605 > 0.05. Thus, the null hypothesis is accepted. This means that there is no significant relationship in the aspects of students’ gender with their readiness for self-directed learning. This finding supports the study conducted by Beach (2016) which states that the readiness for self-directed learning is the same regardless of male and female students.
Table 7: Test Statisticsb
Readiness
Mann-Whitney U 110.000
Wilcoxon-W 320.000
Z 2.446
Asymp. Sig. (2-tailed) 0.605
Exact Sig. [2*(1-tailed Sig.)] 0.605a
a = Not corrected for ties b = Grouping variable: Group
Table 8 shows the result for Hypothesis 2. The Kruskal-Wallis Chi-Square test statistics = 3.868 where d. f. = 4 and p = 0.003 < 0.05. Thus, the null hypothesis is rejected. This means that there is a significant relationship in the aspects of students’ education level with their readiness for self-directed learning. This finding supports the study done by Boyer and Usinger (2015) which states that the higher the education level, the more prepared are the students are for self-directed learning.
Table 8: Test Statisticsa, b
Readiness
Chi-Square 3.868
df 4
Asymp. Sig. 0.003
Exact Sig. 0.004
Point Probability 0.000
Table 9 illustrates the result for Hypothesis 3. The Kruskal-Wallis Chi-Square test statistics = 3.886 and d. f. = 4 with p = 0.823 > 0.05. Thus, the null hypothesis is accepted. This means that there is no significant relationship in the aspects of students’ faculty with their readiness for self-directed learning. This finding also supports the study conducted by Boyer and Usinger (2015) which states that the readiness for self-directed learning is the same among students regardless of their faculties.
Table 9: Test Statisticsa, b
Readiness
Chi-Square 3.886
df 4
Asymp. Sig. 0.823
Exact Sig. 0.824
Point Probability 0.000
a = Kruskal Wallis Test
b = Grouping variable: Treatment group
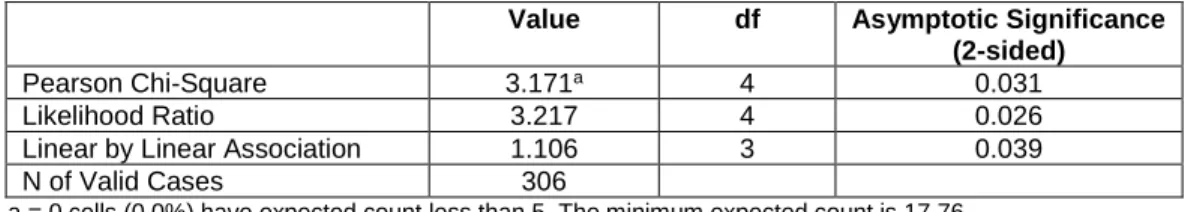
Next, Table 10 illustrates the result for Hypothesis 4. The Pearson Chi-Square test statistics = 3.171 and d. f. = 4 with p = 0.031 < 0.05. Thus, the null hypothesis is rejected. This means that there is a significant relationship in the aspects of students’ study grade with their readiness of self-directed learning. This finding supports the study done by Swart (2018) which indicates that the higher the students’ study grade, the ready they are to self-learning.
Table 10: Chi-Square Tests
Value df Asymptotic Significance
(2-sided)
Pearson Chi-Square 3.171a 4 0.031
Likelihood Ratio 3.217 4 0.026
Linear by Linear Association 1.106 3 0.039
N of Valid Cases 306
a = 0 cells (0.0%) have expected count less than 5. The minimum expected count is 17.76
Finally, Table 11 illustrates the result of Hypothesis 5. The Spearman’s Rho coefficient statistics = 0.259 with p = 0.000 < 0.05. Thus, the null hypothesis is rejected. This means that there is a significant positive relationship between the students’ level of understanding of e-learning with their readiness for self-directed learning. This finding supports the study conducted by Cadorin, Bressan and Palase (2017) which indicates that the higher the understanding, the ready the students are for self-learning. However, the Spearman’s Rho coefficient statistics (r = 0.259) indicates that the correlation between the students’ level of understanding of e-learning with their readiness for self-directed learning is WEAK.
Table 11: Correlationsb
Spearman’s Rho Understanding Readiness
Understanding
Correlation Coefficient 1.000 0.259*
Sig. (2-tailed) .000
N 306 306
Readiness
Correlation Coefficient 0.259* 1.000
Sig. (2-tailed) .000
N 306 306
CONCLUSION
The study found that the students’ level of understanding of e-learning is high. The most important factors contributing to their understanding of e-learning are the support and encouragement from lecturers, having knowledge of ICT and skills in computing. The study also found that the first most least factor contributing to their understanding of e-learning is the support from their peers. This shows they are easily influenced by peers. If peers refuse to change their learning methods, then they are reluctant to change too. This finding supports the study done by Tekkol and Demirel (2018) which states that students should be wise to use diverse learning methods without relying on their peers to make e-learning environment attractive. The second most least factor contributing to their understanding of e-learning are having internet facilities and attending courses and training on ICT. This result supports the study conducted by Grover (2015) which indicates that the lack of internet facilities and limited number of computers provided by the management demotivated the students because they have to wait a long time to retrieve materials from the website. The students also understood the importance of attending courses and training related to e-learning. However, understanding is not enough if they are not committed to follow the training until the end. According to Cook et al. (2017), in implementing e-learning, the students should follow the training until the end to develop their skills and understanding in the usage of the electronic materials and hardware. Thus, the management of the university should be aware with the appropriateness of the training given and the suitability of the training time.
On the contrary, the study found that although the students’ level of understanding of e-learning is high, their readiness for self-learning is low. Apart from the provision of various web-based learning applications given, lecturers still play an important role in supporting and encouraging the students to seek knowledge by engaging them through e-learning to overcome their weakness for self-learning. For example, lecturers may require quizzes or tests through e-learning. Lecturers can also encourage students to hold discussion sessions through communication facilities such as chat, email and forums. Through the cooperation of all parties, this e-learning method is expected to produce not only knowledgeable graduates but dare to face challenges.
REFERENCES
Beach, P. (2016). Self-directed online learning: A theoretical model for understanding elementary teachers’ online learning experiences. Teach Teacher Education, 61, 51-60. https://doi.org/10.1016/j.tate.2016.10.007
Boyer, N. R. & Usinger, P. (2015). Tracking pathways to success: Triangulating learning success factors. International Journal Self Directed Learn, 12, 22-48. Retrieved from https://www.sdlglobal.com/journals
Cadorin, L., Bressan, V. & Palase, A. (2017). Instruments evaluating the self-directed learning abilities among nursing students and nurses: A systematic review psychometric properties. BMC Medical Education, 17:13. Retrieved from https://www.ncbi.nlm.nih.gov/pubmed/29178924
Cassidy, S. & Eachus, P. (2012). Developing the computer self-efficacy (CUSE) scale: Investigating the relationship between computer self-efficacy, gender, and experience with computers. Journal of Educational Computing Research, 26 (2), 133-153. Retrieved from https://journals.sagepub.com/doi/10.2190/JGJR-0KVL-HRF7-GCNV
Cook, D., Blachman, M. J. Price, D., West, C. P., Berger, R. A. & Wittich, C. M. (2017). Professional development perceptions and practices among US physicians: A cross specialty national survey. Academic Medicine, 92, 1335-1345. https://doi: 10.1097/ACM.0000000000001624
Geng, S., Law, K. M. Y. & Niu, B. (2019). Investigating self-directed learning and technology readiness in blended learning environment. International Journal of Educational Technology in Higher Education, 16, 8-17. https://doi.org/10.1186/s41239-019-0147-0
Grover, K. (2015). Online social networks and self-directed learning experience during a health crisis. International Journal Self Directed Learn, 12, 1-15. https://doi.org/10.3389/fpsyg.2018.02324
Gugleilmino, P. J., Gugleilmino, L. M. & Long, H. B. (1987). Self-directed learning readiness and performance in the workplace implications for business, industry and higher education. Higher Education, 16, 303-317. Retrieved from https://files.eric.ed.gov/fulltext/ED581868.pdf
Krejcie, R. V. & Morgan, D. W. (1970). Determining sample size for research activities. Journal of Educational and Psychological Measurement, 607-610. Retrieved from http://www.sciepub.com/reference/145556
Slater, C. E., Cusick, A. & Louie, J. C. Y. (2017). Explaining variance in self-directed learning readiness of first year students in health professional programs. BMC Medical Education. 17:207. Retrieved from https://bmcmededuc.biomedcentral.com/articles/10.1186/s12909-017-1043-8
Swart, A. J. (2018). Self-directed learning fashionable among all first year African engineering students? Central University of Technology, 20, 15-22. Retrieved from http://ir.cut.ac.za/handle/11462/1508 Swatsky, A. P., Ratelle, J. T., Bonnes, S. L., Egginton, J. S. & Beckman, T. J. (2017). A model of
self-directed learning in internal medicine residency: A qualitative study using grounded theory. BMC Medical Education, 17:31. Retrieved from https://www.ncbi.nlm.nih.gov/pubmed/28148247