10
DESIGN OF CORPORATE PERFORMANCE MANAGEMENT
SYSTEM: CASE STUDY AT X COMPANY IN INDONESIA
Dermawan Wibisono
Graduate School of Business and Management, Bandung Institute of
Technology, Bandung, Indonesia
Hong Mee Hoa
Foodex Indonesia Company
Pungkas Untea
Telkom Indonesia Company
Keywords: Performance Management, the Balanced Scorecard, Malcolm Baldrige National Quality
Award
Abstract This paper focus on design of company performance management for corporate level of
X
Company
that produces food ingredient to supply instant noodle, snack and processed meat
industries. The framework of proposed performance measurement systems is combining of the
Balanced Scorecard (BSC) and Malcolm Baldrige National Quality Award (MBNQA). Four
perspectives that are Financial, Customer, Internal Process, and Learning & Growth are based on
the BSC framework in which in every perspective several variables are developed using the BSC as
well as the MBNQA approaches. In the Financial Perspective there are three indicators focuses
namely Shareholder Satisfaction, Direct Profit Contribution and Asset Utilization. In the Customer
Perspective consist of Customer Satisfaction, Market Share and Based Customer. In the Internal
Business Process perspective consist of four indicators namely New Product Development, Supply
Chain Management, Productivity and Quality System. Learning & Growth perspective consists of
three indicators namely Leadership Quality and Employer’s Competency, Organization Development
and Employer’s Retention, and Information & Technology System.
Introduction
To be classified as World Class
Manufacturers (WCM), manufacturing
organisations need to have a number of
critical ingredients; one such ingredient
is that of an appropriate Performance
Management System (Medori and
Steeple, 2000). The concept of
performance measurement has been
accepted, for some years now, as an
essential part of WCM (Sellenheim,
1991) and the importance of
measurement is well covered in the
literature. Throughout the 1990s, various
novel frameworks have been derived, to
aid manufacturing organisations to select
and implement measures, such as
Prism
(Neely, 1999), the
Balanced Scorecard
(Kaplan and Norton, 1996),
Vital Signs
11
a specific company, are seldom
described in detail.
In recent years there is a trend in
flavor business in Indonesia to merger
between Indonesia’s companies and
international flavor house to strengthen
their competitiveness. To name some of
this merger are International Flavor &
Fragrance (IFF) with Bush Boake Allen,
Givaudan with Food Ingredients
Specialist & Taste Maker, and Haarman
& Rheimer with Dragoco. PT. X
produces food ingredient to supply
instant noodle, snack and processed meat
industries and is the only Indonesia’s
company has to compete with those
multi national companies. To beat that
competition PT. X needs to develop
appropriate strategy supporting with
reliable PMS both at corporate level as
well as individual level. The existing
system of PMS at PT. X is established
trough development process of five years
planning based on the Chief Executive
Officer's (CEO) direction. From that
direction then each department directors
translate into their program. These
programs then have to be presented in
front of the CEO and if the CEO agrees
then these documents are signed as Five
Years Business Plan for that department.
The problem encountered of this current
practice is that the system focuses on the
annual budget for merely monitoring not
for managing strategically. Most of
current strategy and programs are
developed separately in each functional
department with no linkages among them
and the focus of the programs is based on
the availability of the budget. The
research question will be answered in
this paper then what kind of integrated
PMS appropriate to PT. X that not only
focus on financial aspect but also non
financial aspect that align to the
company’s vision and mission and can
be used as management communication
tools among departments?
Research Methodology
12
Figure 1. Research Methodology
Determining of Key Perf
or
mance
Area
Determining Perfor
m
ance
Measure
m
ent vari
able
Str
ategy map
determination
PMS F
ra
m
ework
analysis
Problem identific
a
tion SYMPTOMS:
1. No integrated focus among department
2. No linkage between strategy and performance
appraisal
3. Performance management does not support vision & mission
LITERATURE REVIEW:
1. The Balanced Scorecard
2. Malcolm Baldrige National Quality Award
3. Prism
Vision analysis
Map of weighting involvement of each perspective in each department OBSERVATION:
Department Head, Monthly meeting, Department Head meeting
SECONDARY DATA COLLECTION: KRA department, monthly report
Problem formulation: Design of Integrated Performance Management
Determining Framework
Model Validation
Objectives analysis Company’s document:
1. Five years plan 2. Annual operating plan
STRATEGY MAP
SURVEY DESIGN: 1. Method: questionnaire 2. Respondent: all managers 3. Questionnaire design 4. Questionnaire pre-testing 5. Questionnaire improvement
Table 1. Interco relation between BSC and MBNQA
BSC
MBNQ
A
FINANCIAL CUSTOMER INTERNAL PROCESS
BUSINESS
LEARNING & GROWTH
LEADERSHIP
Organizational Leadership SEF
Public Responsibilities & citizenship SOF
STRATEGIC PLANNING
Strategy development SBTF SBTF SBTF SBTF
Strategy Deployment SEF SEF SEF SEF
CUSTOMER & MARKET FOCUS
Customer & market knowledge SBTF
Customer satisfaction & relationship SBTF
MEASUREMENT, ANALYSIS & KNWOLEDGE MANAGEMENT
Measurement of Organizational Performance SBTF SBTF SBTF
Analysis of organizational performance SBTF SBTF SBTF
HUMAN RESOURCE FOCUS
Work System SEF
Employee education, training & development SEF
Employee well-being & satisfaction SEF
PROCESS MANAGEMENT
Product & Service Process SEF
Support process SEF
Supplier & partnering process SEF
BUSINESS RESULTS
Customer focused results SBTF
Financial & market results SBTF
Human resource results SEF
Supplier & partner results SEF
Organizational Effective results SBTF
SBTF: substances in both of two approaches
14
Research Result
Based on the intensive analysis of
company’s nature of business and the
characteristic of Performance
Management System (PMS) framework
stated in the literature, the framework
chosen for proposed PMS is combination
between BSC and MBNQA in which the
Interco relation between that two
approaches can be summarized as in the
Table 1.
It can be seen that both the BSC and
MBNQA framework have similarities
scope on performance perspectives even
though there are several different focus
on them. By combining those two
frameworks the proposed model would
more comprehensive in capturing
performance variables and increasing
applicability in the current though
competition. The MBNQA fulfill the gap
especially in the aspects of leadership
and internal processes business.
Furthermore, public responsibility and
citizenship as important factors should
be considered in this kind of industry
also becoming focus of MBNQA that
would enrich the BSC framework. Based
on the chosen framework and analysis of
company’s vision, mission, goal, five
15
Table 2. Strategy Map
Company Statement Vision: To be leading food ingredient suppliers. Mission: Provide high quality
and innovative products. Goal: Health and continuous growth
Financial Perspective F1: Increasing shareholder satisfaction through managing Return on
Investment
F2: Increasing direct profit contribution through managing customer group, product category, total sales and decreasing department expense F3: Increasing Assets utilization through managing working capital turnover
Customer Perspective C1: Increasing customer satisfaction through managing customer satisfaction
index, customer retention and customer intimacy
C2: Increasing market share through managing main customer and market share product group
C3: Increasing base customer through managing customer acquisition Internal Business Processes
Perspective
I1: Increasing new product development through managing new product sales, new product development success rate, new product sales internal driven I2: Improving Supply Chain Management through managing order fulfillment I3: Increasing productivity through managing inventory turnover, reprocesses
and cost reduction
I4: Improving Quality System through managing GMP audit, halal certification, and implementation ISO standard
Learning & Leadership Perspective
L1: Increasing leadership quality & employers’ competencies through managing core competencies, leadership score
L2: Organizational development & employees’ retention through managing employee satisfaction & retention
16
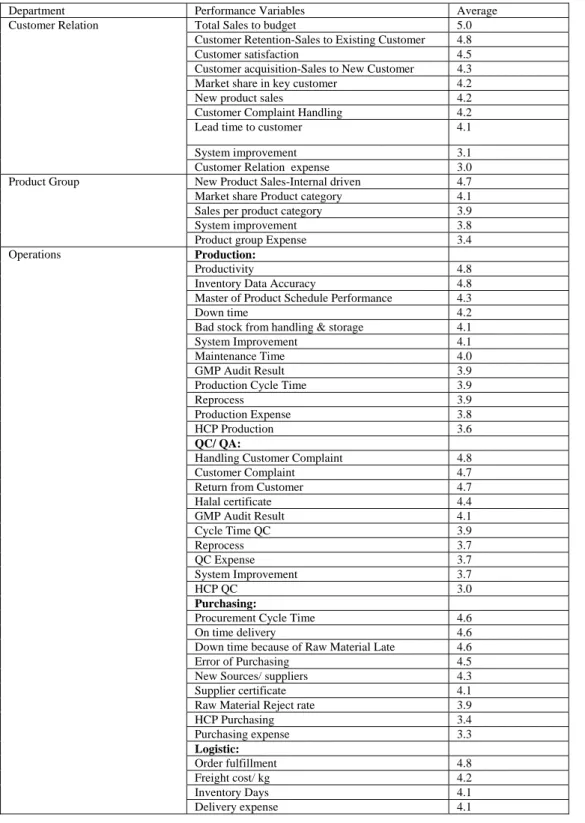
Table 3. The Important of Performance Variables in Each Department
Department Performance Variables Average
Customer Relation Total Sales to budget 5.0
Customer Retention-Sales to Existing Customer 4.8
Customer satisfaction 4.5
Customer acquisition-Sales to New Customer 4.3
Market share in key customer 4.2
New product sales 4.2
Customer Complaint Handling 4.2
Lead time to customer 4.1
System improvement 3.1
Customer Relation expense 3.0
Product Group New Product Sales-Internal driven 4.7
Market share Product category 4.1
Sales per product category 3.9
System improvement 3.8
Product group Expense 3.4
Operations Production:
Productivity 4.8
Inventory Data Accuracy 4.8
Master of Product Schedule Performance 4.3
Down time 4.2
Bad stock from handling & storage 4.1
System Improvement 4.1
Maintenance Time 4.0
GMP Audit Result 3.9
Production Cycle Time 3.9
Reprocess 3.9
Production Expense 3.8
HCP Production 3.6
QC/ QA:
Handling Customer Complaint 4.8
Customer Complaint 4.7
Return from Customer 4.7
Halal certificate 4.4
GMP Audit Result 4.1
Cycle Time QC 3.9
Reprocess 3.7
QC Expense 3.7
System Improvement 3.7
HCP QC 3.0
Purchasing:
Procurement Cycle Time 4.6
On time delivery 4.6
Down time because of Raw Material Late 4.6
Error of Purchasing 4.5
New Sources/ suppliers 4.3
Supplier certificate 4.1
Raw Material Reject rate 3.9
HCP Purchasing 3.4
Purchasing expense 3.3
Logistic:
Order fulfillment 4.8
Freight cost/ kg 4.2
Inventory Days 4.1
17
Logistic Expense 3.8
System Improvement 3.7
HCP Logistic 3.6
Finance & Accounting Report Submission 4.8
Return On Investment 3.9
Cost management initiative 3.9
Working Capital Turnover 4.1
A/R Collection 4.9
A/P Payment 4.7
IT program Implementation 3.8
Adequacy of Internal Control System & Compliance
4.1
Human Resource Development Employee Satisfaction 4.6
Employee Retention 4.5
Recruitment Fulfillment 4.1
Training 4.0
Man Power Planning 4.0
System Improvement 3.8
Performance Appraisal Summary 3.7
Research & Development New Product Sales-Total 4.5
New Product Sales-Internal Driven 4.5
Technology Development 4.4
Cost Reduction-Reformulation 4.3
Quality Improvement 4.1
New Product Development Cycle Time 3.9
New Product development Success Rate 3.7
System Improvement 3.7
R & D Expense 3.3
18
Table 4. Key Result Area Customer Relation Department
Perspective Strategic Goal Weight Key Performance Indicator
F2 Increasing DPC 20 DPC customer group
Total Sales
C1 Increasing Customer Satisfaction 30 Customer Satisfaction
Customer complaint handling
Customer retention
Sales forecast accuracy
C2 Increasing Market Share 20 Market share in key customer
C3 Increasing Base customer 17 Customer acquisition
I1 Increasing new product development 13 New product sales
New product development success rate Total 100
Table 5. Key Result Area Product Group
Perspective Strategic Goal Weight Key Performance Indicator
F2 Increasing DPC 29 DPC Product category
Total sales
C2 Increasing Market Share 29 Market share product category
I1 Increasing new product
development
19 New product sales
I3 Improving Information System &
Technology
23 IT program implementation
Technology development
Total 100
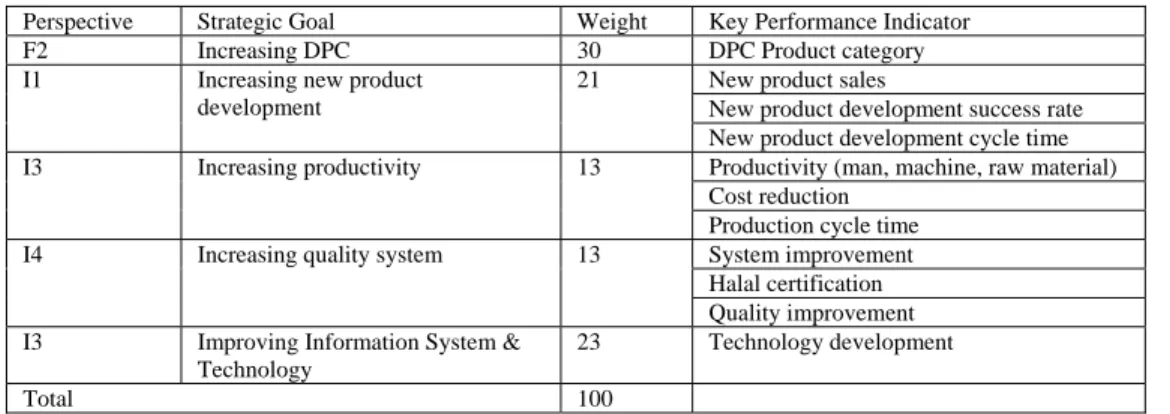
Table 6. Key Result Area Research & Development Department
Perspective Strategic Goal Weight Key Performance Indicator
F2 Increasing DPC 30 DPC Product category
I1 Increasing new product
development
21 New product sales
New product development success rate New product development cycle time
I3 Increasing productivity 13 Productivity (man, machine, raw material)
Cost reduction Production cycle time
I4 Increasing quality system 13 System improvement
Halal certification Quality improvement
I3 Improving Information System &
Technology
23 Technology development
19
Table 7. Key Result Area Operations Department
Perspective Strategic Goal Weight Key Performance Indicator
F2 Increasing DPC 19 DPC Customer Group
Department Expenses
F3 Increasing Asset Utilization 13 Working Capital Turnover
C1 Increasing Customer Satisfaction 30 Customer Complaint Handling
Lead Time to Customer
I2 Improving SCM Processes 21 Procurement Cycle Time
Down Time of Raw Material Delay New Source Supplier
Order Fulfillment
I3 Increasing Productivity 9 Productivity of labor, machine & raw
material
Inventory turnover Freight cost/kg
Cost reduction-Raw Material Reprocesses
Production Cycle Time
I4 Increasing Quality System 8 GMP Audit Result
System Improvement Inventory Data Accuracy Halal Certification Quality Improvement Return from Customer
Total 100
Table 8. Key Result Area Customer Finance & Accounting Department
Perspective Strategic Goal Weight Key Performance Indicator
F2 Increasing DPC 30 DPC Customer Group
Department Expense
F3 Increasing Assets Utilization 20 Department Expense
A/R Collection A/P Payment
I3 Increasing Productivity I3 Productivity of labor, machine & raw
material
I4 Increasing Quality System 13 System Improvement
L3 Increasing Technology &
Information System
24 Accuracy & timely Report Submission
IT Program Implementation
Adequacy of Internal Control System & Compliance
Technology Development
20
Table 9. Key Result Area Human Resource Development Department
Perspective Strategic Goal Weight Key Performance Indicator
I3 Increasing Productivity 13 Productivity of labor, machine &
raw material
I4 Increasing Quality System 13 GMP Audit Result
System Improvement
L1 Increasing Leadership Quality
& Employees’ Competences
29 HCP Department
Performance Appraisal Summary Core Competences
L2 Organizational Development 23 Employee Loyalty
Employee Satisfaction Recruitment Fulfillment Man Power Planning Accuracy
L3 Increasing Technology &
Information System
22 Accuracy & Timely Report
Submission
IT Program Implementation Adequacy of Internal Control System & Compliance Technology Development
Total 100
Table 10. Advantages of the Proposed PMS Model
Department Focus Existing PMS Support by Proposed
PMS
Customer Relation Customer satisfaction,
sales & profit
Sales Customer Group, New Customer Development, New Expense Control, Human Capital Productivity
All that existing variables plus Customer
Satisfaction, Customer Retention
Product Group Growth of Group
Product
Sales/ product category, new product/ product category, Raw Material ratio, Product Group expense, Promotion & Product research
New Product Sales internal driven, market share product category
Research & Development
New Product Development
New Product launch, on time development, cost reduction, project Accomplishment
New Product Development Success rate, New Product Development Cycle Time, Technology development
Operations Customer Order
Fulfillment with productive human resources
Inventory level, New Sources Raw Material, Order Fulfillment, Operations Expense, Cost Reduction, Customer Complaint
Down Time, Inventory Data Accuracy, Procurement Cycle Time, rating Supplier, GMP Audit Result
Finance & Accounting Financial Performance
supporting with information system
Report Submission, Cost Management Initiative, Working Capital Turn Over, A/R Collection, A/P Payment, ERA soft
Implementation, Adequacy of Internal Control System & Compliance Costing System Human Resource Development Human Resource Development
Recruitment, Employee Turn Over, Training Development, Reward & Punishment System, Industrial Relation, Employee Leadership
21
Table 11. The Weighting of Responsibilities for Each Department
No Perspective Strategic Goal Weight KRA Department
CR PG R&D OP F&A HRD
1 F1 ROI 7 - - - - - -
F2 Increasing DPC 9 20 29 30 19 30 -
F3 Increasing Assets Utilization 6 - - - 13 20
2 C1 Increasing Customer Satisfaction 14 30 - - 30 -
C2 Increasing Market Share 10 20 29 - - -
C3 Increasing Base Customer 8 17 - - - -
3 I1 Increasing New Product
Development
6 13 19 20 - -
I2 Improving SCM Processes 10 - - - 21 -
I3 Increasing Productivity 4 - - 13 9 13 13
I4 Improving Quality System 4 - - 13 - 14 13
4 L1 Increasing Leadership Quality &
Employees’ Competences
8 - - - - - 29
L2 Organizational Development 7 - - - - - 23
L3 Improving Technology &
Information Systems
7 - 23 23 - 23 23
Total 100 100 100 100 100 100 100