Genome analysis
DeFCoM: analysis and modeling of transcription
factor binding sites using a motif-centric
genomic footprinter
Bryan Quach
1,2,3,* and Terrence S. Furey
2,3,*
1
Curriculum in Bioinformatics and Computational Biology,
2Department of Genetics and
3Department of Biology,
University of North Carolina, Chapel Hill, NC 27599, USA
*To whom correspondence should be addressed. Associate editor: Inanc Birol
Received on September 3, 2016; revised on October 23, 2016; editorial decision on November 16, 2016; accepted on November 18, 2016
Abstract
Motivation:
Identifying the locations of transcription factor binding sites is critical for
understand-ing how gene transcription is regulated across different cell types and conditions. Chromatin
acces-sibility experiments such as DNaseI sequencing (DNase-seq) and Assay for Transposase
Accessible Chromatin sequencing (ATAC-seq) produce genome-wide data that include distinct
‘footprint’ patterns at binding sites. Nearly all existing computational methods to detect footprints
from these data assume that footprint signals are highly homogeneous across footprint sites.
Additionally, a comprehensive and systematic comparison of footprinting methods for specifically
identifying which motif sites for a specific factor are bound has not been performed.
Results:
Using DNase-seq data from the ENCODE project, we show that a large degree of
previ-ously uncharacterized site-to-site variability exists in footprint signal across motif sites for a
tran-scription factor. To model this heterogeneity in the data, we introduce a novel, supervised learning
footprinter called Detecting Footprints Containing Motifs (DeFCoM). We compare DeFCoM to nine
existing methods using evaluation sets from four human cell-lines and eighteen transcription
fac-tors and show that DeFCoM outperforms current methods in determining bound and unbound
motif sites. We also analyze the impact of several biological and technical factors on the quality of
footprint predictions to highlight important considerations when conducting footprint analyses and
assessing the performance of footprint prediction methods. Finally, we show that DeFCoM can
de-tect footprints using ATAC-seq data with similar accuracy as when using DNase-seq data.
Availability and Implementation:
Python code available at https://bitbucket.org/bryancquach/
defcom
Contact:
[email protected] or [email protected]
Supplementary information:
Supplementary data
are available at
Bioinformatics
online.
1 Introduction
Chromatin dynamics vary based on developmental stage (Thomas
et al., 2011), cell-type (Songet al., 2011) and environmental stress (Nag and Smerdon, 2009). Transcription factors (TFs) bind DNA in regions of accessible chromatin and play a central role in pre-transcriptional gene regulation. Understanding these interactions is critical in deciphering transcriptional regulation that defines cell
identity in different contexts. DNase-seq (Boyleet al., 2008a) and ChIP-seq (Johnsonet al., 2007) identify regions of accessible chro-matin and TF binding genome-wide, respectively. Notably,
Hesselberthet al.(2009)observed that DNase-seq produces ‘foot-prints’ at active TF binding sites characterized by a relative depletion of DNase-seq signal at these sites. Thus, a single DNase-seq experi-ment captures high-resolution TF binding information for many
VCThe Author 2016. Published by Oxford University Press. All rights reserved. For Permissions, please e-mail: [email protected] 956 doi: 10.1093/bioinformatics/btw740
Advance Access Publication Date: 29 December 2016
TFs. As performing ChIP-seq for multiple TFs quickly becomes cost prohibitive, DNase-seq footprinting offers an enticing alternative.
Several computational footprint identification methods, which we will refer to as ‘footprinters’, have been developed (Boyleet al., 2011;Chenet al., 2010;Kahara and Lahdesmaki, 2015;Luo and Hartemink, 2013;Nephet al., 2012;Piperet al., 2013;Pique-Regi
et al., 2011;Rajet al., 2015;Sherwoodet al., 2014;Sunget al., 2014). These footprinters embrace one of two philosophies, which we denote as de novo and motif-centric footprinting (see
Supplementary Table S5for an overview of methods). Models gen-erated byde novofootprinters assume that there exist general data characteristics at footprint sites. These TF-agnostic models are used to predict all footprint sites, and then motif databases are queried to determine potential TFs bound in each individual footprint. In con-trast, motif-centric footprinters first generate a set of candidate TFBSs based on a motif, and then predict at which motif sites a foot-print exists, indicating active binding. Within each group, current methods exhibit similarities in approach. For instance, thede novo
footprinters DBFP, HINT, and the HMM-based method described inBoyleet al. (2011)model footprints using probabilistic graphical models with similar state representations. FOS, Wellington, and DNase2TF arede novofootprinters that search for genomic loca-tions akin to short inverse peaks. The motif-centric footprinters CENTIPEDE, msCentipede and FLR utilize two-component mixture models to represent bound and unbound sites. In addition to DNase-seq data, some methods allow for the integration of comple-mentary information such as histone modification status or distance from the nearest transcription start site. All these methods implicitly or explicitly assume there exists two distinct signal patterns in DNase-seq data that distinguish TF-bound and unbound sites. Except for msCentipede, footprinters expect that DNase-seq signal is highly homogeneous in both the bound and unbound groups and thus can be represented by a single model. This assumes TFs bind DNA in the same manner genome-wide, but TF binding behavior can vary across TFBSs (Siggers and Gordan, 2014).
More recently, Kahara and Lahdesmaki proposed a supervised classification approach, BinDNase, that learns TF-specific DNaseI cleavage patterns from training data to predict footprints in other data. They show that their supervised approach often produced su-perior prediction accuracy over two unsupervised generative models, PIQ and CENTIPEDE. In contrast,Gusmaoet al.(2016) conducted a systematic footprinter comparison and found most generative model footprinters outperformed BinDNase. In their analysis, foot-print detection accuracy was evaluated within ade novo footprint-ing framework based on overlap with ChIP-seq peak annotations. It is not clear how accurately this evaluates motif-centric footprinter performance.
Here, we conducted an in-depth, motif-centered analysis of DNaseI digestion signals and DNase-seq footprinters to provide a more complete understanding of strengths and weaknesses of cur-rent methods. We introduce a novel motif-centered method, Detecting Footprints Containing Motifs (DeFCoM) that approaches footprint identification using a nonlinear supervised classification framework. Importantly, DeFCoM is designed to capture variation in DNaseI signal within active footprints and unbound motif sites to enhance footprint classification accuracy, a consideration un-accounted for in previous footprinters. We compared the per-formance of DeFCoM against both de novo and motif-centric footprinting approaches across eighteen TFs in four cell-lines using data from the Encyclopedia of DNA Elements (ENCODE) Project (Feingoldet al., 2004) and show that DeFCoM outperforms existing approaches overall. In addition, we analyzed the variability in
accuracy across multiple TFs and the effect of data quality and DNase-seq sequencing depth. Finally, we show DeFCoM can detect footprints in data from Assay for Transposase-Accessible Chromatin sequencing (ATAC-seq) experiments with similar classi-fication accuracy as with DNase-seq data.
2 Methods
2.1 Data and software
DNase-seq and ChIP-seq data (Supplementary Tables S1 and S2) were obtained from the UCSC ENCODE portal (https://www.gen
ome.ucsc.edu/ENCODE/). ATAC-seq data for GM12878
(Buenrostroet al., 2013) was obtained from GEO (GSE47753). The DAC Blacklisted Regions and Duke Excluded Regions for hg19 were downloaded from the UCSC Genome Database then combined into one set.
DeFCoM utilizes the Python packages PySam v0.9.0 and scikit-learn v0.17 (Pedregosaet al., 2012). The R package ROCR (Sing
et al., 2005) was used for computing performance statistics and the ROC curves for the footprinters. F-Seq (Boyleet al., 2008b) was used to call peaks for DNaseI hypersensitive sites.
2.2 Generating cell-line specific motif sites
Sets of motifs labeled as active (TF-bound) or inactive (TF-absent) were generated as follows: (1) Transcription factor motif position weight matrices were downloaded from http://compbio.mit.edu/en code-motifs/ (Kheradpour and Kellis, 2014). Motif occurrences were identified across the hg19 genome using FIMO (MEME v4.9.0) (Grantet al., 2011) with a genomic background nucleotide distribu-tion pre-computed by FIMO and the parameters ‘–max-strand – max-stored-scores 1000000 –no-qvalue’. (2) Predicted motif sites were removed if (i) they fell in ENCODE blacklisted regions, (ii) less than 10% of bases within a 200 bp window centered on the motif center had DNase-seq digestion data; (iii) they were less than 400 bp from chromosome boundaries; or (iv) there were ambiguous nucleo-tide calls within 400 bp of the motif site center. (3) Motif sites were annotated as active if they overlapped ChIP-seq peaks for that TF, else they were labeled inactive. If multiple motif sites overlap the same peak region, only the site closest to the annotated point-source of the peak was retained. To further ensure inactive sites were not bound, we calculated ChIP-seq and input control signal enrich-ments, defined assTFscontrol, wheresTFandscontrolare
sequencing-depth normalized read density values in 200 bp windows centered on the motif. Inactive sites wheresTFscontrol>0 were removed.
Motif sets were created for 18 TFs (CEBPB, CHD2, CTCF, EP300, GABPA, JUN-D, MAFK, MAX, MYC, NRF1, RAD21, REST, RFX5, SRF, SP1, TAF1, TBP and USF2) in four human cell-lines (GM12878, H1-hESC, HepG2 and K562) except SP1 in K562 (no data).
2.3 DNaseI signal profiles and correlations
Aggregate DNaseI signal profiles were calculated for active and in-active motif sites for each TF in each cell type (Supplementary Methods). DNaseI signal correlations for NRF1 were performed using only sites corresponding to the PWM ‘disc_1’, for CHD2 using motif ‘disc_1’ and for CEBPB using motif ‘known_1’ (Supplementary Figure S1) to ensure variability was not due to mul-tiple motifs. Motif sites were extended 50 bp from the motif center and signal profiles were calculated. To remove sites with spurious spikes in DNaseI activity, motif regions with more than 500 DNase-seq reads were removed. Profiles were smoothed using 7 bp sliding
windows to improve signal quality at sites with sparse signal. Aggregate mean DNaseI signal profiles for active and inactive sites were created using smoothed individual profiles. Pairwise Pearson correlation coefficients between active and inactive motif DNaseI profiles were used for complete-linkage hierarchical clustering fol-lowed by heatmap visualization.
2.4 DeFCoM feature extraction and training
Detecting Footprints Containing Motifs (DeFCoM) is an SVM-based (Boseret al., 1992) supervised footprinter. Given a set of motif sites labeled as active or inactive for a given TF in a cell type/ experimental condition, the SVM classifier is trained on features that are derived from DNase-seq data from the same cell type for each motif site. The trained model is used to predict active and in-active sites in a test set based only on DNase-seq data.
To train DeFCoM, motif site sets of sizemandn, labeled as ac-tive or inacac-tive respecac-tively, were generated as described above (2.2). The 50end of each DNase-seq read was considered a digestion
site. Initial active and inactive motif site DNaseI digestion count matrices,DActive
ms andDInactivens,were calculated, in which each
row corresponded to a scaled DNaseI digestion profile consisting of the square root of the DNaseI digestion frequency at each position in ans-sized region centered on a motif site. For all the training and evaluation tests,s¼200 bp regions were used. To account for spuri-ous spikes in the data, any row in the matrix with a value greater than冑500 was removed.
Intuitively, we wished to generate DNase digestion features in windows around a motif site, with smaller windows used near the motif site where the TF binds to allow for greater resolution, and progressively larger windows used at more distant regions. We also wanted to account for sparse or noisy DNaseI data. Given the region sizes, we first defined varying-sized, non-overlapping, contiguous windows symmetric about the motif site center. Letx2{0,1,2,. . .,k}
index each window starting at the motif site center with the win-dows progressively increasing in size from 0 tok. We definef(x), the size of windowx, to be
f xð Þ ¼
x2þ5; x<k
s
2g xð Þ
þx2þ5; x¼k
8 <
: (1)
g xð Þ ¼ g xð 1Þ þx
2þ5; x0
0; x< 0 (
(2)
where the recursive functiong(x)equals the sum total size of all win-dows up to and including windowx. The total number of windows
kthat will span a region of sizes/2 can be calculated as follows:
argmink
s
2g kð Þ
js
2g kð Þ 0 (3)
InEquations (1)and(3), we uses/2 because windows are symmetric about the motif center. Fors¼200, we defined 12 windows (6 on each side of the motif site center) with sizes 45, 21, 14, 9, 6, 5, 5, 6, 9, 14, 21 and 45. For each window, we computed the mean of the scaled DNaseI digestion counts and the slope of these counts across the window usingDActiveandDInactive. This generated a feature
vec-torfof length4k. To provide additional global features of the region
s, we partitioned a 90 bp segment centered on the motif center into 3 windows, computed the mean and slope for these windows (6 fea-tures total), and calculated the mean cut frequency of a 150 bp re-gion centered on the motif center (1 feature). Finally, we used maximal absolute value scaling to scale each of the 4kþ7 features
to a [1,1] range. This results in the final feature matricesFActive
andFInactive.
As part of the training process, DeFCoM selects between a linear and radial basis function (RBF) kernel SVM to use as the final classi-fier. To decide between the two SVM models, we bootstrapped 1000 samples 100 times from each ofFActiveandFInactiveand applied
5-fold cross validation. We used the mean pAUCs (5% FPR) from the cross validations to select a model. We additionally derived the kernel parameter and SVM hyperparameter through bootstrapping (Supplementary Methods). To improve the computational efficiency of the SVM training phase, the chosen SVM was trained with 3000 randomly selected samples from each ofFActiveandFInactiveto
pro-duce the final trained model.
For ATAC-seq data, theDActiveandDInactivematrices were
con-structed using Tn5 transposase tagmentation events as opposed to DNaseI digestion frequencies. Tn5 tagmentation sites are denoted as 50ATAC-seq read ends offset 5 bp downstream on the positive DNA
strand and 4 bp upstream on the negative strand.
2.5 Footprinter implementations for comparative
analysis
The footprinters BinDNase, CENTIPEDE, cut density, DNase2TF, HINT, FOS, msCentipede, PIQ and Wellington (Supplementary Table S5) were used to evaluate DeFCoM. These methods were chosen based on availability, compatibility with our evaluation framework, and their broad range of conceptually diverse approaches to footprinting (Seesupplementary methodsfor details on exact settings used for each footprinter).
2.6 Effective sequencing depth
Signal-to-noise was measured using FRiP (fraction of reads in peaks) scores (Landtet al., 2012). Peaks were called using F-Seq with de-fault parameters, then the ratio of DNase-seq reads aligning within the top 50 000 peaks (ranked by F-Seq score) to the total aligned reads was calculated. This ratio was multiplied by the total aligned reads to obtain the effective sequencing depth.
3 Results
3.1 Aggregate DNaseI digestion profiles do not capture
motif site heterogeneity
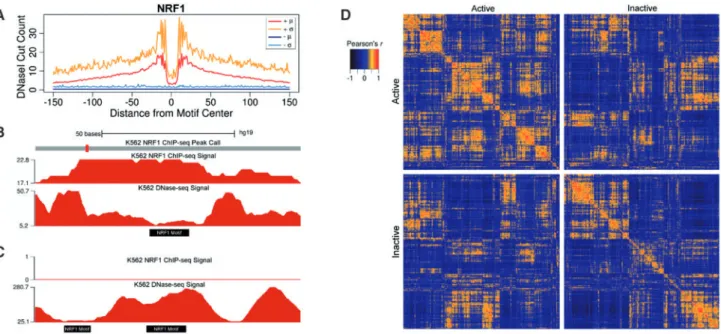
Aggregate mean DNaseI digestion profiles summarize positional DNaseI cleavage preferences at TFBSs. These profiles convey a sin-gle value at each position, thus they lack information regarding the variability in DNaseI activity at a given position across sites.Raj
et al.(2015)showed that variation in DNaseI activity at TF-bound SP1 motif sites exceeded that expected under a multinomial model of DNaseI digestion signal. To evaluate this more broadly, we deter-mined positional variability in DNaseI digestion signal for multiple TFs (Figure 1A; Supplementary Figure S2). We stratified motif sites into active and inactive based on presence of corresponding ChIP-seq signal for the factor in the same cell type (see Methods). We used these to evaluate two common assumptions held by several footprinting methods: (1) active TFBSs possess a general footprint pattern of local depletion in DNaseI digestion relative to flanking re-gions; and (2) inactive motif sites contain approximately uniformly distributed DNaseI digestion signal. For most factors, aggregate pro-files for active sites clearly produced expected DNaseI digestion pat-terns, but with relatively large standard deviations. An investigation of individual binding sites clearly shows how sites deviate from the aggregate pattern (Figure 1C and D). In some cases, the previously
characterized sequence preferences for DNaseI digestion (Heet al., 2013) are visually apparent. For a minority of the TFs, the aggregate profile for active sites portrays a visually weak footprint or none at all (i.e. SRF,Supplementary Figure S2). Overall, TFs exhibit aggre-gate profiles with consistently high coefficients of variation (Supplementary Figure S3).
In spite of position-specific variability across motif sites, it is pos-sible that DNaseI signal at individual sites resemble the aggregate profile in shape but not scale. To quantify the similarity of DNaseI digestion profiles at individual sites to the aggregate mean profiles, we calculated Pearson correlation coefficients between the aggregate profiles and every individual TFBS profile for CEBPB, CHD2 and NRF1 (Supplementary Figure S4). Among the three TFs, 30–63% of the individual profiles did not correlate with the same class aggre-gate profile (Pearson’sr<0.1). Interestingly, we found that 17–51% of individual profiles from the active and inactive classes exhibited stronger positive correlations with the aggregate profile from the op-posite class.
To further assess within and between class heterogeneity, we computed Pearson correlations between the top 2000 individual DNaseI digestion profiles, ranked based on the number of DNase-seq reads in a 100 bp window centered on the motif site, in the active and inactive classes for all three factors. We observed small clusters of highly correlated sites, implying possible subgroupings for DNaseI cleavage profiles within each class. We also found 34–53% of motif sites within each class exhibited negative or no correlation to each other (Pearson’sr<0) (Figure 1D; Supplementary Figure S5). Notably, 4–6% of correlations between sites from opposite classes had Pearson’sr>0.5. These analyses of variability in DNaseI digestion signal strongly indicate that aggregate mean profiles do not sufficiently capture the heterogeneity in DNaseI activity across motif sites.
We hypothesized that high correlations between sites from one class to the aggregate profile of the opposite class may be partially attributed to similarities in binding preferences for multiple TFs. Therefore, a motif site deemed inactive for a specific TF based on
ChIP-seq data could be active for another TF with a similar motif. We assessed this by determining how many inactive motif sites over-lapped ChIP-seq peaks for at least one other TF for each of 18 TFs in the K562 cell line. We found that this was the case for 8.85% of all inactive sites (Supplementary Figure S6). For most TFs, the num-ber of inactive motif sites was significantly larger than the numnum-ber of active sites (Supplementary Table S3). Thus, while the number of inactive sites overlapping another ChIP-seq peak was relatively small, these represented 0.41–32.21 times the total number of active motif sites for a TF. Footprint patterns at inactive sites that resemble active sites due to the binding of another factor highlights an import-ant consideration and caveat when conducting motif-centric foot-printing and evaluating the accuracy of footprint predictions. This also applies tode novofootprinting as it becomes an issue when annotating called footprints using motifs. A potential solution would be to exclude all motif sites overlapping ChIP-seq peaks for multiple TFs. However, this would remove 66–100% of active sites for a TF. Additionally, this would require conducting a multitude of ChIP-seq experiments and disregards the fact that many TFs have binding partners.
3.2 Modeling data heterogeneity for footprinting
To account for the high variance in DNaseI activity at motif sites, we devised a novel supervised learning based footprint prediction framework called DeFCoM. DeFCoM trains an SVM using ex-tracted features from DNaseI digestion profiles of motif sites labeled as active or inactive. In the training phase, DeFCoM applies a model selection procedure to choose between a linear kernel and nonlinear RBF kernel (Figure 2; Methods). This allows DeFCoM to capture the complexity of the data when necessary with the RBF kernel while avoiding over-fitting, a common problem in supervised learn-ing, by choosing the linear kernel when that complexity is lacking. Once trained, the SVM uses features from DNaseI digestion profiles for new, unlabeled motif sites to determine which are active and in-active in another cell-type/condition.
Fig. 1.Within and between class variability in DNaseI digestion signal at motif sites.(A) Per base means (m) and standard deviations (r) of DNaseI signal
aggre-gated for NRF1 motif sites active (þ) and inactive () in K562. (B) K562 DNase-seq and ChIP-seq signal at an NRF1 motif site (Chr1:16,175,923-16,176,022) from the active class and (C) two neighboring NRF1 inactive sites (Chr22:38,966,291–38,966,390). (D) Pairwise Pearson correlations between the top 2000 NRF1 motif sites from the active and inactive class ranked by DNaseI digestion signal.
To assess DeFCoM’s classification accuracy, we first performed 5-fold nested cross validation on 71 evaluation sets comprised of data from 18 transcription factors in the human cell-lines GM12878, H1-hESC, HepG2 and K562 generated by the ENCODE project. Second, we tested DeFCoM’s ability to generalize across cell types by training models using data from one cell type and testing on an independent cell type. We also wanted to know whether using the RBF kernel increased accuracy given the demonstrated hetero-geneity in these data. Therefore, for both sets of experiments, we used a linear and an RBF SVM and compared their classification performance. We will refer to these models as DeFCoM-linear and DeFCoM-RBF respectively. We calculated receiver operating char-acteristic (ROC) Area Under the Curve (AUC) values using all the data and also partial AUC (pAUC) values corresponding to partial ROC curves at a 5% false positive rate (FPR) cutoff.
When applied to the 71 data sets, DeFCoM-RBF performed bet-ter than a random classifier in all cases (Figure 3A). Notably, we observed a wide distribution of pAUC scores ranging from 0.096 to 0.981, but there was less variability in the full AUC scores (0.714– 0.998). For the cross cell-line experiments, we expected that add-itional variability across the two datasets would decrease perform-ance compared to the within cell-line cross validation tests. Indeed, we witnessed overall lower scores from the former but by a marginal amount (median pAUC decrease of 0.021) indicating there exists consistent footprint signals across cell types.
To determine whether using the nonlinear RBF kernel to model heterogeneity was warranted, we repeated the above experiments using the linear kernel. Overall, DeFCoM-RBF improved classifica-tion accuracy for all cell-lines in both experimental setups except for the cross cell-line case where the test set was derived from data in
the K562 cell line (Figure 3B). We saw that the pAUC increased as much as 0.141 when using DeFCoM-RBF. However, the pAUC was essentially the same in 31% of cross validation tests and 41% of cross cell-line tests. This demonstrates that the RBF kernel can pro-vide large gains in accuracy, but some factors or datasets may not possess enough DNaseI signal heterogeneity to benefit from more complex footprint modeling.
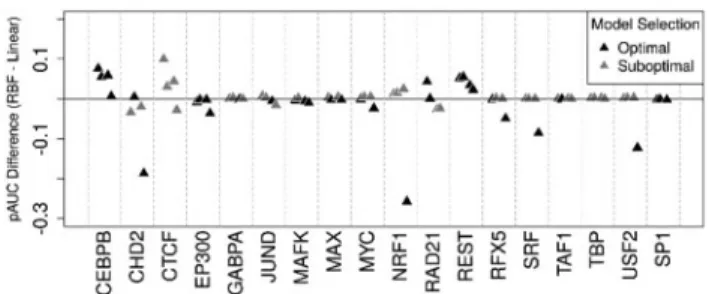
Interestingly, DeFCoM-linear performed substantially better on cross cell-line tests when training with GM12878 and evaluat-ing with K562 data. This demonstrated the need for flexibility in model complexity. Therefore, we incorporated a model selection step during DeFCoM training to automatically determine the most appropriate kernel for a given test (see Methods). We found that with the exception of CTCF, our model selection procedure identi-fied the better model in all cases in which there was a measurable difference between kernels (pAUC difference>0.05;Figure 4). We also evaluated alternative methods for addressing cross cell-line applications of DeFCoM and found the aforementioned approach produced the best results (Supplementary Methods;Supplementary Table S5).
3.3 Multiple variables impact motif-centric footprinting
In addition to addressing the heterogeneity of DNaseI signal at motif sites, our analyses provide insights into some variables that may af-fect motif-centered footprinting performance, though this is cer-tainly not an exhaustive list of contributing factors. Our observations suggest that the ‘footprintability’, i.e. the quality of footprinting, of any particular dataset is a function of several char-acteristics. We noted that features of the data from a particular cell-line and the specific TF being considered can contribute to footprint-ability. For instance, the pAUC is 0.36 higher on average in K562 compared to HepG2 for all cross validation experiments (Figure 3), suggesting that footprint signals in K562 are better overall. Within GM12878, the cross validation pAUC scores across TFs range from 0.210 to 0.915, highlighting the variability in footprintability across TFs. Finally, pAUCs for CHD2 are higher than CEBPB in all cell types (Supplementary Figure S7) suggesting active footprints for some factors are in general easier to discriminate than for others.
It is important to note that the four cell lines we use span a wide range of sequencing depths (Supplementary Table S4). We wondered how closely footprintability was associated with total sequencing depth. Since the signal quality across datasets can widely vary, we also wondered whether the ‘effective’ sequencing depth, based on the number of reads in DNaseI hypersensitive sites, was more important than simply the raw sequencing depth. We used mean pAUC values from DeFCoM’s nested cross validation experiments for each TF across all cell lines to compare footprintability based on total and ef-fective sequencing depth. Overall, we found that for most factors,
Fig. 2.Overview of the DeFCoM classification framework.
Fig. 3.(A) Partial (5% FPR) and full AUCs from evaluations of DeFCoM-RBF for
18 TFs in four cell-lines. Black horizontal lines signify values if classifications were random. (B) Comparison of DeFCoM to DeFCoM-linear by differences in pAUCs for the same test sets as A.
Fig. 4.Assessment of when the model selection procedure chooses the better
SVM type (linear versus RBF kernel) during the training phase of cross cell-line tests for 18 TFs.
accuracy increased nonlinearly with respect to total sequencing depth, but not effective sequencing depth (Supplementary Figure S8).
To better understand the trade-off between sequencing depth and signal quality, we focused on data from GM12878 and H1-hESC since they possess very different signal-to-noise ratios (0.19 versus 0.43 FRiP score). We performed 5-fold nested cross valid-ation using DeFCoM and data from each cell line subsampled to 25, 50, 75 and 100 million aligned reads and calculated pAUCs for each (Supplementary Methods). The effect of raw sequencing depth ver-sus signal quality became more apparent when we assessed changes in pAUC at a fixed 5% FPR under this framework (Supplementary Figure S9). As expected, the changes in pAUC vary by TF, but per-formance in the H1-hESC cell-line was less affected by increased sequencing depth. This suggests that for data with better signal-to-noise, informative DNaseI signals are present at lower sequencing depths, resulting in smaller improvements in footprintability with increased sequencing depth. We see the opposite in the GM12878 cell-line where increased sequencing depth substantially improves accuracy. When looking across sequencing depths at the number of H1-hESC active motif sites that are in the evaluation sets, we notice that more active sites meet the coverage filtering thresholds as sequencing depth increases. This shows that although much of the DNaseI signals may be present at lower sequencing depths, a higher sequencing depth can provide gains in sensitivity. The improvements in sensitivity will vary by TF, as evidenced by large increases for CTCF and RAD21 but significantly smaller increases for other TFs (Supplementary Table S10).
Interestingly, active footprints for some TFs were more accur-ately identified in GM12878 than H1-hESC at equivalent sequenc-ing depths despite the reduced signal-to-noise. This may be due to the FRiP score serving as a global signal quality measure rather than at the level of individual TFs. To investigate this further, we ana-lyzed the ratio of active motif sites to inactive sites for several TFs and found that many decreased drastically in GM12878 data with increasing sequencing depth compared to the same ratios in H1-hESC data (Supplementary Table S11). For instance, in GM12878 for SP1 this ratio was 16.8 at a sequencing depth of 25 million reads but decreased to 0.55 at 100 million reads. In H1-hESC, we observed a much smaller ratio change from 0.48 to 0.10 for the same factor (Supplementary Figure S11). The large changes in active to inactive site ratios in GM12878 suggest that in data with lower signal-to-noise, the number of inactive sites is more affected by sequencing depth, at least based on our criteria. Across all 18 TFs in GM12878, we witnessed a 0.71 inverse Pearson correlation on aver-age between the active to inactive site ratios and pAUCs for a TF. In H1-hESC the mean correlation was0.89. Overall, our results sug-gest that increasing sequencing depth to improve accuracy will
primarily benefit noisy datasets, and that signal quality in data will affect accuracy by varying the number of inactive motif sites that are considered compared to the number of active motif sites.
3.4 DeFCoM outperforms other footprinters
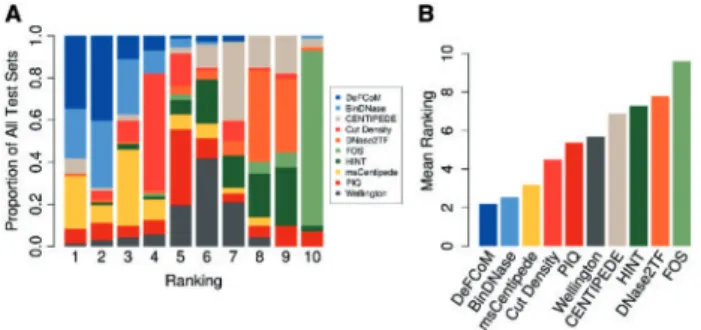
To provide a comprehensive study of footprinting from a motif-centric perspective, we compared DeFCoM with nine competing footprinters: BinDNase, CENTIPEDE, cut density, DNase2TF, HINT, FOS, msCentipede, PIQ and Wellington (Supplementary Table S5). All methods were assessed based on their ability to cor-rectly classify the same sets of motif sites for 18 TFs as active or in-active in the given cell-line. Partial AUCs (5% FPR) were calculated to compare the methods. For the supervised learning footprinters (DeFCoM and BinDNase), training was performed using data from K562 for test sets in GM12878, H1-hESC and Hepg2, and in GM12878 for test sets in K562. To summarize performance across all datasets, we ranked each method by pAUC for each of the 71 tests and calculated their mean rank across all tests (Figure 5). DeFCoM ranked first in 25 of the 71 evaluation sets (34.7%) and se-cond in an additional 29 test sets (40.3%). We see even better per-formance by DeFCoM when using pAUCs from within cell-line cross validation for the two supervised methods. DeFCoM ranked first 39 times (54.9%) and second 23 times (32.4%) (Supplementary Figure S12). DeFCoM had the best mean rank for results from both the cross cell-line and cross validation tests followed by BinDNase and msCentipede. Interestingly cut density, which simply predicts footprints based on the number of DNase-seq reads, had the fourth best mean rank despite not using any information about actual foot-print signals (Figure 5B,Supplementary Figure S15). Previous stud-ies witnessed similarly reasonable performance for this simple method (Cuellar-Partidaet al., 2012;Heet al., 2013), butGusmao et al. showed that cut density’s accuracy relative to other foot-printers suffers at a 1% FPR (Gusmaoet al., 2016). In our study, cut density had the fifth best mean rank using pAUCs at a 1% FPR (Supplementary Figure S13), still outperforming five other footprinters.
The improved classification accuracy of both DeFCoM and BinDNase over the unsupervised approaches highlights the utility of learning a discriminative model for motif-centric footprinting. Because DeFCoM defaults to a linear SVM model unless more com-plex modeling is required, we expect it to perform at least as well as BinDNase, which uses another type of linear model, logistic regres-sion. Also, including the nonlinear RBF kernel enables DeFCoM to outperform BinDNase by as much as 0.0835 pAUC, though we note that the two footprinters have essentially the same accuracy for 59 of the 71 datasets (pAUC difference<0.025). This increases to 65 of the 71 datasets using pAUC difference<0.05 (Supplementary Figure S14). BinDNase includes a computationally expensive greedy backward search to determine optimal features. Impressively, this shows that DeFCoM can achieve a similar or better accuracy than BinDNase using a set of predefined features that can be computed more efficiently. The greater overall performance of msCentipede relative to the other unsupervised footprinters indicates that model-ing heterogeneity with an unsupervised method can produce com-parable results to DeFCoM in some cases, though we note that for the factor TBP in HepG2, a model could not be learned in reason-able time (model training terminated after 60 days). For 48 of the 71 test sets, DeFCoM and msCentipede perform similarly (pAUC dif-ference<0.05), but using supervised learning affords DeFCoM bet-ter performance in 16 of the datasets (pAUC>0.05), including a pAUC difference of 0.25 for the RAD21 test sets.
Fig. 5.Comparison of footprinters. (A) Frequency at which each footprinter
obtains a rank (based on 5% FPR pAUC) for all 71 evaluation sets. (B) Mean rank, derived from A, of each footprinter.
3.5 ATAC-seq is comparable to DNase-seq for
footprinting
Like DNase-seq, ATAC-seq assays for accessible chromatin and can generate visible footprints in aggregate accessibility profiles for ac-tive motif sites. Its low biological sample material requirement rela-tive to DNase-seq makes it an appealing alternarela-tive when this is a limiting factor. We evaluated DeFCoM using GM12878 ATAC-seq data to determine its utility for motif-centric supervised footprint-ing. We applied 5-fold nested cross validation with the ATAC-seq data to train and test DeFCoM models for 18 TFs. The pAUC at 5% FPR and full AUC were averaged across the 5 folds. We then re-peated the nested cross validation with DNase-seq data on the same set of active and inactive sites (Figure 6). Despite the differences in sequencing depth of the DNase-seq (245 million reads) and ATAC-seq data (93 million reads), the pAUC and full AUC values are gen-erally similar, with DeFCoM performing slightly better when using DNase-seq (mean pAUC difference¼0.072, mean AUC differ-ence¼0.043). Overall this supports the feasibility of extending DeFCoM to experiments that use ATAC-seq.
3.6 DeFCoM as an open-source software package
Poor implementation and usability hinder the adoption of otherwise practical tools in the scientific community. With this in mind, we im-plemented DeFCoM to be an easy-to-use software package with a code-base that follows good software design principles. For both end-users and developers, we make our code freely accessible via a code repository (https://bitbucket.org/bryancquach/defcom) with ex-tensive API documentation and a user guide. DeFCoM is the only supervised learning footprinter supported by thorough documenta-tion to improve ease of use. We also include well-commented scripts to handle common data processing tasks for footprint analysis. DeFCoM is implemented in the Python programming language within an object-oriented framework that enhances modularity of the code for easy debugging, modification, and extension. Furthermore, because DeFCoM is a data-intensive method, we make use of scalable programming techniques such as batch process-ing and parallel computprocess-ing to ensure feasibility for use on a modern desktop machine. As an open-source software package, we encour-age the community to modify and adapt our code for further ad-vancements in footprinting research.
4 Discussion and conclusions
Our study provides novel insights into variables that affect identifi-cation of DNaseI footprints, and for the assessment of footprinter performance. Aggregate DNaseI digestion profiles do not represent well the footprint patterns seen at individual sites, thus footprinters
that use models based on aggregate or general footprint signal pat-terns may suffer. Inactive motif sites for one TF may be bound by another TF that creates a footprint and thus be misclassified, at least for the original TF. This is a general challenge in the assessment of motif-centric approaches, but this does not necessarily reflect a weakness in these footprinters. The motif-centric footprinter is cor-rectly identifying a footprint, though it mistakenly attributes it to the wrong factor. Arguably, this is better than spuriously identifying a footprint at a location where no factor is bound. This serves as an important consideration for both interpreting footprint predictions and assessing footprinters in a motif-based framework.
Heterogeneity in DNaseI digestion signals at motif sites exists, and we show that our DeFCoM footprinter benefits from being aware of this heterogeneity. At the same time, we also show that incorporating the flexibility to use more or less complicated models depending on the particular TF, cell line, and dataset is important as well. DNase-seq and ATAC-seq footprint signals will vary based on biological and technical factors that influence the data. Footprinters that can model footprints well across this range of variability will obviously be more robust. Supporting this, msCentipede also models heterogeneity and was the best performing method that did not use supervised learning, though we found this method may be limited by unreasonable training times for specific datasets.
We show that determining appropriate sequencing depth for footprinting is not easy and is affected by many variables. We observed sequencing depth affected footprinter accuracy less when the DNase-seq data had a better signal-to-noise ratio, but we also witnessed variation in TF-specific footprintability at equivalent sequencing depths between cell-lines.Sunget al. (2014)provided evidence that DNA residence time plays a role in the clarity of a footprint signal. Likewise, greater sequencing depth generally increased the number of sites where footprints were identified, but the benefit to individual factors varies. Biological variables such as these need to be further assessed on a per-TF basis in conjunction with technical factors to better realize which of these most strongly contribute to footprintability. This knowledge would help determine how to appropriately design footprinting experiments.
For footprinters such as DeFCoM that use supervised learning, the concordance between features of the training and test sets be-come important. Although this introduces added complexity, it can be leveraged to achieve more targeted results. For instance, high-confidence footprints in DNaseI hypersensitive sites could be identi-fied by tailoring the training set to include only sites in areas of high DNaseI activity. Doing so would make the model more representa-tive of these stronger footprint signals, though at the expense of gen-eralizability to low signal regions. Potential variability between training and test sets should be minimal for situations in which data is generated from the same cell type for both but possibly under dif-ferent experimental conditions.
A comprehensive evaluation of footprinting was reported in
Gusmaoet al.(2016). Though more rigorous than previous com-parative analyses, their evaluation strategy was more informative for understanding footprinters in ade novo footprinting context. We provide a complementary footprinter evaluation from a motif-centric perspective. In our work, we focused on results at a 5% FPR to provide more practical insight on footprint detection accuracy at acceptable error rates. The ability of both DeFCoM and BinDNase to consistently outperform unsupervised footprinters, with the pos-sible exception of msCentipede, further supports supervised learning-based methods. We note that our results contradict accur-acy levels found in the previous evaluation for several footprinters. This demonstrates that evaluation methods can largely influence
Fig. 6.Comparison between using GM12878 ATAC-seq and DNase-seq data
with DeFCoM. Partial AUC (left) and full AUC (right) results from cross-valid-ation tests for 18 TFs.
reported performance. The de novo footprinters DNase2TF and FOS performed poorly in our tests, because they failed to report a score for many of the motif sites in the test set. Our results in con-junction with previous studies highlight the importance of evaluat-ing a footprinter in the context for which it was designed.
ATAC-seq is quickly being adopted as it requires less biological starting material, and we show DeFCoM performs comparably with these data. As we learn more about the nuances of footprinting in both DNase- and ATAC-seq, we expect footprinters will adapt ac-cordingly. In light of this, our implementation of DeFCoM in an open-source, modularized and object-oriented framework makes it conducive to modification and improvement. As such, we welcome and encourage collaborative efforts with others in the scientific com-munity to address the needs of researchers as the field evolves.
Acknowledgements
The authors thank Shelsa Marcel for conducting preliminary analyses and Paul Cotney for guidance in the software release process. We also thank Tatsunori Hashimoto for his support in updating PIQ for compatibility with our motif site evaluation sets.
Funding
NIGMS award number T32GM067553, NIEHS award number R01ES023195 and the UNC Lineberger Comprehensive Cancer Center.
Conflict of interest: None declared.
References
Boser,B.E.et al. (1992) A training algorithm for optimal margin classifiers. In: Proceedings of the 5th Annual ACM Workshop on Computational Learning Theory. ACM Press, New York, pp. 144–152.
Boyle,A.P.et al. (2008a) High-resolution mapping and characterization of open chromatin across the genome.Cell,132, 311–322.
Boyle,A.P. et al. (2008b) F-Seq: a feature density estimator for high-throughput sequence tags.Bioinformatics,24, 2537–2538.
Boyle,A.P.et al. (2011) High-resolution genome-wide in vivo footprinting of diverse transcription factors in human cells.Genome Res.,21, 456–464. Buenrostro,J.D.et al. (2013) Transposition of native chromatin for fast and
sensitive epigenomic profiling of open chromatin, DNA-binding proteins and nucleosome position.Nat. Methods,10, 1213–1218.
Chen,X.et al. (2010) A dynamic Bayesian network for identifying protein-binding footprints from single molecule-based sequencing data. Bioinformatics,26, 334–342.
Cuellar-Partida,G.et al. (2012) Epigenetic priors for identifying active tran-scription factor binding sites.Bioinformatics,28, 56–62.
Feingold,E.et al. (2004) The ENCODE (ENCyclopedia Of DNA Elements) Project.Science,306, 636–640.
Grant,C.E.et al. (2011) FIMO: scanning for occurrences of a given motif. Bioinformatics,27, 1017–1018.
Gusmao,E.G.et al. (2016) Analysis of computational footprinting methods for DNase sequencing experiments.Nat. Methods,13, 303–309.
He,H.H.et al. (2013) Refined DNase-seq protocol and data analysis reveals intrinsic bias in transcription factor footprint identification.Nat. Methods,
11, 73–78.
Hesselberth,J.et al. (2009) Global mapping of protein-DNA interactions in vivo by digital genomic footprinting.Nat. Methods,6, 283–289. Johnson,D.S.et al. (2007) Genome-wide mapping of in vivo protein-DNA
interactions.Science,316, 1497–1502.
Kahara,J. and Lahdesmaki,H. (2015) BinDNase: a discriminatory approach for transcription factor binding prediction using DNase I hypersensitivity data.31, 2852–2859.
Kheradpour,P. and Kellis,M. (2014) Systematic discovery and characteriza-tion of regulatory motifs in ENCODE TF binding experiments.Nucleic Acids Res.,42, 2976–2987.
Landt,S.G.et al. (2012) ChIP-seq guidelines and practices of the ENCODE and modENCODE consortia.Genome Res.,22, 1813–1831.
Luo,K. and Hartemink,A.J. (2013) Using DNase digestion data to accurately identify transcription factor binding sites.Pac. Symp. Biocomput.,2013, 80–91.
Nag,R. and Smerdon,M.J. (2009) Altering the chromatin landscape for nucleotide excision repair. Mutat. Res. Rev. Mutat. Res., 682, 13–20.
Neph,S.et al. (2012) An expansive human regulatory lexicon encoded in tran-scription factor footprints.Nature,489, 83–90.
Pedregosa,F.et al. (2012) Scikit-learn: Machine Learning in Python.J. Mach. Learn. Res.,12, 2825–2830.
Piper,J.et al. (2013) Wellington: a novel method for the accurate identification of digital genomic footprints from DNase-seq data.Nucleic Acids Res.,41, e201.
Pique-Regi,R.et al. (2011) Accurate inference of transcription factor binding from DNA sequence and chromatin accessibility data.Genome Res.,21, 447–455.
Raj,A.et al. (2015) msCentipede: modeling heterogeneity across genomic sites and replicates improves accuracy in the inference of transcription factor binding.PLoS One,10, 1–15.
Sherwood,R.I.et al. (2014) Discovery of directional and nondirectional pion-eer transcription factors by modeling DNase profile magnitude and shape. Nat. Biotechnol.,32, 171–178.
Siggers,T. and Gordan,R. (2014) Protein-DNA binding: Complexities and multi-protein codes.Nucleic Acids Res.,42, 2099–2111.
Sing,T. et al. (2005) ROCR: Visualizing classifier performance in R. Bioinformatics,21, 3940–3941.
Song,L. et al. (2011) Open chromatin defined by DNaseI and FAIRE identifies regulatory elements that shape cell-type identity.Genome Res.,
21, 1757–1767.
Sung,M.H.H.et al. (2014) DNase footprint signatures are dictated by factor dynamics and DNA sequence.Mol. Cell,56, 1–11.
Thomas,S.et al. (2011) Dynamic reprogramming of chromatin accessibility during Drosophila embryo development.Genome Biol.,12, R43.